Kor. J. Mater. Res.
Vol. 22, No. 7 (2012)
329
†Corresponding author
E-Mail : [email protected] (J. Kim)
Effects of Cu and Ag Addition on Nanocluster Formation Behavior in Al-Mg-Si Alloys
JaeHwang Kim
†, Hiroyasu Tezuka, Equo Kobayashi and Tatsuo Sato*
Department of Metallurgy and Ceramics Science, Tokyo Institute of Technology, 2-12-1, Ookayama, Meguro-ku, Tokyo, Japan
*Precision and Intelligence Laboratory, Tokyo Institute of Technology, 4259-R2-18, Nagatsuta, Midori-ku, Yokohama, Japan
(Received June 12, 2012 : Received in revised form June 18, 2012 : Accepted June 18, 2012)
Abstract
Two types of nanoclusters, termed Cluster (1) and Cluster (2) here, both play an important role in the age-hardening behavior in Al-Mg-Si alloys. Small amounts of additions of Cu and Ag affect the formation of nanoclusters. Two exothermic peaks were clearly detected in differential scanning calorimetry(DSC) curves by means of peak separation by the Gaussian method in the base, Cu-added, Ag-added and Cu-Ag-added Al-Mg-Si alloys. The formation of nanoclusters in the initial stage of natural aging was suppressed in the Ag-added and Cu-Ag-added alloys, while the formation of nanoclusters was enhanced at an aging time longer than 259.2 ks(3 days) of natural aging with the addition Cu and Ag. The formation of nanoclusters while aging at 100oC was accelerated in the Cu-added, Ag-added and Cu-Ag-added alloys due to the attractive interaction between the Cu and Ag atoms and the Mg atoms. The influence of additions of Cu and Ag on the clustering behavior during low-temperature aging was well characterized based on the interaction energies among solute atoms and on vacancies derived from the first-principle calculation of the full-potential Korrinaga-Kohn-Rostoker(FPKKR)-Green function method. The effects of low Cu and Ag additions on the formation of nanoclusters were also discussed based on the age-hardening phenomena.Key words
Al-Mg-Si alloys, aging, nanoclusters, Cu addition, Ag addition.1. Introduction
The age-hardenable Al-Mg-Si alloys have been widely used for body panels of automobiles due to their good formability, corrosion resistance and precipitation hardening response. With appearance of advanced equipments such as a three dimensional atom probe(3DAP), the study of nano-scale clusters in the initial stage of phase decompo- sition in the Al-Mg-Si alloys has become highly attractive.
Yamada et al.
1)and Serizawa et al.
2)clearly revealed the existence of two types of nanoclusters, Cluster (1) and Cluster (2), in Al-Mg-Si alloys. The different characteristics of two types of nanoclusters such as the formation tem- perature,
2)growth behavior
2)and interaction with disloca- tions
3)affect the following aging behavior.
4)Yamada et al.
1)and Kim et al.
4)explained that the formation of Cluster (1) causes the negative effect of two-step aging while the formation of Cluster (2) prior to the formation of Cluster (1) suppresses the negative effect.
Addition of microalloying elements such as Cu
4,5)and Ag
6,7)strongly affects the formation of precipitates and mechanical properties. It is reported that the Cu-containing
Al-Mg-Si alloys produce the QC,
8)QP,
8)Q',
9,10)L,
10,11)S
11)precipitates, while the Ag-containing Al-Mg-Si alloys pro-
duce the Ag-containing β'
12-14)phase. Sato et al.
15)empha-
sized the role of microalloying elements in the age-
hardening behavior of the Al-based alloys with a proposal
of “Nanocluster Assist Processing(NCAP)”. However, the
roles of Cu and Ag in the nanocluster formation behavior
in Al-Mg-Si alloys are still poorly understood due to the
very rapid formation of nanoclusters with extremely small
size even though many researches
4-14)have been carried
out on the age-hardening behavior by the Cu and Ag
addition. The direct observation using an atom probe or
3DAP technique would be a powerful tool to understand
the clustering behavior such as the chemical composition
and size of nanoclusters, but the time required for the
sample preparation make it difficult to observe the initial
clustering behavior. In order to understand the clustering
behavior, indirect observation such as the differential scan-
ning calorimetry(DSC), positron annihilation lifetime spec-
troscopy(PALS), hardness and electrical resistivity mea-
surements and computer simulation are quite useful methods
to understand the early stage of the phase decomposition
in Al-Mg-Si alloys. Furthermore, a first-principle calcula-
tion provides invaluable information to understand the
atomic bonding behavior. With those requirements of the
systematic researches for understanding the early stage of the phase decomposition in Al-Mg-Si alloys, describing the initial clustering behavior through the indirect observa- tion methods is still challenged. The present authors, therefore, aim to investigate the effects of the Cu and Ag addition on the nanocluster formation behavior in Al-Mg- Si alloys mainly through those indirect methods. The pre- viously obtained results using 3DAP by Serizawa et al.
3)are basically utilized regarding the formation behavior of the two types of nanoclusters with the Cu and Ag addition. In order to elaborate the clustering behavior influenced by the Cu and Ag addition at the initial stage of phase decomposition, the obtained experimental results such as the hardness and electrical resistivity changes are dis- cussed in terms of the interaction energies among solute atoms and vacancies.
2. Experimental Procedure
Four alloys named as Base, Cu-added, Ag-added and
Cu-Ag-added are used in this study. Their chemical com- positions are shown in Table 1. The solid solution heat treatment(ST) is performed at 560
oC for 1.8 ks followed by quenching into the ice-water at 0
oC for 60 s. Then, the single aging is performed at room temperature(natural aging, NA) or the isothermal aging at 100
oC. DSC was operated using a Rigaku equipment of DSC823D/TAS- 200 ranging from −50
oC to 170
oC with 30 mg Al (99.99%) as a reference under an argon atmosphere with a heating rate of 5
oC/min. The DSC measurements just after ST are performed within 0.3 ks in order to minimize clustering during the sample preparation. Micro Vickers hardness measurements were employed using Mitsutoyo HM-102 within 0.3 ks after each heat treatment in order to minimize the NA effect. Seven hardness measure- ments for each data were acquired. The maximum and minimum values were ignored and the average of the remaining five was used. Meanwhile, other hardness measurements longer than 0.3 ks of NA are performed on time. The electrical resistivity measurements were per- formed at −196
oC using liquid nitrogen by a four-probe method with 120 mA direct current. The specimen for the electrical resistivity measurement was put into liquid nitrogen within 1 or 2 s just after each heat treatment.
Then, the electrical resistivity measurement is performed.
The electrical resistivity results without time delay for the sample preparation may elaborate the initial clustering behavior.
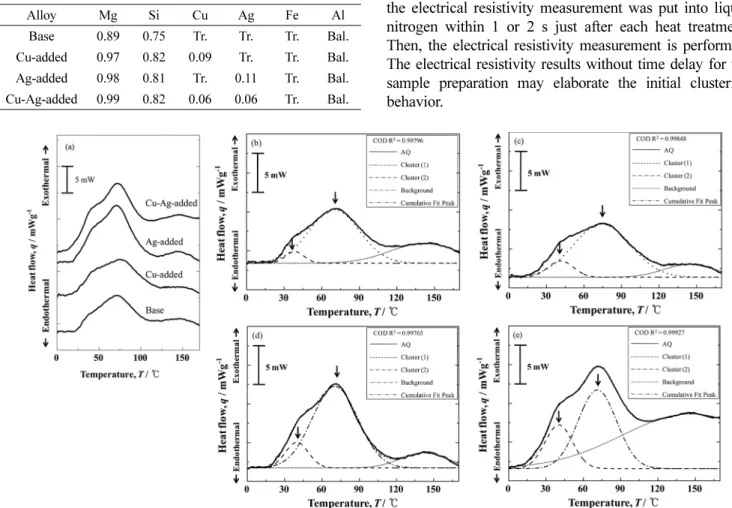
Fig. 1. DSC results of (a) the as-quenched specimens ranging from 0 to 170oC with heating rate of 5oC / min in the Base, Cu-added and Ag-added alloys. Peaks of nanoclusters are fitted by Gaussian function in the (b) Base, (c) Cu-added, (d) Ag-added and (e) Cu-Ag- added alloys.
Table 1. Chemical compositions of the alloys (at. %).
Alloy Mg Si Cu Ag Fe Al
Base 0.89 0.75 Tr. Tr. Tr. Bal.
Cu-added 0.97 0.82 0.09 Tr. Tr. Bal.
Ag-added 0.98 0.81 Tr. 0.11 Tr. Bal.
Cu-Ag-added 0.99 0.82 0.06 0.06 Tr. Bal.
3. Results
Fig. 1 shows the DSC results of the as-quenched speci- mens of the Base, Cu-added, Ag-added and Cu-Ag-added alloys ranging from 0 to 170
oC with a heating rate of 5
oC/
min. The obtained DSC results are fitted by the Gaussian function in order to clearly understand the peak tempera- ture of nanoclusters.
16)The peak point around 140
oC in each curve in Fig. 1 is selected as a background of the
DSC measurements in order to obtain the peak tempera- ture by the Gaussian function. Two exothermic peaks indicated by arrows as shown in Figs. 1(b) to (e) appear at 38.4 and 69.9
oC in the Base alloy, 41.4 and 74.3
oC in the Cu-added alloy, 39.9 and 70.4
oC in the Ag-added alloy, 40.4 and 71.3
oC in the Cu-Ag-added alloy, respectively.
Chang et al .
16)also obtained the peak temperature of nano- clusters using a similar method. Based on the previous 3DAP and DSC results
2)the lower temperature peak
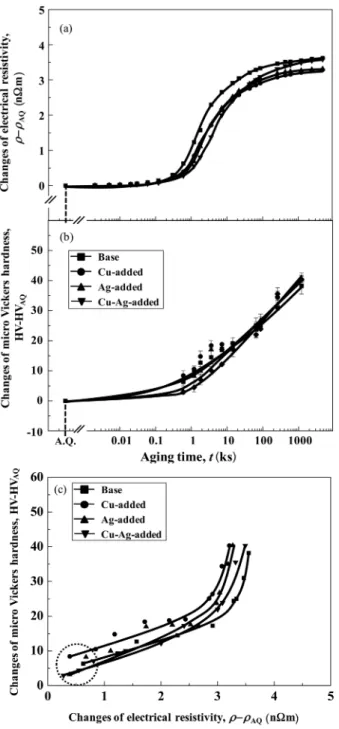
Fig. 2. Changes of the (a) electrical resistivity and (b) hardness during natural aging and (c) the changes of the hardness as a function of changes of electrical resistivity in the Base, Cu-added, Ag-added and Cu-Ag-added alloys.
Fig. 3. Changes of the (a) electrical resistivity and (b) hardness during aging at 100oC and (c) the changes of the hardness as a function of changes of electrical resistivity in the Base, Cu-added, Ag-added and Cu-Ag-added alloys.
around 40
oC can be assigned to Cluster (1) and the higher temperature peak around 70
oC to Cluster (2).
Fig. 2 shows the changes of the electrical resistivity and hardness during NA in the Base, Cu-added, Ag-added and Cu-Ag-added alloys. The hardness and electrical re- sistivity changes are basically due to the formation of nanoclusters. As indicated by a circle in Fig. 2(c), the lower hardness and electrical resistivity changes at the initial NA are confirmed in the Ag-added and Cu-Ag- added alloys than the Base alloy. The slightly higher hardness obtained after NA for longer time than 259.2 ks (3 days) in the Cu-added, Ag-added and Cu-Ag-added alloys than the Base alloy as shown in Fig. 2(b).
Fig. 3 shows the changes of the electrical resistivity and hardness during aging at 100
oC in the Base, Cu-added, Ag-added and Cu-Ag-added alloys. The Cu-added alloy shows a similar behavior to the Base alloy at the early stage of aging at 100
oC in both the hardness and electrical resistivity changes. Electrical resistivity and hardness, how- ever, increase more in the Cu-added alloy than in the Base alloy with increasing the aging time. On the other hand, the formation of Cluster (2) is greatly accelerated in the Ag-added and Cu-Ag-added alloys than the Base alloy from the initial aging at 100
oC as shown in Fig. 2(c).
4. Discussions
Banhart et al.
17,18)divided the clustering behavior during NA into four stages based on the DSC and PALS analysis and assumed that the vacancy-solute complex is formed at the first stage of NA. Banhart et al.
17)also concluded that vacancies would be increasingly trapped and immobilized in the Si-rich clusters and then, the formation of the Mg-Si co-clusters is expected. Gupta et al.
19)and Chang et al.
16)explained that the Si-rich clusters are first formed and Mg atoms are incorporated into the Si-rich clusters during NA.
Serizawa et al.
20)found experimentally using a 3DAP technique that the Si rich clusters bearing vacancies are formed at the initial stage of NA by the analysis of the inter-atomic distance between the solute atoms inside the nanoclusters. They also clarified that Mg atoms incorporate into the Si rich clusters with increasing the NA time. A similar clustering behavior to that already reported by Serizawa et al.
2,20)is considered to occur during NA in the Base alloy of the present study. The hardness increase is retarded up to 0.6 and 1.2 ks during NA in the Ag-added and Cu-Ag-added alloys as shown in Fig. 2(b). The for- mation of the Si rich clusters are suppressed by the Ag addition at the initial stage of NA since the hardness mainly increases due to the formation of nanoclusters.
Maeguchi et al.
21)in our group also found that the electrical resistivity at the early stage of NA in the Ag- added alloy is lower than that in the Base alloy. In order to
discuss reasonably the clustering behavior during NA, the interaction energies among solute atoms and vacancies are considered. The interaction energies are derived from the first-principle calculation based on the full-potential Korrinaga-Kohn-Rostoker(FPKKR)-Green function method.
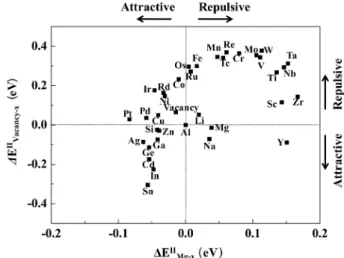
The energy difference of the nearest neighbor two-body interactions in Al between X and Y, ∆E
IIX-Y, is derived from the energy difference between the situations when the X and Y, i.e., microalloying elements or vacancies, are located in the nearest neighbor and infinitely far away on the aluminum lattice.
22-27)∆E
IIMg-Xand ∆E
IIVacancy-Xin Fig.
4 represent the nearest neighbor two-body interactions in Al between Mg and X atoms and between vacancies and X atoms, respectively. X is labeled beside each plot, cor- responding to a microalloying element or vacancy in Al- Mg-Si-X alloys.
22-27)Positive and negative values represent the repulsive and attractive interactions, respectively. In- teraction energy maps provide valuable information to estimate the atomistic bonding at the initial stage of the phase decomposition in the age-hardenable Al-Mg-Si alloys.
An expected clustering behavior in the age-hardenable Al alloys predicted by the interaction energies among solute atoms and vacancies is experimentally confirmed by the hardness, electrical resistivity measurements and 3DAP analysis in Al-Mg-Si,
28-30)Al-Cu,
30)Al-Cu-Mg,
28,29)Al- Zn,
31)Al-Zn-Ag
32)and Al-Zn-Mg
28,29)alloys in our group.
Wolverton
33)also calculated the solute-vacancy bonding
energies through the first-principle calculation based on the
local density approximation and the generalized gradient
approximation(GGA). It was found that Au, Si and Ag
atoms, smaller than the Al atom, show strong binding
energies with vacancies exceptionally since the lager solute
atoms causing significant strain on the surrounding Al
atoms would prefer to relax towards the vacancy to relieve
Fig. 4. Relationship between the nearest neighbor two-body interac- tions in Al derived from a first-principle calculation based on FPKKR-Green function method: ∆EIIMgi-X and ∆EIIVacancy-X . See the text in detail.22-27)the strain.
33)Based on the first-principle calculation re- garding the interactions among solute atoms and va- cancies,
22-27,33)Sn, In Cd, Ge, Ag, Ga, Si and Zn show the attractive interactions with vacancies. Ag, Cd, In and Sn atoms strongly attract the vacancies based on the interaction energies
22-27,33)as shown in Fig. 4. Kimura et al.
34)proposed the vacancy trapping model, that is, Sn atoms trap vacancies resulting in retardation of the formation of GP zones in the Al-Cu alloys. It is worth noting that Ag atoms preferentially trap vacancies and retard the formation of Cluster (1). The low Cu addition would not strongly influence on the formation of Cluster (1) at the early stage of NA since Cu represents the repulsive interaction with vacancies. On the other hand, Cu and Ag atoms enhance the formation of nanoclusters at the aging time longer than 259.2 ks (3 days) of NA based on the hardness results as shown in Fig. 2. Torsæter
35)confirmed that Cu atoms are clearly incorporated into nanoclusters during NA for 7 days in the both Al-0.40%
Mg-0.84% Si(Si-rich alloy) and Al-0.86% Mg-0.43% Si (Mg-rich alloy) alloys based on the 3DAP analysis. Fur- thermore, more pronounced Cu incorporation into the nanoclusters in the Mg rich alloy (NA for 7 days) than in the Si-rich alloys is confirmed.
35)Cu and Ag representing the strong attractive interactions with Mg can enhance the clustering behavior when Mg atoms are incorporated into the Si rich clusters during NA.
The formation of Cluster (2) at the early stage of aging at 100
oC is enhanced in the Ag-added and Cu-Ag-added alloys than in the Base and Cu-added alloys as indicated in Fig. 3. Serizawa et al.
3)found that the average Cu and Ag concentration inside Cluster (2) is higher value than those of alloy compositions deducing that Cu and Ag atoms have strong interaction with solute atoms. It is noted that Cu and Ag having strong attractive interactions with Mg
22-27)accelerate the formation of Cluster (2) as shown in Fig. 3.
Osamura et al.
36)proposed the electrical resistivity change through the two-band model in an Al-Zn alloy. Based on their proposal, the electrical resistivity can be expressed as follows.
ρ = ρ
0+ ρ
M+ ρ
P(1)
where, ρ
0, ρ
Mand ρ
Prepresent the electrical resistivity by the lattice vibration in the pure Al, solute atoms in the matrix and precipitates, respectively. ρ
0does not change during isothermal aging. The term ρ
Phighly contributes the total electrical resistivity changes compared with ρ
Mduring the low temperature aging. As a result, the elec- trical resistivity increases during the low temperature aging as shown in Figs. 2 and 3. The electrical resistivity by the solute atoms in the matrix can be described as
follows.
(2) where, and C
Srepresent the average of the electrical resistivity per one weight percent of the remained solute atoms in the matrix and concentration of solute atoms, respectively. Yokota et al.
37)well summarized the effect of microalloying elements on the electrical resistivity and pro- duced the average value of in Al alloys. The different values of for Cu and Ag also affects the electrical resistivity changes in Figs. 2 and 3. Further researches on the concentration chages of nanoclusters will elaborate the clustering behavior during the low temperature aging.
5. Conclusion
The effects of the Cu and Ag addition on the nano- cluster formation behavior during the low temperature aging are investigated using DSC, electrical resistivity and hardness measurements in Al-Mg-Si alloys. The previously reported results are also discussed based on the Si rich clusters at the early stage of NA and Mg atoms incorporate into the nanoclusters as increasing the NA time.
2,17-20)The roles of Cu and Ag in the clustering behavior during natural aging(NA) and 100
oC aging are discussed based on the interaction energies among solute atoms and vacancies derived from the first-principle calculation. The obtained results are summarized as follows.
1) The DSC curves of the as-quenched alloys are well fitted by the Gaussian function, indicating two peaks cor- responding to Cluster (1) and Cluster (2). The formation behavior of nanoclusters are detected by the resistivity and hardness changes.
2) The formation of nanoclusters at the initial stage of NA is suppressed in the Ag-added and Cu-Ag-added alloys through the vacancy trapping since Ag represents the strong attractive interactions with vacancies. On the other hand, both the Cu and Ag enhance the formation of nanoclusters after NA for longer time than 259.2 ks (3 days).
3) The formation of nanoclusters from the initial stage of aging at 100
oC is accelerated in the Ag-added and Cu- Ag-added alloys. Both the Cu and Ag accelerate the growth of nanoclusters with increasing the aging time.
Acknowledgements
Present authors are grateful to Furukawa-Sky Aluminum Corporation for the material supply and Tokyo Institute of Technology Global COE Program Education and Research Center for Material Innovation for the financial support.
ρM =
∑
(ρs0×Cs) ρs0ρs0 ρs0
References
1. K. Yamada, T. Sato and A. Kamio, J. Jpn. Inst. Light Met., 51(4), 215 (2001) (in Japanese).
2. A. Serizawa, S. Hirosawa and T. Sato, Metall. Mater.
Trans. A, 39A, 243 (2008).
3. A. Serizawa, T. Sato and W. J. Poole, Phil. Mag. Lett., 90, 279 (2010).
4. J. Kim, E. Kobayashi and T. Sato, Mater. Trans., 52(5), 906 (2011).
5. S. Esmaeili, X. Wang, D. J. Lloyd and W. J. Poole, Metall.
Mater. Trans. A, 34A, 751 (2003).
6. K. Matsuda, K. Kido, T. Kawabata, Y. Uetani and S. Ikeno, J. Jpn. Inst. Light Met., 53, 528 (2003) (in Japanese).
7. Y. Baba and A. Takashima, J. Jpn. Inst. Light Met., 19(3), 90 (1969) (in Japanese).
8. C. Cayron, L. Sagalowicz, O. Beffort and P. A. Buffat, Phil. Mag. A, 79(11), 2833 (1999).
9. K. Matsuda, S. Ikeno, Y. Uetani and T. Sato, Metall.
Mater. Trans. A, 32A, 1293 (2001).
10. D. J. Chakrabarti and D. E. Laughlin, Progr. Mater. Sci., 49, 389 (2004).
11. C. D. Marioara, S. J. Andersen, T. N. Stene, H. Hasting, J. Walmsley, A. T. J. Van Helvoort and R. Holmestad, Phil. Mag., 87(23), 3385 (2007).
12. K. Matsuda, , S. Ikeno, T. Sato and Y. Uetani, Scripta Mater., 55, 127 (2006).
13. J. Nakamura, K. Matsuda, T. Kawabata, T. Sato, Y.
Nakamura and S. Ikeno, Mater. Trans., 51(2), 310 (2010).
14. C. D. Marioara, J. Nakamura, K. Matsuda, S. J. Andersen, R. Holmestad, T. Sato, T. Kawabata and S. Ikeno, Phil.
Mag., 92(9), 1149 (2012).
15. T. Sato, S. Hirosawa, K. Hirose and T. Maeguchi, Metall.
Mater. Trans. A, 34A, 2745 (2003).
16. C. S. T. Chang and J. Banhart, Metall. Mater. Trans. A, 42A, 1960 (2011).
17. J. Banhart, C. S. T. Chang, Z. Liang, N. Wanderka, M. D.
H. Lay and A. J. Hill, Adv. Eng. Mater., 12, 559 (2010).
18. J. Banhart, M. D. H. Lay, C. S. T. Chang and A. J. Hill, Phys. Rev. B, 83, 014101 (2011).
19. A. K. Gupta and D. J. Lloyd. Metall. Mater. Trans. A, 30,
879 (1999).
20. A. Serizawa, W. J. Poole and T. Sato, Aluminium Alloys (ICAA-11) Vol. 1, p. 915, edited by J. Hirsch, B. Skrotzki, G. Gottstein, Wiley-VCH, USA (2008).
21. T. Maeguchi, K. Yamada and T. Sato, J. Jpn Inst. Metal., 66(3), 127 (2002) (in Japanese).
22. T. Hoshino and F. Nakamura, J. Metastable Nano- crystalline Materials, 24-25, 237 (2005).
23. S. Hirosawa, T. Omura, Y. Suzuki, T. Sato, Mater. Sci.
Forum, 519-521, 215 (2006).
24. T. Hoshino, W. Schweika, R. Zeller and P. H. Dederichs, Phys. Rev. B, 47, 5106 (1993).
25. M. Asato and T. Hoshino J. Jpn Inst. Metal., 63(6), 676 (1999) (in Japanese).
26. T. Hoshino, T. Mizuno, M. Asato and H. Fukushima, Mater. Trans., 42, 2206 (2001).
27. M. Asato, T. Mizuno, T. Hoshino and H. Sawada, Mater.
Trans., 42, 2216 (2001).
28. S. Hirosawa, F. Nakamura, T. Sato and T. Hoshino, J. Jpn.
Inst. Light Met., 56(11), 621 (2006) (in Japanese).
29. S. Hirosawa, F. Nakamura and T. Sato, Mater. Sci. Forum, 561-565, 283 (2007).
30. T. Sato, K. Hirose and S. Hirosawa, in Proceedings of the 9th International Conference on Aluminum Alloys(Brisbane, Australia, August 2004), ed. J. F. Nie, A. J. Morton and B.
C. Muddle(Institute of Materials Engineering Australasia), p. 956.
31. Y. Komiya, S. Hirosawa and T. Sato, Mater. Sci. Forum, 519-521, 437 (2006).
32. T. Ogura, S. Hirosawa, A. Cerezo and T. Sato, Mater. Sci.
Forum, 519-521, 431 (2006).
33. C. Wolverton, Acta Mater., 55, 5867 (2007).
34. H. Kimura and R. K. Hasiguti, Acta Metall., 9, 1076 (1961).
35. M. Torsæter, Ph. D. Thesis, p. 101-105, Norwegian Uni- versity of Science and Technology, Trondheim (2011).
36. K. Osamura, Y. Hiraoka and Y. Murakami, Phil. Mag., 28(4), 809 (1973).
37. M. Yokota and K. Sato, J. Jpn. Inst. Light Met., 32(8), 432 (1982) (in Japanese).