상이한 피음조건에서 자라는 3개 활엽수의 생리적 반응
김길남1·조민석2*·이수원2
1충남대학교산림자원학전공
,
2국립산림과학원산림생산기술연구소Physiological Responses of the Three Deciduous Hardwood Seedlings Growing Under Different Shade Treatment Regimes
Gil Nam Kim
1, Min Seok Cho
2*, and Soo Won Lee
21Department of Environment and Forest Resources, Chungnam National University, Daejeon 305-764, Korea
2Forest Practice Research Center, Korea Forest Research Institute, Pocheon 487-821, Korea
Abstract.
This present study was conducted to investigate photosynthetic characteristics, chlorophyll flu- orescence, chlorophyll contents of
Betula platyphyllavar.
japonica,
Prunus leveilleana,
Magnolia sieboldii, growing under four different light intensity regimes (full sun, and 64~73%, 35~42%, 9~16% of full sun). As result,
Betula platyphyllavar.
japonicashowed outstanding photosynthetic capacity and apparent quantum yield in full sun and showed low shade tolerance.
Prunus leveilleanashowed good photosynthetic capacity and apparent quantum yield in 64~73% or 35~42% of full sun and showed common shade tolerance. How- ever,
Magnolia sieboldiishowed good photosynthetic capacity and apparent quantum yield in 35~42% of full sun, while the lowest in full sun.
Magnolia sieboldiishowed the highest shade tolerance compared to the other species. As the shading level increased, the total chlorophyll contents of all species increased with sig- nificant difference.
Key words :
chlorophyll fluorescence, chlorophyll contents, photosynthetic capacity, shade tolerance
서 론
산림은안정적이고지속적으로이용가능한이상적 인 입체적 구조의복층림을 조성하기 위해서는 종의 다양성이유지되는수평적구조와임관이다층으로이 루어진수직적구조로의유도가필요하다
.
이러한입체 적구조를가진산림을조성및유지·관리하기위해 서는 임분의광환경과임분을구성하는수목의내음 성 기작과 생육 단계에 따른 내음성 수준의 변화를 이해하여야한다.
산림생태계는임지내에서생육하는산림식물과 토 양
,
기후 등의환경인자들이 서로상호작용을 하면서역동적인변화를보인다
.
특히,
광환경은수목의대사 활동에많은영향을미치는무기환경인자로서임분내 로투과되는광의양과질은수목의광합성,
호흡작용,
엽록소 함량 등에 매우 큰 영향을 미친다
(Kwon
등,
2000; Kim, 1986; Kozlowski
등, 1991).
이 때문에 임지의특성에따른수목과무기환경과관련된생리·생태학적연구는산림의생산성을향상시키기위한종 합적인정보구축및기술개발을위해필요하다
.
임지의생산성향상을위한천연림과인공림의갱신 및 무육관리과정에서 임분 내광 환경은중요한제 한인자가 될 수 있다
.
그러나 복잡한 입체적 구조를가진산림에서광환경은수종
,
임령,
임분밀도,
임분 구조 등에따라 매우큰차이가나타나며,
이때문에 임분 내광 환경이수목에 미치는영향을정확히파 악하기는 어렵다(Kwon
등, 1996; Han
과Kim, 1989;
Holmes
와Smith, 1975).
수목이군락을이루고있을때
,
하층에도달하는빛 의수준은매우 적으며군락의하층에도달하는빛은 상부와비교하였을때,
광도가낮아질뿐만아니라,
광질도 달라지게 된다
(Makino
등, 1997).
우선 임분의광환경을살펴보면
,
임관의상부는전천광을 그대로*Corresponding author: [email protected]
*Received February 22, 2010; Revised March 2, 2010;
*Accepted March 5, 2010
수광하고있으나
,
임관을통과하면서식물의광합성에 효율적인적색광과청색광영역의빛이흡수,
이용된다.
따라서치수가생육하는임상에도달한광은상층목이 수광하는노천광에비하여광도가현저하게저하되어 있다
(Inada, 1980; Smith, 1995).
임상의 광환경에서는 내음성수준이 낮은 수종은 엽록소함량이감소하고
,
빛흡수율과광합성의저하로 생장이 불량하게 된다(Kim
등, 2001; Kim
과Lee,
2001b).
반면내음성이높은수종또는중용수는잎의두께가얇아지고
,
면적이넓어지는형태적변화가나타나 수광량이 증대된다
(Kwon
등, 1996).
그리고생장에필요한에너지를생산하는광합성에서는암반응을 담당하는탄소고정계의효소와활성이저하하며
,
명반응을담당하는광화학계의색소와활성이증가하는생 화학적변화가나타나
,
광합성에대한흡수된빛의이용 효율이증가된다.
이러한현상은낮은광도조건에적응하여생존할수있는내음성의기작이된다
(Terasima
와Hikosaka, 1995).
또한광도변화에대한형태적·생화학적변화는광합성특성을나타내는광
-
광합성곡선에 반영되어,
암호흡속도,
광보상점,
광포화점,
최대광합성 속도,
순양자수율(apparent quantum yield)
을변화시킨다
(Kim
과Lee, 2001a; Terashima
와Evans, 1988).
그리고빛의이용효율에영향을미치는엽록소형광반
응과 엽록소
a, b
의 함량 및 이들의 성분비 변화를초래한다
(Kim
과Lee, 2001b).
따라서광도저하에 대한광합성특성과광합성색소의함량변화는수목의내
음성 수준을 나타내는 하나의 지표가 된다
(Woo
등,
1999; Kimmins, 1997).
광도가수목에미치는생리·생태학적영향을구명 하고자 하는 연구와 수종별 내음성 기작 및 수준에 관한연구는지속적으로이루어졌고
,
많은결과가보고 되고있지만숲의생태환경과 수종구성이상이한우 리나라의산림에국외의연구결과를그대로적용하기 는곤란하며,
우리나라수종에대한별도의생리·생 태학적 세부 연구는 지속적으로 조사될 필요가있다(Cho, 2008).
본연구에서는서로상이한광도에서자란자작나무
,
개벚나무
,
함박꽃나무를대상으로광합성특성,
엽록소 형광반응및엽록소함량변화를조사하여광도와관련 된생리·생태학적특성,
즉내음성지표를조사하고 자연구를실시하였다.
재료 및 방법
1. 공시수종 및 피음 처리 방법 1) 공시수종
본연구를실시하기위해사용된수종은북부지방산 림청 용문 양묘사업소에서 분양받은 자작나무
(
Betulaplatyphylla
var.
japonica) 1-1
묘와,
개벚나무(
Prunus leveilleana),
함박꽃나무(
Magnolia sieboldii) 1-0
묘의3
수종을이용하였다.
2) 피음 처리 방법
시험지는대전광역시유성구궁동에위치한충남대 학교농업생명과학대학묘포장으로
2007
년4
월에피음처리를위한 포장을조성한후
, 15cm × 15cm
간격으로 수종별
,
처리별로 각각4
개plot
에15
주씩 총60
주의 묘목을 반복 식재하였다
.
실험대상 수종을6
월 초까지 무피음하에서 정상적인 생리 상태를 회복할 때까지활착시킨후,
차광률이서로다른검정색차광 막을 이용하여 피음 수준을 전광 처리구(
상대투광율; 100%),
약피음처리구(
상대투광율; 64~73%),
보통피음 처리구(
상대투광율; 35~42%),
강피음처리구(
상대투광율
; 9~16%)
의4
단계로 하는 인위적인 피음 처리를실시하였다
. 2007
년 처리1
년차의모든 측정이 끝난 후10
월 초 차광막을 제거하였으며, 2008
년6
월 초 다시차광막을이용하여피음처리를실시하였다.
시험지의피음처리에따른주요환경인자를알아보 기 위하여 휴대용 광량측정기
(Li-250, LI-COR Inc., USA)
와 온습도계(HM34C, Vaisala, Finland)
를 이용 하여7
월의맑은날과흐린날에피음망하부에서2
시간간격으로매회
20
번이상반복측정하였다.
피음망 하부의광량은지면과수평으로측정하였다(Fig. 1).
2. 광합성 특성
피음 처리에 따른 광합성차이를 조사하기 위하여 식물별·처리별생장속도가 비슷하고
,
평균적인생육 상태를 유지하고 있는 당년생가지의 잎을 대상으로 처리별총9
회에걸쳐 연차별,
계절별로휴대용광합성 측정장치
(Portable photosynthesis system, Li-
6400, LI-COR Inc., USA)
를 이용하여 측정하였다.
광도를임의로조절할수있는
LED light source(LI-
6400-02, LI-COR Inc., USA)
를 이용하여PPFD(Pho-
tosynthetic Photon Flux Density)
를0, 25, 50, 100, 200, 500, 800, 1000, 1500, 2000
µmol
·m
−2·s
−1의10
수준으로차이를두어오전10
시부터오후2
시까지광합성 반응을 측정하였다
.
광합성 측정기의leaf chamber
에유입되는공기의유량은400
µmol
·s
−1,
온 도는25
oC
로 설정하여외기의 환경변화로 인한영향 이없도록하였다.
또한광합성측정기에CO
2injector system(LI-6400-01, LI-COR Inc., USA)
을 부착하여CO
2 농도를400 ± 2
µmol
·mol
−1범위 내에서안정된 상태를 유지하도록 하였다(Kim
등, 2001; Lim
등, 2006; Choi, 2001).
광도별광합성속도를측정하여광-
광합성곡선을작성
(Sigmaplot, 2000)
하고,
이곡선에서 순양자수율(apparent quantum yield),
광보상점,
광포화 점및 이때의광합성 능력(photosynthetic capacity)
등 을산출하였다(Kim
과Lee, 2001a; Barker
등, 1997).
3. 엽록소 형광반응 특성
수종별광도변화에따른엽록소형광 반응을조사 하기위하여연차별
,
계절별로엽록소형광반응측정기(Continuous source chlorophyll fluorometer, OSI
30P, ADC, UK)
를이용하여측정하였다.
형광반응측정은 광합성 측정과 동일한 잎을 대상으로
sample
Fig. 1. Diurnal changes of light intensity, air temperature, relative humidity following shading treatments in July (left; sunny days. right; cloudy days).
clip
으로광을차단하여측정전약20
분간측정대상 잎을암조건에적응시킨후측정하였다.
측정할때는2000
µmol
·m
−2·s
−1의광선을조사하였다(Choi
와Kim, 1995; Demmig
와Björkman, 1987).
초기 형광반응(F
o),
최대 형광반응(F
m),
형광반응 최대 변화치(F
v= F
m-F
o)
및광화학반응 효율(F
v/F
m)
의변수를 측정하여비교·분석하였다
.
4. 엽록소 함량 분석
피음 처리에 따른 엽록소 함량의변화를 조사하기 위하여 연차별
,
계절별로 엽록소 함량을 분석하였다.
엽록소의 추출은
Hiscox
와Israelstam(1978)
의방법에 따라DMSO(dimethylsulfoxide)
를 추출 용매로 이용하여 엽록소를 추출하였다
.
추출액을UV-Visible spectrophotometer(Nicolet Evolution 100, Thermo Electron Co., USA)
를이용하여663nm(A
663)
와645nm
(A
645)
의파장에서흡광도를측정하여아래와같은식으로 엽록소
a
와b
의 함량을 구하였다(Arnon, 1949;
Mackinney, 1941).
Chlorophyll a(mg
·g
−1·fresh wt.)
= (12.7 × A
663−2.69 × A
645) Chlorophyll b(mg
·g
−1·fresh wt.)
= (22.9 × A
645−4.68 × A
663) Total Chlorophyll(mg
·g
−1·fresh wt.)
= (8.02 × A
663+ 20.20 × A
645)
피음 처리에 따른 측정결과를 분석하기 위해서
Duncan
의다중 검정법으로피음 처리간의유의성분석을 실시하였다
.
모든 통계분석은PC SAS Program Version 8.2(SAS, 2000)
를이용하였다.
결과 및 고찰
1. 광합성 특성
1) 시기별·수종별 광합성 특성
광도변화에따른연차별
,
계절별세수종의광보상 Table 1. Estimated values of photosynthetic parameters in the three deciduous hardwood species under different shadingtreatment.
Species Season Relative
light intensity
(%)1
Light compensation
point (µmol · m−2· s−1)
Light saturation point (µmol · m−2· s−1)
Photosynthetic capacity (µmol CO2· m−2· s−1)
Apparent quantum yield (mmol CO2· mol−1)
Betula platyphylla var. japonica
2007
June A 36.0 1,648 22.8 66.5
July
A 49.0 1,344 14.6 51.4
B 36.6 1,188 14.0 56.7
C 26.7 0,781 12.5 64.5
D 22.3 0,711 08.0 40.3
September
A 41.5 1,688 19.0 41.8
B 29.5 1,031 14.0 58.0
C 31.6 0,758 12.0 60.1
D 21.7 0,719 07.4 40.0
2008 June
A 43.7 1,422 17.0 63.3
B 39.8 1,000 06.6 36.9
C 32.6 0,422 05.9 49.6
D 22.2 0,391 04.3 34.1
July
A 27.3 1,102 13.8 59.2
B 35.8 1,336 11.8 52.9
C 21.8 1,789 07.7 29.7
D 20.5 1,273 05.2 28.5
September
A 27.5 1,398 17.6 65.0
B 29.9 0,617 07.6 49.0
C 33.4 0,734 06.3 38.3
D 27.4 0,227 03.8 43.0
점
,
광포화점,
광합성 능력 및 순양자수율은Table 1
과같다
.
세수종의 생육시기별 광합성능력은실험1
년차 인2007
년에대부분9
월> 7
월> 6
월순으로나타났다.
Table 1. Continued.
Species Season Relative
light intensity
(%)1
Light compensation
point (µmol · m−2· s−1)
Light saturation point (µmol · m−2· s−1)
Photosynthetic capacity (µmol CO2· m−2· s−1)
Apparent quantum yield (mmol CO2· mol−1)
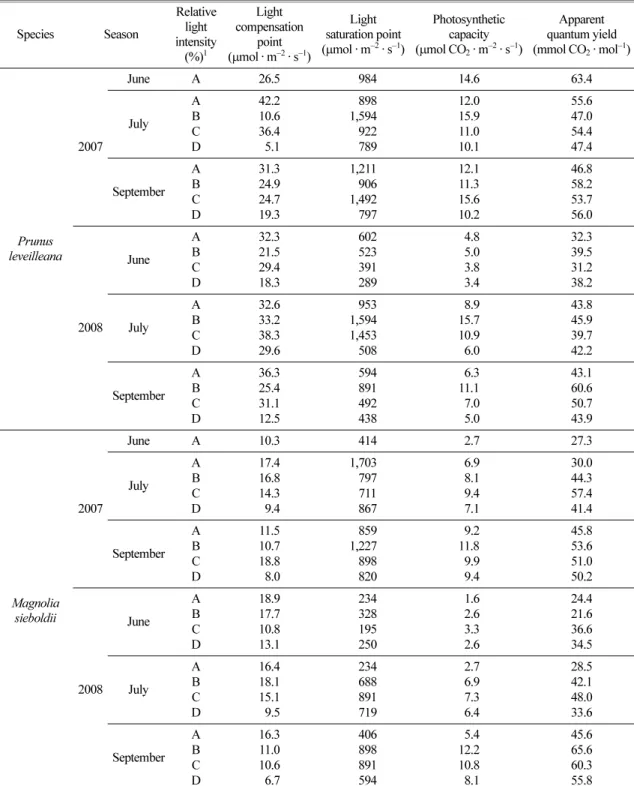
Prunus leveilleana
2007
June A 26.5 0,984 14.6 63.4
July
A 42.2 0,898 12.0 55.6
B 10.6 1,594 15.9 47.0
C 36.4 0,922 11.0 54.4
D 05.1 0,789 10.1 47.4
September
A 31.3 1,211 12.1 46.8
B 24.9 0,906 11.3 58.2
C 24.7 1,492 15.6 53.7
D 19.3 0,797 10.2 56.0
2008 June
A 32.3 0,602 04.8 32.3
B 21.5 0,523 05.0 39.5
C 29.4 0,391 03.8 31.2
D 18.3 0,289 03.4 38.2
July
A 32.6 0,953 08.9 43.8
B 33.2 1,594 15.7 45.9
C 38.3 1,453 10.9 39.7
D 29.6 0,508 06.0 42.2
September
A 36.3 0,594 06.3 43.1
B 25.4 0,891 11.1 60.6
C 31.1 0,492 07.0 50.7
D 12.5 0,438 05.0 43.9
Magnolia sieboldii
2007
June A 10.3 0,414 02.7 27.3
July
A 17.4 1,703 06.9 30.0
B 16.8 0,797 08.1 44.3
C 14.3 0,711 09.4 57.4
D 09.4 0,867 07.1 41.4
September
A 11.5 0,859 09.2 45.8
B 10.7 1,227 11.8 53.6
C 18.8 0,898 09.9 51.0
D 08.0 0,820 09.4 50.2
2008 June
A 18.9 0,234 01.6 24.4
B 17.7 0,328 02.6 21.6
C 10.8 0,195 03.3 36.6
D 13.1 0,250 02.6 34.5
July
A 16.4 0,234 02.7 28.5
B 18.1 0,688 06.9 42.1
C 15.1 0,891 07.3 48.0
D 09.5 0,719 06.4 33.6
September
A 16.3 0,406 05.4 45.6
B 11.0 0,898 12.2 65.6
C 10.6 0,891 10.8 60.3
D 06.7 0,594 08.1 55.8
1Relative light transmittances; A: 100%, B: 64~73% of full sun, C: 35~42% of full sun, D: 9~16% of full sun
피음 처리
2
년차인2008
년 시기별광합성능력은자 작나무와개벚나무는7
월> 9
월> 6
월순으로2007
년과는다른경향을보였으며
,
함박꽃나무는9
월> 7
월> 6
월순으로
2007
년과같은결과를보였다.
실험1
년차에서는이식후유증등의스트레스에의해초기생육활 동이 떨어지는 것을 알 수 있으며
,
시간이 지날수록여름에생육활동이 가장 왕성한것으로판단된다
.
이 결과는소나무(Kim, 1999)
와상수리나무(Woo
와Lee,
1992)
가여름에광합성활동이가장높다는결과와일치하는경향을보인것이다
.
그러나함박꽃나무는다른두수종과는달리가장늦게 생육활동이시작하는것 으로생각되어지며
8~9
월사이에가장왕성한생육활 동이이루어졌다고판단된다.
또한내음성수준에따라수종별생육활동이가장활발한시기가다른 것을알 수있다
.
전광조건에서생육한실험대상수종들간의광합성 능력비교에서는자작나무
,
개벚나무,
함박꽃나무순으로자작나무가가장우수한능력을보였다
.
특히자작 나무는함박꽃나무에비해약2
배이상의차이를보이 며높은광합성능력을나타냈다.
순양자수율은비교적낮은광조건에서광합성능력 의지표가되고빛에너지를화학에너지로변화시키 는광화학계
(photosystem)
의활성을나타낸다(Kim
등,
2001).
수종별순양자수율은자작나무에서가장높았으며개벚나무
,
함박꽃나무 순으로감소하였다.
이는수종별광합성능력의결과와같은경향으로높은광화 학계 활성에의해서 우수한광합성 능력이 나타나는
것이다
.
내음성수준을판단할수있는광보상점은함박꽃 나무가가장낮은값을보여자작나무와개벚나무보다 내음성이높다고 판단된다
.
이는 수종별광합성능력 과서로상반되는결과로서내음성이강한식물은낮 은 광도에서 광합성에 필요한광을 확보하기위하여 양수성수종과는생리적으로다른특성을나타내기때 문이다.
2) 광도 변화에 따른 수종별 광합성 특성
자작나무의경우에
2007
년7
월피음처리에따른광 포화점및광합성능력은전광 처리구에서가장우수 하였으며피음수준이증가할수록감소하는경향을보 였다.
또한9
월에도전광처리구에서는강피음처리구 보다 약2
배 이상 높은 광포화점 및 광합성 능력을보이면서가장높은값을나타냈다
. 2008
년7
월에조사된 광포화점 및광합성능력 또한 피음 수준이증
가할수록감소하는
2007
년과같은 경향을보였다.
피음 처리에따른 순양자수율은
2007
년에는다소 불규칙한경향을보였지만
, 2008
년에는광합성능력과같이전광처리구에서가장높은값을나타냈다
.
그러나광량이 지나치게 부족한강피음 처리구는 나머지세 처리구에비해현저히낮은광합성능력을나타냈으며
,
실험의 연차가 지날수록 그 차이가 커지는 것을 볼
수 있다
(Fig. 2).
이와 같은 결과를보면 자작나무가광선요구도보다적은광환경에서생장함으로서광합 성 능력을 점점 상실해 가는 것으로 생각된다
.
이는Fig. 2. Effect of shade treatment on the photosynthetic rate of Betula platyphylla var. japonica seedlings (left; 2007, right;
2008).
대표적인양수인이태리포플러
(Kim
등, 2001),
자작나 무(Choi, 2001),
박달나무(Cho, 2008),
펜둘라자작나무(Laisk
등, 2005)
의 광합성능력이 생육 광도의저하로낮아지는결과와유사한경향을보인것으로실험 대상수종 중자작나무가양수의광합성특성을가장 가깝게보여주는것이다
.
개벚나무는
2007
년은약피음또는보통피음처리구 에서 광포화점과 광합성 능력이 가장 우수하였으며, 2008
년에는약피음처리구에서가장우수한경향을나타냈다
(Fig. 3).
개벚나무역시 자작나무와 같이강피음처리구에서가장 낮은광합성능력을보여부족환 광환경에서는수목의생장이원활하지못하다는것을 알 수 있었다
.
또한 산벚나무의 광합성 능력이전광처리구와전광대비
30%
처리구에서큰차이가없으며,
상대적으로 전광대비
8%
처리구에서 광합성 능력이떨어지는결과
(Choi
등, 2006)
와유사한경향을보였다
.
순양자수율에서2007
년7
월은전광처리구, 9
월은 약피음 처리구에서 가장 높았으며, 2008
년은 약피음 처리구에서가장높은순양자수율을보였다.
이상의결과에서개벚나무는양수의특성뿐만아니라어느정도 의 내음성을 지닌 음수의 특성을 같이 가지고 있는 것으로판단된다
.
피음처리에따른함박꽃나무의광합성특성을살펴
보면
2007
년과2008
년7
월 보통피음 처리구에서 광포화점및광합성능력이가장우수하였으며
,
순양자수 율도 같은 경향이었다(Fig. 4).
함박꽃나무는 다른두수종과달리전광처리구에서가장낮은 광합성능력 을보였다
.
이는함박꽃나무가음수성이강하기때문에 강한광도에서는광저해(photoinhibition)
현상이나타 나 광합성 능력을떨어뜨리는 결과를 나타낸 것이다 Fig. 3. Effect of shade treatment on the photosynthetic rate of Prunus leveilleana seedlings (left; 2007, right; 2008).Fig. 4. Effect of shade treatment on the photosynthetic rate of Magnolia sieboldii seedlings (left; 2007, right; 2008).
(Lee
등, 2006; Einhorn
등, 2004).
이런 이유로 함 박꽃나무는 보통피음처리구에서광합성능력이가장 높았다고판단되며,
실험대상수종중음수의광합성 특성을가장강하게보여주고있다.
그러나강피음처 리구에서생장한개체들에서는광합성능력이약피음 처리구와보통피음처리구보다낮았는데이와같은결 과는함박꽃나무와같은음수도광량이지나치게부족 한환경에서는광합성기능이저하될수밖에없다는 사실을보여주고있다(Lu
등, 2003).
2. 엽록소 형광 반응 특성
생육시기별조사대상수종의광화학반응에대한 순양자수율의 최대치인 광화학효율은 실험
1
년차인2007
년대부분9
월> 7
월> 6
월순으로나타났다.
그러나 피음 처리
2
년차인2008
년 시기별 광화학효율은대부분
7
월> 9
월> 6
월순으로2007
년과는다른경향 을보였다.
대부분의수목이계절이지남에따라엽록소
b
의함량이증가하게 되며,
이에 따라광화학효율 도증가되는데본연구에서는실험1
년차에만이러한 경향을보였으며,
광합성특성의계절적변화와유사한 경향을나타냈다.
수종별광화학효율은자작나무가가장높은값을보 였으며
,
개벚나무,
함박꽃나무순으로감소되었다.
수종 별광화학효율의결과는광합성능력에서와같은결과 를 보였는데 이는 광화학효율이 광 스트레스에 대한중요한 지표로서
(Rascher
등, 2000),
광합성 능력과밀접한 관계에있으며
(Bose
등, 1988),
서로 비례 관계경향이나타난다
.
즉,
광합성능력이우수한자작나 무는다른두수종에비해상대적으로높은광화학효 율을 보인 것이다.
이는 수종별내음성 수준 판단과 연관이있는것으로전광조건에서내음성을지닌음 수는양수에비해광화학효율이낮다(Kitao
등, 2003)
는결과와같은경향이다
.
또한실제임분에서도양수성이강한물푸레나무는전광조건에서
,
음수성이강한 너도밤나무는숲틈또는피음지역에서광화학효율이 높다(Einhorn
등, 2004)
는결과와도같은경향을보인것이다
.
자작나무의형광반응특성에서광화학효율은
2007
년
, 2008
년모두 전광처리구에서 가장 높았으며,
피음수준이증가할수록감소하는경향을보였다
. 2007
년
9
월전광처리구에서광화학효율이0.84
로강피음처리구
0.78
에비해 유의적차이를보이며높은값을나타냈으며다른 처리구들에서는유의적인차이가없
었다
(Fig. 5).
이는 양수인자작나무가 전광처리구에서
,
신갈나무및고로쇠나무는전광대비5~10%
처리 구에서 가장 높은 광화학효율을 나타냈다(Kitao
등,
2000)
는결과와일치하는것이다.
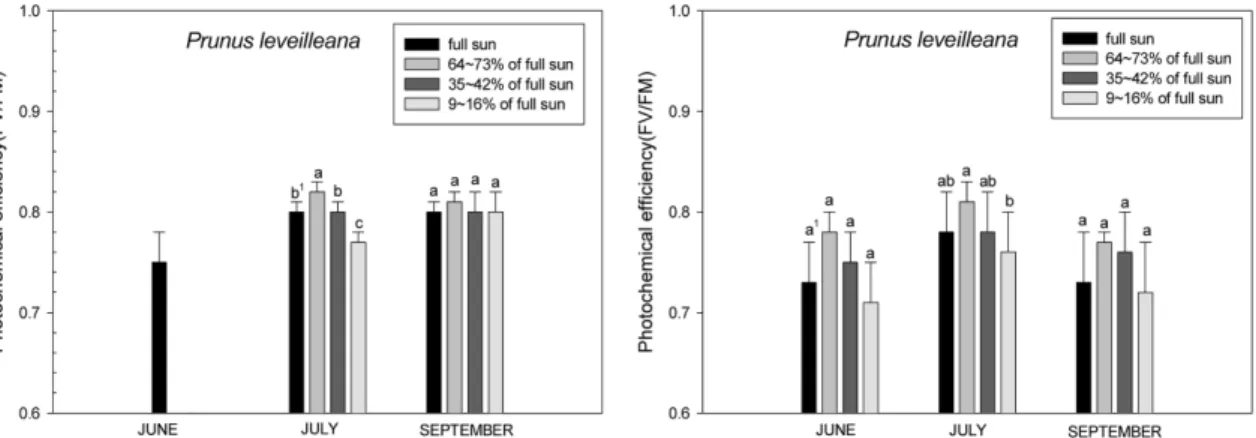
개벚나무의 형광 반응 특성은실험
1, 2
차년 모두약피음처리구에서가장우수하였으며
,
자작나무와같 이 강피음처리구에서 가장 낮은 값을 나타냈다(Fig.
6).
특히, 7
월에는유의적인차이를보이며약피음처리구에서가장우수한광화학효율을보였다
.
함박꽃나무의형광반응특성은
2007
년, 2008
년모 두보통피음처리구에서가장높게나타났으며,
약피음Fig. 5. Changes of Chlorophyll fluorescence in the Betula platyphylla var. japonica under different shading treatment (left;
2007, right; 2008). 1Different letters of a and b on the columns indicate statistical differences at the 5% levels by Duncan’s multiple range test.
처리구
,
강피음처리구,
전광처리구순으로광화학효율이 낮아지는 경향을나타냈다
(Fig. 7).
특히 함박꽃나무는다른두수종과는달리전광처리구에서가장 낮은 광화학효율을보였는데이는 함박꽃나무가음수 성이 강한 수종으로 전광 처리구에서 지나치게 강한
광도로 인해 광 저해
(photoinhibition)
현상을 일으킨것으로판단된다
.
위의 결과를종합해볼 때피음 처리에 대한수종 별광화학효율이높은처리구는상대적으로우수한광 합성능력을나타냈다
.
이는광화학효율이광합성특성에 영향을주는여러 요인중하나로서
,
피음처리 에 따른 수종별엽록소형광 반응 특성과그에 따른 광합성특성을보여주는것이다.
3. 엽록소 함량 분석
실험대상 수종들의 계절에따른 총 엽록소 함량은 대부분
9
월> 7
월> 6
월순으로계절이지남에따라지 속적으로증가하는 경향을보였다.
총 엽록소함량이 계절별로여름>
가을>
봄순으로변화한다는기존연 구 보고(Demarez
등, 1999; Choi
등, 2006)
와는 조금 다른경향을 보였다
.
또한 엽록소a/b
율은 계절이 지남에따라 각피음처리수준별로엽록소b
의함량 이a
의함량보다상대적으로크게증가하는현상을보여전체적으로엽록소
a/b
율의값은6
월보다7
월, 9
월에낮은값을보였다
(Choe
와Lee, 1995).
피음처리에따른 실험대상수종의총엽록소함량 은전광처리구가
0.92~2.42mg
·g
−1,
약피음처리구가Fig. 6. Changes of Chlorophyll fluorescence in the Prunus leveilleana under different shading treatment (left; 2007, right;
2008). 1Different letters of a, b and c on the columns indicate statistical differences at the 5% levels by Duncan’s multiple range test.
Fig. 7. Changes of Chlorophyll fluorescence in the Magnolia sieboldii under different shading treatment (left; 2007, right;
2008). 1Different letters of a, b and c on the columns indicate statistical differences at the 5% levels by Duncan’s multiple range test.
1.24~2.94mg
·g
−1,
보통피음처리구1.65~3.78mg
·g
−1,
강피음처리구
2.24~4.31mg
·g
−1으로강피음처리구가전광처리구보다약
2mg
·g
−1정도많은함량을보였다
(Table 2).
피음처리에따른 대부분의조사대상 수종에서강 피음 처리구가 가장 많은 총 엽록소 함량을보였고
,
Table 2. Seasonal changes of chlorophyll contents in the seedlings of the three deciduous hardwood under different shading treatment.
Species Season Relative light
intensity(%)1 Chl. aChlorophyll content (mg/g f. w.)Chl. b Total Chl. Chlorophyll a/b
Betula platyphylla var. japonica
2007
June A 2.21 ± 0.13 0.77 ± 0.06 2.98 ± 0.18 2.86 ± 0.11 July
A 1.43 ± 0.39a2 0.46 ± 0.12a 1.89 ± 0.51a 3.07 ± 0.09a B 1.71 ± 0.32a 0.54 ± 0.10a 2.25 ± 0.41a 3.15 ± 0.11a C 1.73 ± 0.13a 0.58 ± 0.03a 2.31 ± 0.16a 2.99 ± 0.09a D 1.83 ± 0.15a 0.63 ± 0.11a 2.46 ± 0.26a 2.95 ± 0.29a September
A 1.52 ± 0.30b 0.51 ± 0.07c 2.04 ± 0.37b 2.94 ± 0.17a B 2.13 ± 0.12a 0.81 ± 0.04b 2.94 ± 0.16a 2.63 ± 0.01ab C 2.21 ± 0.10a 0.91 ± 0.12ab 3.13 ± 0.23a 2.44 ± 0.24bc D 2.29 ± 0.11a 1.05 ± 0.14a 3.33 ± 0.25a 2.20 ± 0.20c
2008
June
A 1.77 ± 0.39b 0.53 ± 0.12c 2.30 ± 0.52b 3.35 ± 0.06a B 1.97 ± 0.02b 0.63 ± 0.02bc 2.60 ± 0.04b 3.10 ± 0.07b C 2.06 ± 0.05ab 0.69 ± 0.04b 2.75 ± 0.08b 2.97 ± 0.10b D 2.38 ± 0.06a 1.10 ± 0.10a 3.48 ± 0.16a 2.18 ± 0.15c July
A 1.60 ± 0.07d 0.50 ± 0.06c 2.10 ± 0.13c 3.20 ± 0.24a B 2.08 ± 0.09c 0.72 ± 0.06bc 2.80 ± 0.15b 2.88 ± 0.15ab C 2.24 ± 0.12b 0.90 ± 0.12b 3.13 ± 0.23b 2.52 ± 0.21b D 2.47 ± 0.03a 1.44 ± 0.20a 3.91 ± 0.22a 1.73 ± 0.23c September
A 1.82 ± 0.22c 0.60 ± 0.10c 2.42 ± 0.33b 3.05 ± 0.16a B 2.13 ± 0.07b 0.79 ± 0.05bc 2.92 ± 0.11b 2.71 ± 0.09a C 2.40 ± 0.05a 1.38 ± 0.44a 3.78 ± 0.49a 1.84 ± 0.48b D 2.39 ± 0.02a 1.12 ± 0.04ab 3.51 ± 0.06a 2.14 ± 0.06b
Prunus leveilleana 2007
June A 1.53 ± 0.21 0.45 ± 0.05 1.98 ± 0.27 3.36 ± 0.08 July
A 1.43 ± 0.25b 0.46 ± 0.06a 1.88 ± 0.28b 3.14 ± 0.59a B 1.75 ± 0.14ab 0.55 ± 0.05a 2.30 ± 0.19ab 3.17 ± 0.08a C 1.80 ± 0.24ab 0.60 ± 0.13a 2.40 ± 0.38ab 3.03 ± 0.24a D 2.00 ± 0.38a 0.83 ± 0.38a 2.83 ± 0.76a 2.59 ± 0.59a September
A 1.35 ± 0.27b 0.50 ± 0.13a 1.85 ± 0.40b 2.73 ± 0.24a B 1.65 ± 0.51ab 0.73 ± 0.24a 2.39 ± 0.74ab 2.29 ± 0.34a C 1.67 ± 0.19ab 0.62 ± 0.11a 2.30 ± 0.29ab 2.70 ± 0.16a D 2.05 ± 0.32a 0.92 ± 0.36a 2.97 ± 0.68a 2.35 ± 0.46a
2008
June
A 1.63 ± 0.31c 0.42 ± 0.11c 2.05 ± 0.42c 3.94 ± 0.32a B 1.96 ± 0.28bc 0.56 ± 0.19bc 2.52 ± 0.47bc 3.63 ± 0.61ab C 2.16 ± 0.15ab 0.70 ± 0.10b 2.86 ± 0.25b 3.11 ± 0.26b D 2.44 ± 0.01a 1.29 ± 0.09a 3.74 ± 0.09a 1.89 ± 0.12c July
A 1.12 ± 0.08b 0.38 ± 0.04c 1.49 ± 0.12c 2.99 ± 0.09ab B 1.26 ± 0.10b 0.35 ± 0.11c 1.61 ± 0.21c 3.85 ± 1.19a C 2.33 ± 0.14a 0.98 ± 0.25b 3.31 ± 0.39b 2.45 ± 0.45bc D 2.48 ± 0.01a 1.84 ± 0.14a 4.31 ± 0.14a 1.35 ± 0.10c September
A 1.55 ± 0.55b 0.56 ± 0.22b 2.11 ± 0.77c 2.77 ± 0.10a B 1.96 ± 0.08ab 0.74 ± 0.09b 2.70 ± 0.16bc 2.67 ± 0.20a C 2.15 ± 0.24ab 1.01 ± 0.34b 3.15 ± 0.59ab 2.24 ± 0.44a D 2.43 ± 0.04a 1.61 ± 0.31a 4.04 ± 0.34a 1.54 ± 0.28b
전광처리구가가장 적은총엽록소함량을나타냈으 며
,
피음 수준이강해질수록 유의적차이를보이면서 총엽록소함량은증가하는경향을보였다.
이는일반적으로피음처리수준이높아질수록총엽록소함량 이 높아진다는 연구 보고
(Son
등, 2006; Jeong
과Kim, 1999)
와같은경향을나타낸것이다.
그러나자작나무와함박꽃나무는
2008
년9
월보통피음처리구에서가장높은총엽록소함량을보였다
.
엽록소a
와b
각 각의함량변화도총엽록소함량과같은경향이었다.
피음 수준이 높아지면서 엽록소
b
의 함량 증가가 엽록소a
의함량에비해상대적으로더크게증가했다.
이때문에피음강도가강해지면서엽록소
a/b
율이감 소하는경향을나타냈다(Kwon
등, 1996).
위의결과를종합해볼때광도 변화에따라총엽 록소 함량이나 엽록소
a
와b
의 함량 및비율이달라진다는 것을 알 수 있으며
(Woo
등, 1999),
본 실험에서도 피음 처리 수준이 높아질수록 엽록소 함량이 증가되며
,
특히엽록소b
의함량이더높아진것을확인할 수 있었다
.
이와 같은 현상이 일어나는 이유는 광량이부족한광환경에서수목이적응하면서정상적 으로광합성을지속하기위해광에너지를가능한많이 확보하는방법으로엽록소함량을높게유지할필요가 있기때문이다(Ashton
과Berlyn, 1992).
적 요
본연구에서는자작나무
,
개벚나무,
함박꽃나무를대 상으로 피음수준을 전광 처리구(
상대투광율; 100%),
약피음처리구
(
상대투광율; 64~73%),
보통피음처리구(
상대투광율; 35~42%),
강피음 처리구(
상대투광율;
9~16%)
로달리하여이들의내음성및광요구도에관한 광합성 특성과 엽록소 형광 반응
,
엽록소 함량을조사·분석하였다
.
세수종의 생육시기별 광합성능력은
7
월과9
월에 가장높은값을나타냈으며,
자작나무와개벚나무에비 해함박꽃나무의광합성능력이매우낮았다.
순양자수Table 2. Continued.
Species Season Relative light
intensity(%)1 Chl. aChlorophyll content (mg/g f. w.)Chl. b Total Chl. Chlorophyll a/b
Magnolia sieboldi 2007
June A 1.20 ± 0.22 0.37 ± 0.06 1.57 ± 0.28 3.22 ± 0.16 July
A 1.11 ± 0.31b 0.32 ± 0.08b 1.44 ± 0.37b 3.54 ± 0.77a B 1.39 ± 0.15ab 0.43 ± 0.05ab 1.82 ± 0.18ab 3.23 ± 0.34a C 1.28 ± 0.36ab 0.39 ± 0.06b 1.66 ± 0.42b 3.27 ± 0.41a D 1.72 ± 0.12a 0.54 ± 0.07ab 2.26 ± 0.08a 3.24 ± 0.56a September
A 1.28 ± 0.25a 0.40 ± 0.07a 1.67 ± 0.32a 3.22 ± 0.03a B 1.86 ± 0.25a 0.64 ± 0.12a 2.50 ± 0.36a 2.91 ± 0.24a C 1.41 ± 0.19a 0.46 ± 0.11a 1.87 ± 0.30a 3.14 ± 0.30a D 1.87 ± 0.49a 0.64 ± 0.25a 2.50 ± 0.74a 3.03 ± 0.43a
2008
June
A 1.39 ± 0.08c 0.37 ± 0.03c 1.76 ± 0.11c 3.79 ± 0.13a B 1.65 ± 0.19bc 0.46 ± 0.09bc 2.11 ± 0.28bc 3.58 ± 0.25ab C 1.75 ± 0.25b 0.52 ± 0.10b 2.27 ± 0.34b 3.35 ± 0.16b D 2.31 ± 0.05a 0.85 ± 0.03a 3.16 ± 0.08a 2.71 ± 0.04c July
A 0.68 ± 0.04c 0.24 ± 0.01b 0.92 ± 0.04c 2.84 ± 0.21a B 0.93 ± 0.20bc 0.31 ± 0.06b 1.23 ± 0.25bc 3.03 ± 0.06a C 1.24 ± 0.27b 0.41 ± 0.09b 1.65 ± 0.36b 3.01 ± 0.02a D 1.97 ± 0.33a 0.70 ± 0.19a 2.67 ± 0.52a 2.87 ± 0.29a September
A 0.96 ± 0.08b 0.35 ± 0.02b 1.31 ± 0.08b 2.73 ± 0.26a B 1.30 ± 0.33ab 0.43 ± 0.11ab 1.73 ± 0.44ab 3.02 ± 0.11a C 1.71 ± 0.09a 0.61 ± 0.05a 2.31 ± 0.12a 2.83 ± 0.20a D 1.66 ± 0.45a 0.58 ± 0.22ab 2.24 ± 0.66a 2.92 ± 0.38a
1Relative light transmittances; A: 100%, B: 64~73% of full sun, C: 35~42% of full sun, D: 9~16% of full sun
2Different letters of a, b, and c within the columns indicate statistical differences at the 5% levels by Duncan,s multiple range test
율또한광합성능력과같은경향을나타냈다
.
수목의 내음성수준을판단할수있는광보상점은함박꽃나무 가자작나무와개벚나무에비해강한내음성을나타냈 다.
피음 처리별광합성능력에서는 자작나무는전광 처리구에서가장우수하였으며,
개벚나무는시기별차이는있지만강피음처리구를제외한나머지세처리 구에서비슷한광합성능력을보였다
.
함박꽃나무는보 통피음처리구에서가장좋은광합성능력을나타냈다.
피음처리별엽록소형광반응특성에서광화학반응 에대한순양자수율의최대치인광화학효율
(F
v/F
m)
은자작나무의경우전광처리구에서가장우수하였으며피 음수준이 증가할수록감소하였다
.
개벚나무는약피음 처리구에서가장우수한광화학효율을보였으며,
함박꽃나무는보통피음처리구에서가장양호한광화학효율을 나타냈다
.
특히함박꽃나무는다른두수종과는달리전 광처리구에서가장낮은값을나타냈다.
이결과는세 수종의피음수준별광합성능력과같은결과를보였다.
실험대상수종들의총엽록소함량은세수종모두 피음수준이증가할수록높아지는경향을보였다
.
특히 전광 처리구에 비해서강피음 처리구에서 총 엽록소 함량이유의적차이를 보이면서가장 높게나타났다.
엽록소
a
와b
각각의함량 변화도총 엽록소함량과 같은경향이었다.
피음수준이높아지면서엽록소b
의 함량 증가가 엽록소a
의 함량에 비해 상대적으로 더 크게증가하였는데이때문에피음강도가강해지면서 엽록소a/b
율이감소하는경향을나타냈다.
위의결과를종합해볼때세수종의적정생육광 도는 자작나무는 전광처리구
(
상대투광율; 100%),
개 벚나무는약피음처리구(
상대투광율; 64~73%),
함박꽃나무는보통피음처리구
(
상대투광율; 35~42%)
가적합 하다고판단된다.
그러나수목의생육에있어서광도뿐 만아니라온도,
습도,
토양환경,
경쟁식생등여러가 지 다양한 환경인자가 관여하기 때문에 광도 변화와 연계한보다많은연구가필요할것으로판단된다.
주제어 : 광합성
,
광화학효율,
내음성,
엽록소,
피음처리인 용 문 헌
1. Arnon, D.I. 1949. Copper enzymes in isolated chloro- plasts polyphenoloxidase in Beta Vulgaris. Plant Phys- iol. 24(1):1-15.
2. Ashton, P.M.S. and G.P. Berlyn. 1992. Leaf adapta- tions of some Shorea species to sun and shade. New Phytol. 121(4):587-596 (in Korea).
3. Barker, M.G., M.C. Press, and N.D. Brown. 1997.
Photosynthetic characteristics of dipterocarp seedlings in three tropical rain forest light environments: a basis for niche partitioning. Oecologia 112:453-463 (in Korea).
4. Bose, S., S.K. Hurbert, and D.C. Fork. 1988. Fluores- cence characteristics of photoinhibition and recovery in a sun and a shade species of the red algal genus Porphyra. Plant Physiol. 86:946-950.
5. Cho, M.S. 2008. Effects of light intensity on physio- logical characteristics and growth performances of deciduous hardwood species distributed in the central temperate zone of korean forest. Chungnam national university Master’s dissertation 81pp (in Korea).
6. Choe, H.S. and H.J. Lee. 1995. Seasonal changes of chlorophyll contents and photosynthetic rates in four species of maple trees in Korea. Journal of Ecology and Field Biology 18(1):137-146.
7. Choi, J.H. 2001. Effects of artificial shade treatment on the growth performances, water relations, and pho- tosynthesis of several tree species. Chungnam national university Doctor’s dissertation 152pp.
8. Choi, J.H., K.W. Kwon, and J.C. Chung. 2006. Changes in chlorophyll contents and photosynthetic characteris- tics of hardwood species according to artificial shade treatment. J. Korean For. Soc. 95(5):614-620.
9. Choi, Y.B. and J.H. Kim. 1995. Change in needle chlo- rophyll fluorescence of Pinus densiflora and Pinus thunbergii treated with artificial acid rain. Jour. Korean For. Soc. 84(1):97-102.
10. Demarez, V., J.P. Gastellu-etchegorry, E. Mougin, G.
Marty, and C. Proisy. 1999. Seasonal variation of leaf chlorophyll content of a temperate forest. Inversion of the PROSPECT model. Int. J. Remote Sensing 20(5):
879-894.
11. Demmig, B. and O. Bjrkman. 1987. Comparison of the effect of excessive light on chlorophyll fluorescence (77K) and photon yield of O2 evolution in leaves of higher plants. Planta 171:171-184.
12. Einhorn, K.S., E. Rosenqvist, and J.W. Leverenz. 2004.
Photoingibition in seedlings of Fraxinus and Fagus under natural light conditions: Implications for forest regeneration?. Oecologia 140(2):241-251.
13. Han, S.S. and H.S. Kim. 1989. Effects of light, tem- perature, and water stress on the photosynthesis and respiration rates of leaves in four Oak Species. Jour.
Korean For. Soc. 78(2):151-159.
14. Hiscox, J.D. and G.F. Israelstam. 1978. A method for the extraction of chlorophyll from leaf tissue without maceration. Can. J. Bot. 57:1332-1334.
15. Holmes, M.G. and H. Smith. 1975. The function of
phytochrome in plants growing in the natural environ- ment. Nature 254:512-514.
16. Inada, K. 1980. Spectral absorption property of pig- ments in living leaves and its contribution to photosyn- thesis. Jan. J. Crop science 49:286-294.
17. Jeong, H.H. and K.S. Kim. 1999. Effects of shading on the Growth of Hedera rhombea Bean and Pachysan- dra terminalis Sieb. et Zucc. Kor. J. Hort. Sci. & Tech.
17(1):29-32.
18. Kim, P.G. and E.J. Lee. 2001a. Ecophysiology of pho- tosynthesis 1: Effect of light intensity and intercellular CO2 pressure on photosynthesis. Korean Journal of Agricultural and Forest Meteorology 3(2):126-133.
19. Kim, P.G. and E.J. Lee. 2001b. Ecophysiology of pho- tosynthesis 2: Adaptation of the photosynthetic apparatus to changing environment. Korean Journal of Agricul- tural and Forest Meteorology 3(3):171-176.
20. Kim, P.G., Y.S. Yi, D.J. Chung, S.Y. Woo, J.H. Sung, and E.J. Lee. 2001. Effect of light intensity on photo- synthetic activity of shade tolerant and intolerant tree species. Jour. Korean For. Soc. 90(4):476-487.
21. Kim, Y.C. 1986. Effect of inorganic environmental fac- tors on the growth of Pinus koraiensis seedlings(1) - The influence of shading in the growth of seedlings grown on the seed bed -. Jour. Korean For. Soc. 73:43-54.
22. Kim, Y.H. 1999. Growth characteristics and crown architecture of Pinus densiflora S. et Z. at an early stage of regeneration in canopy gap. Seoul national university Doctor’s dissertation 100pp.
23. Kimmins, J.P. 1997. Forest ecology (2nd ed.). prentice hall. New Jersey 596pp.
24. Kitao, M., H. Utsugi, S. kuramoto, R. Tabuchi, K.
Fujimoto, and S. Lihpai. 2003. Light-dependent photo- synthetic characteristics indicated by chlorophyll fluo- rescence in five mangrove species native to Pohnpei Island, Micronesia. Physiol. Plantarum 117:376-382.
25. Kitao, M., T.T. Lei, T. Koike, H. Tobita, and Y.
Maruyama. 2000. Susceptibility to photoinhibition of three deciduous broadleaf tree species with different successional traits raised under various light regimes.
Plant, Cell and Environment 23:81-89.
26. Kozlowski, T.T., P.J. Kramer, and S.G. Pallardy. 1991. The Physiology of Woody Plants. A.P. New York. pp. 811.
27. Kwon, K.W., J.H. Choi, and J.C. Chung. 2000. Stud- ies on the shade tolerance light requirement and water relations of economic tree species (2). Jour. Korean For. Soc. 89(2):198-207.
28. Kwon, K.W., S.A. Kim, and D.K. Lee. 1996. Effect of light intensity on chlorophyll contents in the leaves of several species of conifers and hardwoods subjected to artificial shading treatment. The institute of environ- mental science and technology chungnam national uni- versity 14:42-49.
29. Laisk, A., H. Eichelmann, V. Oja, B. Rasulov, E. Padu,
L. Bichele, H. Pettai, and O. Kull. 2005. Adjustment of leaf photosynthesis to shade in a natural canopy: rate parameters. Plant, Cell and Environment 28:375-388.
30. Lee, C.H., C.H. Shin, K.S. Kim, and M.S. Choi. 2006.
Effects of light intensity on photosynthesis and growth in seedling of Kalopanax pictus Nakai. Korean Jour- nal of Madicinal Crop Science 14(4):244-249.
31. Lim, J.H., S.Y. Woo, M.J. Kwon, J.H. Chun, and J.H.
Shin. 2006. Photosynthetic capacity and water use effi- ciency under different temperature regimes on healty and declining korean Fir in Mt. Halla Jour. Korean For. Soc. 95(6):705-710.
32. Lu, Q., X. Wen, C. Lu, Q. Zhang, and T. Kuang. 2003.
Photoingibition and photoprotection in senescent leaves of field-grown wheat plants. Plant Physiol. and Bio- chem. 41:749-754.
33. Mackinney, G. 1941. Absorption of light by chloro- phyll solution. J. Biol. Chem. 140:315-322.
34. Makino A., T. Sato, H. Nakano, and T. Mae. 1997. Leaf photosynthesis, plant growth and nitrogen allocation in rice under different irradiances. Planta 203:390-398.
35. Rascher, U., M. Liebig, and U. Lttge. 2000. Evalua- tion of instant light-response curves of chlorophyll flu- orescence parameters obtained with a portable chlorophyll fluorometer on site in the field. Plant, Cell and Envi- ronment. 23:1397-1405.
36. SAS institute Inc. 2000. SAS/STAT TM Guide for Per- sonal Computer. Version 8 Edition. SAS Institute Inc., N. C. 1026pp.
37. Sigmaplot. 2000. philscience. 136pp.
38. Smith, H. 1995. Physiololgical and ecological func- tion within the phytochrome family. Annu. Rev. Plant Physiol. Plnat Mol. Biol. 46:289-315.
39. Son, S.G., S.M. Je, S.Y. Woo, K.O. Byun, Y.J. Kang, and B.S. Kwang. 2006. Physiological differences of Ilex rotunda and Illicium anisatum under low light intensities. Korean Journal of Agricultural and Forest Meteorology 8(2):61-67.
40. Terashima, I. and J.R. Evans. 1988. Effects of light and nitrogen nutrition on the organization of the photo- synthetic apparatus in spinach. Plant and Cell Physiol- ogy 29(1):143-155.
41. Terashima, I. and K. Hikosaka. 1995. Comparative ecophysiology of leaf and canopy photosynthesis. Plant, Cell and Environment 18(10):1111-1128.
42. Woo, S.Y. and D.K. Lee. 1992. Effects of different light intensities and nutrition conditions on photosyn- thesis and ribulose-Diphosphate carboxylase activity of Quercus acutissima carr. seedlings. Jour. Korean For. Soc. 81(1):11-20.
43. Woo, S.Y., D.S. Lee, and O.K. Kwon. 1999. Shading effects on growth and chlorophyll contents of abies holophylla. Korean Journal of Agricultural and Forest Meteorology 1(2):97-102.