Received: 31 December 2016 Revised: 13 January 2017 Accepted: 16 January 2017
Copyright Ⓒ Korean Solar Energy Society This is an Open-Access article distributed under the terms of the Creative Commons Attribution NonCommercial License which permits unrestricted non-commercial use, distribution, and reproduction in any medium, provided the original work is properly cited.
Journal of the KoreanSolar Energy Society Vol.37, No.1, pp.71-80, February 2017 https://doi.org/10.7836/kses.2017.37.1.071 pISSN : 1598-6411
eISSN : 2508-3562 OPEN ACCESS
데이터센터용 멀티 외기이용 냉방시스템의 지역별 에너지 절감효과에 대한 연구
박문기*・ 장현재**†
***
ECODA 기업부설연구소
***
홍익대학교 건축공학과
A Study on the Regional Energy Conservation Effects of a Multi-stage Outdoor Air Enabled Cooling System in a Data Center
Park Moon-Ki* ・ Chang Hyun-Jae**†
***
Research center, ECODA
***
School of Architectural Engineering, HongIk University
†
Corresponding author: [email protected]
Abstract
A Data center houses a large number of server computers, storage and etc in racks. With the rapid increase of heat generation rates per rack in a data center, energy consumption rates for cooling have been increased year by year. In this study, energy conservation effects of a MOA (multi-stage outdoor air enabled) cooling system in a data center has been investigated when it is applied to 5 different locations, Korea. As results, Energy conservation effects of the MOA cooling system was achieved at about 20% to 30%. Humidifier operation time was 40 to 55 days when supply air temperature was maintained at 13, and humidity condition was kept within the allowed range even though humidifier was off. Furthermore, humidification was not needed when supply air temperature was maintained at 25°C. In selected 5 locations in Korea, the difference of regional climatic conditions affected no more than 5% in cooling energy consumption rates.
Keywords:
데이터센터(Data center),
이코노마이저 사이클(Economizer cycles),
에너지 시뮬 레이션(Energy simulation),
에너지절약(Energy conservation)
기호설명
MOA : Multi-stage outdoor air SAT : Supply air temperature (℃) LWT : Leaving water temperature (℃) SH : Sensible heat (W)
LH : Latent heat (W)
CRAC : Computer room air conditioner WBT : Wet-bulb temperature (℃) DP : Dew-point temperature (℃) DBT : Dry-bulb temperature (℃) RH : Relative humidity (%) Alt. : Altitude (m)
SD : Standard deviation
1. 서 론
최근의 IT 산업의 발전과 함께 데이터센터의 수요도 급증하고 있다. 데이터센터는 대량의 서버 컴퓨터와 저장장치 등을 수 용하고 운용하는 곳으로서, 서버 컴퓨터 등으로부터의 발열량이 매우 커서 냉방부하가 일반 오피스 빌딩의 10~20배에 이른다.
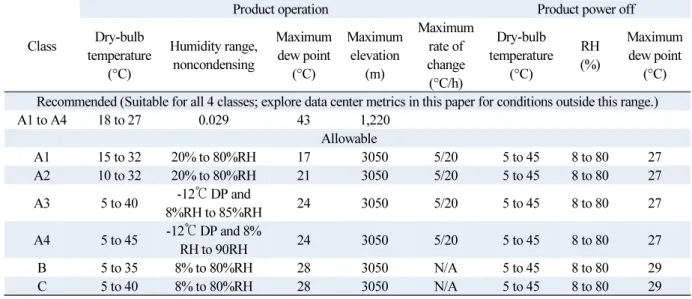
데이터 센터는 내부 발열량이 부하의 대부분을 차지하기 때문에 겨울철에도 냉방을 해야 하며, 에너지 다소비 건물로서 냉방에 너지 절약의 필요성이 크게 대두되고 있다. 서버 컴퓨터 등의 안정적 운영을 위한 실내 환경기준 1) 을 Table 1에 나타낸다.
데이터센터의 에너지 절약을 위한 연구로서, 조진균 2) 등은 국내 기후조건에서 외기냉방시스템과 외기냉수냉방 시스 템의 에너지 절약효과에 대해 검토하였으며, 에너지 절약효과의 관점에서는 외기냉방이 외기냉수냉방에 비해 훨씬 유리 하지만, 공기청정, 가습/제습 에너지, 설치비용 등의 종합적 고려가 필요함을 강조하였다. 함상우 3) 등은 모듈러 데이터센 터를 대상으로, 국내 5개 지역에서 다양한 외기냉방 시스템과 급기 조건 변화시의 에너지 성능을 분석하였으며, 외기를 직접도입하는 방식보다 간접도입하는 방식의 에너지 절감효과가 더 크다고 하였다. 김제영 4) 등은 멀티 외기이용 냉방시 스템(MOA cooling system, multi-stage outdoor air enabled cooling system)을 소개하고, 이 시스템의 에너지 절감효 과, 외기도입량 및 가습기 운전시간 등에 대해 외기냉방 및 외기냉수냉방 시스템과 비교하여 분석하였다.
Table 1
Thermal guidelines for data processing environmentsClass
Product operation Product power off
Dry-bulb temperature
(°C)
Humidity range, noncondensing
Maximum dew point
(°C)
Maximum elevation
(m)
Maximum rate of change (°C/h)
Dry-bulb temperature
(°C)
RH (%)
Maximum dew point
(°C) Recommended (Suitable for all 4 classes; explore data center metrics in this paper for conditions outside this range.)
A1 to A4 18 to 27 0.029 43 1,220
Allowable
A1 15 to 32 20% to 80%RH 17 3050 5/20 5 to 45 8 to 80 27
A2 10 to 32 20% to 80%RH 21 3050 5/20 5 to 45 8 to 80 27
A3 5 to 40 -12℃ DP and
8%RH to 85%RH 24 3050 5/20 5 to 45 8 to 80 27
A4 5 to 45 -12℃ DP and 8%
RH to 90RH 24 3050 5/20 5 to 45 8 to 80 27
B 5 to 35 8% to 80%RH 28 3050 N/A 5 to 45 8 to 80 29
C 5 to 40 8% to 80%RH 28 3050 N/A 5 to 45 8 to 80 29
본 연구에서는, 멀티 외기이용 냉방시스템을 국내 5개 도시에 적용한 경우의 에너지 절약효과에 대해 검토하여, 지역 에 따른 에너지 절감효과의 차이를 비교· 분석하고자 한다.
2. 외기이용 냉방시스템
2.1 이코노마이저 사이클
이코노마이저 사이클(Economizer cycles)은 데이터센터의 냉방에너지 절약을 위한 대표적인 외기이용 시스템으로서, 외기냉수냉방 시스템(Water-side economizer cycles)와 외기냉방 시스템(Air-side economizer cycles)이 있다.
외기냉수냉방 시스템은 중앙 수냉식 냉방시스템의 냉각탑을 매개로 하여 외기의 온· 습도 조건이 냉각탑의 냉각수만 으로 필요한 냉수온도를 만들 수 있을 때 사용하는 방식이며, 외기의 직접도입이 없기 때문에 가습 또는 제습부하가 발생 하지 않고, 외기 도입에 의한 오염물질 유입의 우려가 없다. 그러나 외기온도가 충분히 낮은 경우에만 사용할 수 있어 이 용가능 시간이 외기냉방 시스템에 비해 짧은 편이다 5) .
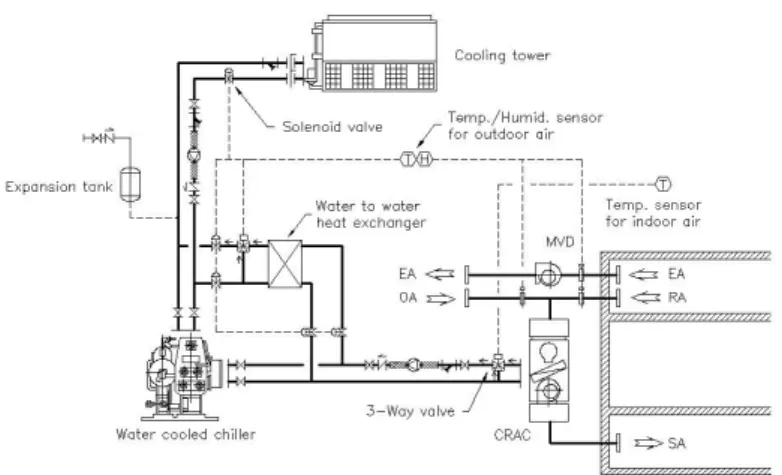
Fig. 1
Schematic of the Multi-stage outdoor air enabled (MOA) cooling system4)외기냉방 시스템은 외기를 직접 또는 간접 도입하여 실내를 냉방하는 시스템으로서, 이용가능 시간이 외기냉수냉방 시스템에 비해 길고 에너지 절약 효율이 상대적으로 높은 편이다. 그러나 외기를 직접 도입하는 경우는, 기후특성에 따라 가습부하가 현열부하 저감률보다 오히려 커질 수가 있으며 6) , 오염물질의 유입에 대한 우려도 있다 5) . 분진오염에 대해서 는 MERV 11등급 이상의 필터를 사용하면 문제시 되지 않는다는 보고 7) 도 있다.
멀티 외기이용 냉방시스템은 외기냉수냉방 시스템과 외기냉방시스템의 특성이 서로 상반된다는 점에 착안하여, 두 시
스템을 조합한 시스템이다(Fig. 1 참조 4) ). 즉, 외기이용 시간이 짧지만 외기의 직접도입에 따르는 우려가 없는 외기냉수
냉방 시스템을 우선적으로 사용하고, 외기냉수냉방 시스템만으로는 냉방부하 제거가 불충분한 경우에 대해 외기냉방 시
스템을 부분적 또는 전면적으로 활용하는 시스템이다. 이를 통해 외기를 이용한 이코노마이저 사이클을 보다 효율적으
로 사용할 수 있을 것으로 기대된다. 외기 조건에 따른 멀티 외기이용 냉방시스템의 운전 모드를 Fig. 2 4) 에 나타낸다.
∙ Zone “W”: Water-side economizer operates.
∙ Zone “WA”: Water-side economizer operates first, and is compensated by air-side economizer.
∙ Zone “A1”: Air-side econimozer operates when the enthalpy and the temperature of outside air are lower than those of the supply air.
∙ Zone “A2”: Air-side economizer operates with the aid of mechanical cooling system when the enthalpy and the temperature of outdoor air are lower than those of the return air.
∙ Zone “M”: Mechanical cooling system operates.
Fig. 2
Operation modes of multi-stage outdoor air enabled (MOA) cooling system4)2.2 냉수 출수온도와 냉동기 효율
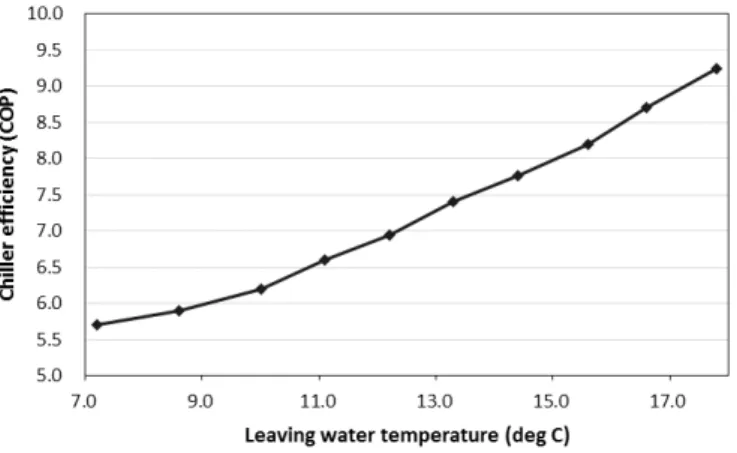
데이터센터의 효율적인 기 류제어를 위해 물리적인 차단장치를 설치하여 CRAC (Computer room air conditioner)에 서 취출되는 냉기류와 서버 컴퓨터에서 취출되는 더운 공기가 서로 섞이지 않도록 하는 방법들이 개발되고 있다. 대표적 인 경우로서, 콜드 아일(cold aisle) 또는 핫 아일(hot aisle)에 판넬을 이용한 벽면과 천장을 설치하여 기류혼합을 차단한 컨테인먼트(Containment) 시스템이 있고, 서버 랙(server rack) 자체를 밀폐형으로 한 밀폐형 랙(Rack enclosure) 8) 시스 템이 있다. 이와 같은 물리적 차단 시스템을 사용하면 핫 아일의 더운 공기와의 혼합을 고려하여 필요 이상의 낮은 온도 로 공급하 던 CRAC으로부터의 급기온도를 보다 높게 할 수 있게 되고, 이는 냉동기의 출수온도 상승을 가능하게 함으로 써, 결과적으로 냉동기의 효율 증대로 이어질 수 있다. Fig. 3에 냉동기 출수온도와 냉동기 효율과의 관계 9) 를 나타낸다.
Fig. 3
Chiller efficiency as a function of leaving chilled water temperature또한, 급기온도의 상 승은 이코노마이저 사이클의 외기이용 범위를 증가시켜 외기를 이용한 에너지 절약 효과를 높이 는데 기여할 수 있다.
3. 대상지역의 선정 및 시뮬레이션 개요
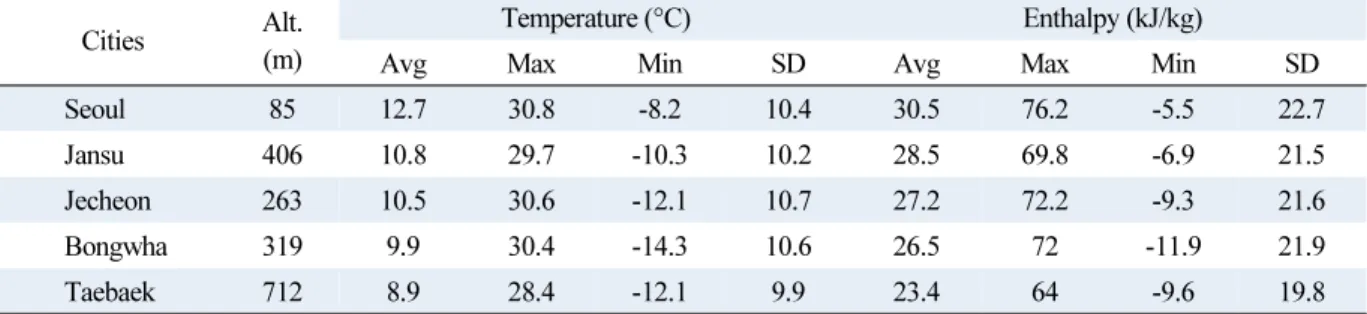
멀티 외기이용 냉방시스템은 기본적으로 외기를 이용한 시스템이기 때문에 데이터센터를 건 립하는 대상 지역의 외기 조건에 크게 영 향을 받을 수밖에 없다. 따라서 연평균 기온을 기준으로, 지역적 배치를 고려하여 서울을 포함한 5개 지역 을 선정하였다. 이들 5개 지역의 기상조건을 Table 2에 나타낸다.
데이터센터의 에너지 소비량은 TR NSYS 17을 이용한 에너지 시뮬레이션을 통해 검토하였다. 기상데이터는 선정한 5 개 지역에 대한 기상청의 최근 10 년간 기상 관측치의 평균을 구하여 이용하였다. 데이터센터의 구성 4) 을 Table 3에 나타 낸다. 또한, 서버 컴퓨터의 발열 스 케쥴 4) 및 냉방시스템의 사양 4) 을 각각 Table 4와 Table 5에 나타낸다.
Table 2
Climate conditions of 5 citiesCities Alt.
(m)
Temperature (°C) Enthalpy (kJ/kg)
Avg Max Min SD Avg Max Min SD
Seoul 85 12.7 30.8 -8.2 10.4 30.5 76.2 -5.5 22.7
Jansu 406 10.8 29.7 -10.3 10.2 28.5 69.8 -6.9 21.5
Jecheon 263 10.5 30.6 -12.1 10.7 27.2 72.2 -9.3 21.6
Bongwha 319 9.9 30.4 -14.3 10.6 26.5 72 -11.9 21.9
Taebaek 712 8.9 28.4 -12.1 9.9 23.4 64 -9.6 19.8
Table 3
Configurations of the target data centerItems Specifications
Floor area 2,250 m2×9story
No. of server computer racks 720 EA/floor × 9 story
Heat gains from
Server computers 2,880 kW/floor × 9 story
Lighting 49.5 kW/floor × 9 story
People SH : 60 W/p × 20 p/floor × 9 story
LH : 40 W/p × 20 p/floor × 9 story
Table 4
Heat generation schedule of server computersTime Weekday (%) Weekend (%)
00:00 – 09:00 90 80
09:00 – 21:00 100 90
21:00 – 24:00 90 80
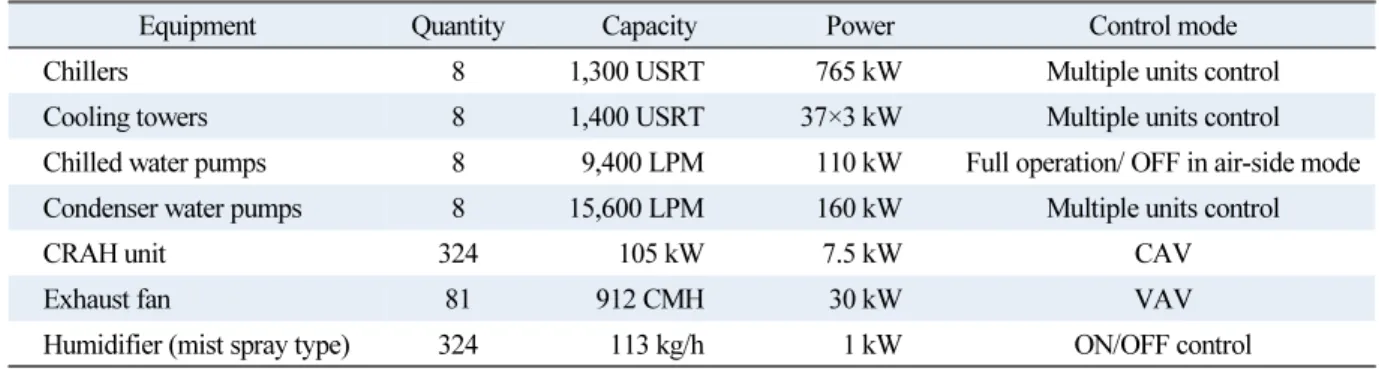
Table 5
Specifications of mechanical cooling systemEquipment Quantity Capacity Power Control mode
Chillers 8 1,300 USRT 765 kW Multiple units control
Cooling towers 8 1,400 USRT 37×3 kW Multiple units control
Chilled water pumps 8 9,400 LPM 110 kW Full operation/ OFF in air-side mode
Condenser water pumps 8 15,600 LPM 160 kW Multiple units control
CRAH unit 324 105 kW 7.5 kW CAV
Exhaust fan 81 912 CMH 30 kW VAV
Humidifier (mist spray type) 324 113 kg/h 1 kW ON/OFF control
4. 결과 분석
4.1 냉방에너지 소비량과 가습기 운전 시간(1)
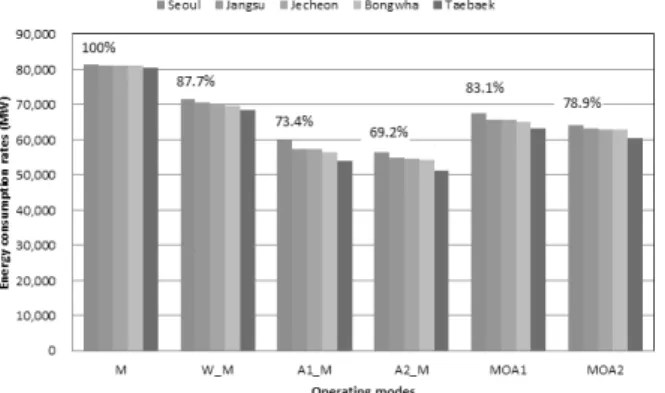
급기온도 1 3℃로 냉방할 때(Table 6, Table 7 참조)의 지역별 및 운전방식별 에너지 소비량에 대한 시뮬레이션 결과를 Fig. 4에 나타낸다. 냉방 시스템의 구성 요소별 에너지 소비량에 대한 자세한 분석은 참고문헌 4) 참조 바란다. 구체적 운전 방식에 대해서는 Table 8에 나타낸다. 서울에서의 기계식 냉방시스템(Operatig mode “M”) 운전에 의한 에너지 소비량 을 100%으로 하여, 각 운전방식 별로 서울을 기준으로 한 에너지 소비량을 백분율로 나타내었다. 출수온도 13℃의 경우, 외기냉수냉방 시스템의 경우(Operating mode “W_M”)는 87.7%의 에너지 소비량을 나타내었으며, A1 타입의 외기냉 방의 경우(Operating mode “A1_M”)는 73.4%를 나타내었다. A2 타입의 외기냉방 시스템(Operating mode “A2_M”) 은 69.2%로서 에너지 절감효과(31.2%)가 가장 크게 나타났다. MOA1 타입의 멀티 외기이용 냉방시스템은 83.1%, MOA2 타입의 경우는 78.9%를 나타내어, 외기냉수냉방보다는 작고 외기냉방보다는 큰 에너지 소비량을 나타내었다.
지역 별 냉방에너지 소비량의 차이는 그리 크지 않은 것으로 나타났다.
Table 6
Conditions of the cooling system (1)Items Temperature
Supply air temperature 13°C
Leaving water temperature of chiller 5°C
Cooling water temperature in mechanical cooling mode 32°C
Table 7
Operating conditions of the MOA cooling system (when LWT is 5°C and SAT is 13°C)Operating mode Outdoor air conditions
W WBT ≤ 3°C
WA 3°C < WBT ≤ 7°C
A1 Enthalpy ≤ 34.3 kJ/kg, and DBT ≤ 13°C, and DP ≤ 10.5°C
A2 34.3 kJ/kg < Enthalpy ≤ 43.8 kJ/kg, and DBT ≤ 21.5°C, and DP ≤ 10.5°C M 43.8 kJ/kg < Enthalpy, or 21.5°C < DBT, or 10.5°C < DP
Fig. 4
Energy consumption rates in each cities and in operating modes (Supply air temp. 13°C)Fig. 5
Humidifier operation time (Supply air temp. 13°C)Table 8
Operating conditions of each operating mode4)Operating mode Operating conditions
M Mechanical cooling operates alone throughout the whole outdoor air conditions zones.
W_M Water-side economizer operates when wet-bulb temperature of outside air is low enough in zone “W”, and mechanical cooling operates under the other outside air conditions.
A1_M Air-side economizer operates in zone “W”, “WA” and “A1”. In the other outside air conditions zones, mechanical cooling operates alone.
A2_M Air-side economizer operates in zone “W”, “WA” and “A1”, and air-side economizer operates with the aid of mechanical cooling in zone “A2”. In the other outside air condition zone, mechanical cooling operates alone.
MOA1
Water-side economizer operates in zone “W”, water-side economizer operates with the aid of air-side economizer in xone “WA”. and air-side economizer operates in zone “A1”. In the other outside air conditions zones, mechanical cooling operates alone.
MOA2
Water-side economizer operates in zone “W”, water-side economizer operates with the aid of air-side economizer in xone “WA”. air-side economizer operates in zone “A1”, air-side economizer operates with the aid of mechanical cooling in A2. In the other outside air conditions zones, mechanical cooling operates alone.
Fig. 5는 각 지역 별 및 운전방식별 가습기 운전시간을 일(days) 단위로 나타낸다. 기계식과 외기냉수냉방 시스템의 경 우는 가습기 운전시간이 “0”이며, 외기냉방 시스템의 경우는 A1 타입과 A2 타입 모두 170일을 상회하는 값을 나타낸다.
MOA1 타입의 경우는 40일 전후를 나타내며, 가습기를 가동하지 않는 경우라도 ASHRAE의 실내 환경기준의 허용범위
를 벗어나지는 않았다. MOA2 타입의 경우는 55일 전후를 나타내었으며, 가습기를 가동하지 않은 경우라도 ASHRAE 기준의 허용범위를 벗어나지는 않았다. 지역별로는 태백의 경우가 가장 크게 나타났으나, 지역별 차이는 그리 크지 않았 으며, A1, A2 타입의 경우에 최대 26일, MOA1, MOA2 타입의 경우에는 최대 9일의 차이를 나타냈다.
4.2 냉방에너지 소비량과 가습기 운전 시간 (2)
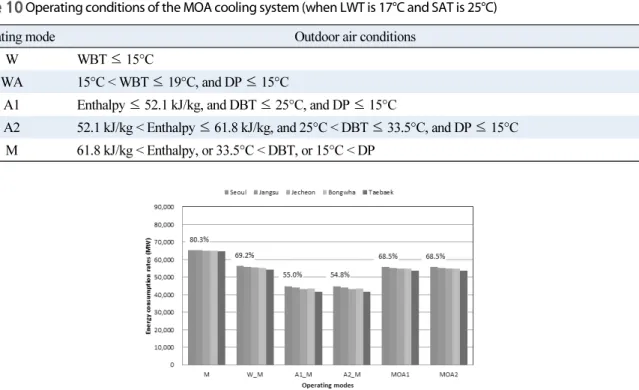
급기온도 25℃로 냉방할 때(Table 9, Table 10 참조)의 지역별 및 운전방식별 에너지 소비량에 대한 시뮬레이션 결과를 Fig.
6에 나타낸다. 그래프 상부에 백분율로 나타낸 숫자는 출수온도 13℃의 기계식 냉방시스템(서울 기준)의 에너지 소비량을 100%으로 하여, 각 운전방식 별(서울 기준) 에너지 소비량을 백분율로 나타낸 것이다. 출수온도 25℃의 경우, 출수온도 상승에 따른 냉 동기의 효율 향상에 의해 기계식 냉방시스템(Operating mode “M”)의 경우도 약 20%의 에너지 절감효과가 발생하여 에너지 소비량은 80.3%를 나타낸다. 외기냉수냉방 시스템의 경우(Operating mode “W_M”)는 69.2%, A1 타입의 외기냉방 의 경우(Operating mode “A1_M”)는 55.4%를 나타낸다. A2 타입의 외기냉방(Operating mode “A2_M”)은 54.8%로서, 가 장 작은 에너지 소비량을 나타낸다. MOA1 타입과 MOA2 타입의 경우는 모두 68.5%의 에너지 소비량을 나타내었다.
Table 9
Conditions of the cooling system (2)Items Temperature
Supply air temperature 25°C
Leaving water temperature of chiller 17°C
Cooling water temperature in mechanical cooling mode 32°C
Table 10
Operating conditions of the MOA cooling system (when LWT is 17°C and SAT is 25°C)Operating mode Outdoor air conditions
W WBT ≤ 15°C
WA 15°C < WBT ≤ 19°C, and DP ≤ 15°C
A1 Enthalpy ≤ 52.1 kJ/kg, and DBT ≤ 25°C, and DP ≤ 15°C
A2 52.1 kJ/kg < Enthalpy ≤ 61.8 kJ/kg, and 25°C < DBT ≤ 33.5°C, and DP ≤ 15°C M 61.8 kJ/kg < Enthalpy, or 33.5°C < DBT, or 15°C < DP
Fig. 6
Energy consumption rates in each cities and in operating modes (Supply air temp. 25°C)Fig. 7
Humidifier operation time (Supply air temp. 25°C)지역 별 냉방에너지 소비량의 차이는 크지 않은 것으로 나타났다.
Fig. 7는 각 지역별 및 운전방식별 가습기 운전시간을 나타낸다. 기계식과 외기냉수냉방 시스템의 경우는 가습기 운전 시간이 “0”이며, 외기냉방 시스템의 경우는 A1 타입과 A2 타입 모두 170일을 상회하는 값을 나타내었다. MOA1 타입과 MOA2 타입 모두 급기온도를 25℃로 하는 경우는 가습기 운전시간이 “0”으로써, 가습기를 전혀 필요로 하지 않는 것으 로 나타 났다. A1, A2 타입의 외기냉방에서 지역별로는 태백의 경우가 197일로써 가장 크게 나타났으며, 지역별 차이는 최대 25일을 나타 냈다.
4.3 지역별 냉방에너지 소비량의 차
앞의 검토에서, 5개 지역에서의 지역별 냉방에너지 소비량은 큰 차이를 나타내지 않았다. 서울과 태백에서의 차이가 가장 큰 것으로 나타났으며, 이 차이 값(서울에서의 냉방에너지 소비량 - 태백에서의 냉방에너지 소비량)을 Table 11에 나타낸다. 서울과 태백에서의 냉방에너지 소비량의 차이는 모든 운전방식과 급기온도 13℃ 및 25℃, 모두의 경우에서 5%
미만의 차이를 나타냈으며, 이는 주로 서울과 태백의 연평균 온도차(3.8℃)가 크지 않은데 기인한 것으로 판단된다.
이상의 결과로부터, 국내의 지역적 기후특성을 이용한 데이터센터 외기이용 냉방시스템의 에너지 절약 효과는 그리 크지 않은 것으로 나타났으며, 따라서, 국내에서 데이터 센터의 부지 선정 시에는 기후조건에 대해 크게 고려할 필요가 없을 것으로 사료 된다.
Table 11
The difference of energy conservation effects between in Taebaek and in SeoulSupply air temp. Mode “M” Mode “W_M” Mode “A1_M” Mode “A2_M” Mode “MOA1” Mode “MOA2”
13°C 0.7 % 2.6 % 3.8 % 3.6 % 2.4 % 2.4 %
25°C 0.9 % 3.2 % 4.7 % 4.4 % 2.9 % 2.9 %