• 검색 결과가 없습니다.

Variance estimation for distribution rate in stratified cluster sampling with missing values

N/A
N/A
Protected

Academic year: 2021

Share "Variance estimation for distribution rate in stratified cluster sampling with missing values"

Copied!
7
0
0

로드 중.... (전체 텍스트 보기)

전체 글

(1)

Variance estimation for distribution rate in stratified cluster sampling with missing values

Sunyeong Heo 1

2 Department of Statistics, Changwon National University

Received 28 February 2017, revised 24 March 2017, accepted 27 March 2017

Abstract

Estimation of population proportion like the distribution rate of LED TV and the prevalence of a disease are often estimated based on survey sample data. Population proportion is generally considered as a special form of population mean. In complex sampling like stratified multistage sampling with unequal probability sampling, the de- nominator of mean may be random variable and it is estimated like ratio estimator.

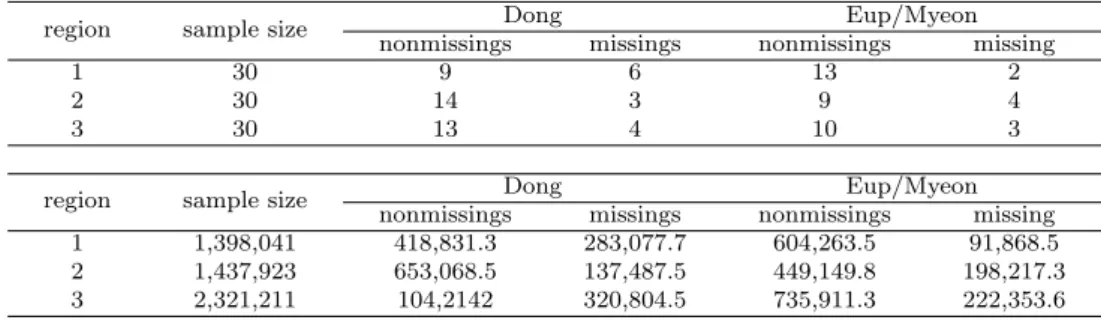
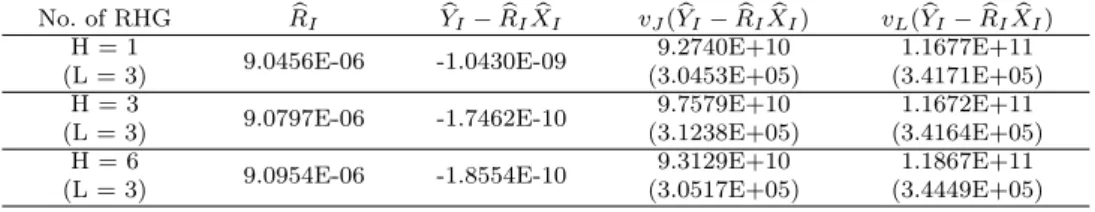
In this research, we examined the estimation of distribution rate based on stratified multistage sampling, and determined some numerical outcomes using stratified ran- dom sample data with about 25% of missing observations. In the data used for this research, the survey weight was determined by deterministic way. So, the weights are not random variable, and the population distribution rate and its variance estimator can be estimated like population mean estimation. When the weights are not random variable, if one estimates the variance of proportion estimator using ratio method, then the variances may be inflated. Therefore, in estimating variance for population propor- tion, we need to examine the structure of data and survey design before making any decision for estimation methods.

Keywords: Jackknife variance, linearization, missing values, ratio, stratification.

1. Introduction

Governments, industries, research organizations and etcetera, often have interest in the distribution rates of products, like cell phone, LED television set, and so on, and the preva- lence of a disease. Distribution rate and prevalence are generally considered as proportion, a special case of average, and they are estimated using methods of mean estimation. How- ever, in complex sampling like stratified multistage sampling with unequal probability the denominator of mean may also be random variable and hence mean will be better considered as ratio of two random variables rather than as constant denominator.

Almost every survey data has missing observations. Missingness in survey is generally occurred in two types. One is unit nonresponse and the other is item nonresponse. The former is usually due to failure of getting entire information from sampled units. A general way of handling unit nonresponse is weighting adjustment. The latter happens when a

† This research is financially supported by Changwon National University in 2017∼2018.

1

Professor, Department of Statistics, Changwon National University, Changwon 51140, Korea.

E-mail: [email protected]

(2)

researcher fails to get some information in some survey items. Unit nonresponse is handled by imputation, which is replacing missing values with some avaliable values from current survey. There are many researches about handling nonresponses. We can see some recent researches in domestic, e.g., Woo and Kim (2016), Kang et al. (2015), Park and Na (2014), etc.

There are many researches for handling unit nonresponse. Kalton and Kasprzyk (1986) summarized several imputation methods. Some popular methods are hot-deck imputation, mean imputation, regression imputation and ratio imputation. The methods, except hot- deck imputation, impute a missing value with unique value from a set of donors. We can see more references about unit missing imputation in Little (1986), Qin et al. (2000), Rao (1988), Choi et al. (2016) and so on.

Variance estimation is the main concern in the analysis of imputed data. Rubbin (1978) proposed multiple imputation to take into account the variability due to unknown missing values. He also gave in-depth discussions about multiple imputation (Rubbin, 1994). Burns (1990) suggested an alternative jackknife variance estimator, called pseudo-replicate jack- knife variance estimation, to improve the underestimation of the naive jackknife variance estimator.

A good property of jackknife variance estimator is readiness of extension to nonlinear func- tion of parameter. Rao and Shao (1992) proposed an adjusted jackknife variance estimator.

Under regular conditions, they showed its asymptotic unbiasedness, and Shao (1996) showed its asymptotic consistency. Rao (1996) suggested a linearized version of the adjusted jack- knife variance estimator for easy calculation. He gave the linearized versions under stratified random sampling, uniform response mechanism within each stratum and with some model assumptions, in some imputation schemes.

Heo (2011) extended Rao-Shoa’s linearization of jackknife variance estimator to ratio estimator under mean imputation and gave simple numerical results. This research is an extension of the previous work for variance estimation of distribution rate. Three numerical results are given based on stratified random sampling data. One is obtained under consider- ation of the distribution rate as a special case of mean, and calculated Rao-Shoa’s adjusted jackknife variance estimator of mean. Second numerical result is from the adjusted jackknife variance estimator considering the distribution rate as the ratio of two variable, target vari- able and weights attached to each sampled unit. Third is from the linearization of jackknife variance estimator of ratio estimator of distribution rate.

Section 2 gives a point estimator and jackknife variance estimator with review of previous works mainly based on Rao-Shao’s work and Rao (1996). Section 3 gives numerical results based on stratified random sampling data and mean imputation of missing values. Section 4 gives final remarks.

2. Estimation of Distribution Rate

In many surveys, samples are selected by complex sample design. For a complex sample

the estimator of population proportion (or distribution rate, prevalence) generally has a

form of ratio estimator. In this section, we will assume that a sample is selected by stratified

multistage sampling. In developing theories, I will follow the notations of Rao and Shao

(1992) and Rao (1996).

(3)

2.1. Point estimation with missing observations

Rao (1996) gave point estimator of total under some sampling design. This section reviews his work and apply it to the estimation of distribution rate.

Assume a data with L strata (h = 1, · · · , L). From each stratum, n h (≥ 2) clusters are selected by simple random sampling (SRS) (i = 1, · · · , n h ), and n hi ultimate units are selected by SRS from the hith sampled cluster (k = 1, · · · , n hi ). Also, assume that there are H mutually exclusive imputation classes with population size N ν for the νth class (ν = 1, 2, · · · , H ; N = P

ν N ν ). Every unit within same imputation class has a same response rate, which is called response homogeneity group (RHG), and responds independently across sample elements.

The estimator of distribution rate ¯ Y without missing values is given by b Y = b ¯ Y / b N where

Y = b

H

X

ν=1

Y b ν =

H

X

ν=1

X

hik∈s

ν

w hik y hik (2.1)

N = b

H

X

ν=1

N b ν =

H

X

ν=1

X

hik∈s

ν

w hik (2.2)

and s ν denotes the set of all sampled units in the νth class with n ν sampled clusters (n = P H

ν=1 n ν and n = P L

h=1 n h ), w hik is the survey weight attached to the hikth sampled unit and y hik is the hikth observation in the sample.

If there are missing observations in the sample, the imputed estimator of the population total, Y , is given by

Y b I = X

ν

Y b (2.3)

with

Y b = X

hik∈s

w hik y hik + X

hik∈s

w hik y hik (2.4)

where s rν and s mν are the sets of respondents and non-respondents in the νth class, and y hik is imputed values for hik ∈ s mν . The imputed estimator of population proportion is given by b Y ¯ I = b Y I / b N .

For two variates (x, y), the imputed estimator of the population ratio R is given by b R I = Y b I / b X I where b Y I = P

ν Y b Iν and b X I = P

ν X b Iν . The b X Iν is obtained from equation (2.3) with x hik and x hik in the place of y hik and y hik . So, b Y ¯ I is a special case of b R.

In class mean imputation, the hikth missing value in the νth class is imputed with y hik ∗ = Z b ν / b T ν , and hence b Y in (2.4) reduces to

Y b Iν = Z b ν

T b ν

U b ν (2.5)

where

Z b ν = X

hik∈s

w hik y hik , b T ν = X

hik∈s

w hik and b U ν = X

hik∈s

ν

w hik .

(4)

2.2. Variance estimation

Jackknife variance estimator has a good property of easy extension to nonlinear function of parameters. Rao and Shao (1992) proposed an adjusted jackknife variance estimator. Under regular conditions, they showed its asymptotic unbiasedness, and Shao (1996) showed its asymptotic consistency to V ar( b Y I ).

Rao (1996) suggested a linearized version of the adjusted jackknife variance estimator and it makes easy to calculate. He gave theoretical results under stratified random sampling, uniform response mechanism within each stratum and with some model assumptions, in some imputation schemes.

The Rao-Shao’s adjusted jackknife variance estimator of b Y I is given by

v J ( b Y I ) =

L

X

g=1

n g − 1 n g

n

g

X

j=1

h

Y b I a (gj) − b Y I

i 2

(2.6)

where b Y I a (gj) is an imputed total estimator deleting jth cluster in gth stratum. The b Y I a (gj) = P

ν Y b a (gj) and for gj ∈ s ν

Y b a (gj) = X

hik∈s

w hik (gj)y hik + X

hik∈s

w hik (gj)z hik

where z hik is the adjusted imputed values after deleting gj ∈ s ν , and w hik (gj) = 0 if hi = gi ; = {n g /(n g − 1)} w gik if h = g and i 6= j ; = w hik if h 6= g. When gj ∈ s is deleted, z hik = y hik (Rao and Shao, 1992; Rao, 1996).

In class mean imputation,

Y b I a (gj) = n

Z b ν (gj)/ b T ν (gj) o

U b ν (gj) (2.7)

and the linearized version of adjusted jackknife variance estimator in (2.5) reduces to

v L ( b Y I ) =

L

X

g=1

1 n g (n g−1 )

n

g

X

j=1

( z b gj − b z ¯ g. ) 2 (2.8)

where b z ¯ g. = P

j b z gj /n g and

z b gj = X

ν

"

U b ν

T b ν

! (

z νgj − Z b ν

T b ν

! t νgj

) + Z b ν

T b ν

! u νgj

#

with z νgj =

n

gj

X

{k:gjk∈s

}

(n g w gjk )y gjk , t νgj =

n

gj

X

{k:gjk∈s

}

n g w gjk , u νgj =

n

gj

X

{k:gjk∈s

ν

}

n g w gjk .

Rao (1996) showed that v L ( b Y I ) is asymptotic consistent to v J ( b Y I ) under regular conditions.

The variance of the ratio estimator b R of the population ratio R = Y /X becomes V ar( b R) .

= X −2 V ar( b Y − R b X)

(5)

when b X is consistent estimator of population total X of variate x (Cochran, 1977). In mean class imputation, b X I is asymptotical consistent estimator of X and the adjusted jackknife variance estimator of b R I is given by

V ar d J ( b R I ) = X −2 v J ( b Y I − b R I X b I ) (2.9) where v J ( b Y I − b R I X b I ) is obtained from (2.6) with b Y I a (gj) and b Y I changed to b Y I a (gj) − R b I X b I a (gj) and b Y I − b R I X b I where b X I a (gj) = P

ν X b Iν (gj).

The linearized version of adjusted jackknife variance estimator of b R I is given by

V ar d L ( b R I ) = X −2 v L ( b Y I − b R I X b I ) (2.10) where v L ( b Y I − b R I X b I ) is obtained from (2.8) by replacing y hik with y hik − b R I x hik .

3. Application

The 2016 standby power survey was conducted by Korea Electrotechnology Research Institute (KERI) sponsored by Korea Energy Agency (KEA). Population of the survey is entire household residents in Korea during the period of survey. The population was stratified with 11 region and 30 households sampled from each stratum (region), and measured standby power for all electricity used in a sampled household. For this research, I selected 3 regions and one variable “TV (LED)” from this survey data to estimate population distribution rate of TV (LED). For some practical restraints, the sample was selected by convenient sampling, but here we will assume the sample was selected by stratified random sampling.

For the selected variable “TV (LED)”, I changed some observed values to missing values for about 25% of households.

I generated random numbers to make missing values for nonmissing values, and about 25% of 90 households has missing for this variable. Table 3.1 shows the distribution of miss- ing values and total weights, by region and administrative district (Dong or Eup/Myeon).

The survey weights was determined by deterministic way using 2015 Korea Population and Housing Census data based on proportional allocation by region and administrative district (Dong or Eup/Myeon). So, this case the weights are not random variable.

Table 3.1 Distribution of missing values by region and administrative district (Dong-Eup/Myeon) (Upper), and total survey weights (Below)

region sample size Dong Eup/Myeon

nonmissings missings nonmissings missing

1 30 9 6 13 2

2 30 14 3 9 4

3 30 13 4 10 3

region sample size Dong Eup/Myeon

nonmissings missings nonmissings missing

1 1,398,041 418,831.3 283,077.7 604,263.5 91,868.5

2 1,437,923 653,068.5 137,487.5 449,149.8 198,217.3

3 2,321,211 104,2142 320,804.5 735,911.3 222,353.6

Table 3.2 shows point estimate b Y of distribution rate and its variance estimates by various ¯

number of RHG. The H = 1 means one RHG, In H = 3, each region is considered RHG

(6)

respectively, so strata equal to RHG. In H = 6, each region and administrative district combination is considered RHG respectively, so it has 6 RHGs. Jackknife(Mean) was calcu- lated from (2.6) divided by b N 2 , the square of total weights in (2.2). Jackknife (Ratio) and Linearization (Raio) are calculated using in (2.8) and (2.9), respectively.

This survey data was stratified by region, so when there is only one RHG ignoring strati- fication, the Jackknife (Mean) gives large variance. In general, the linearization gives larger variance than the origianl jackknife variance estimator about 20%∼37%. Except H = 1, the Jackknife (Mean) gives smaller variance than Jackknife (Ratio) and Linearization (Ratio)

Table 3.3 gives point estimates of ratio b R I and residual total b Y I − b R I X b I , and residual variances (standard errors) estimates by number of RHG (number of strata). As Table 3.2, the linearized variances are larger 20%∼37% than the Jackknife variance estimator. Because the consistency of linearization is based on large sample size, but sample size 30 per stratum is hard to be considered as large.

Table 3.2 Point estimates of distribution rate and variance (standard errors) estimates by number of RHG (number of strata)

No. of RHG Y b ¯ Jackknife (Mean) Jackknife (Ratio) Linearization(Ratio) H = 1

0.552607 0.0049930 0.0034869 0.0043904

(L = 3) (0.0706608) (0.0590503) (0.0662699)

H = 3

0.553119 0.0034240 0.0036689 0.0043886

(L = 3) (0.0585145) (0.0605714) (0.0662465)

H = 6

0.554448 0.0034811 0.0035016 0.0044619

(L = 3) (0.0590008) (0.0591740) (0.0667977)

Table 3.3 Point estimates of ratio, totals of residuals, and residual variances (standard errors) estimates by number of RHG (number of strata)

No. of RHG R b

I

Y b

I

− b R

I

X b

I

v

J

( b Y

I

− b R

I

X b

I

) v

L

( b Y

I

− b R

I

X b

I

) H = 1

9.0456E-06 -1.0430E-09 9.2740E+10 1.1677E+11

(L = 3) (3.0453E+05) (3.4171E+05)

H = 3

9.0797E-06 -1.7462E-10 9.7579E+10 1.1672E+11

(L = 3) (3.1238E+05) (3.4164E+05)

H = 6

9.0954E-06 -1.8554E-10 9.3129E+10 1.1867E+11

(L = 3) (3.0517E+05) (3.4449E+05)

4. Final Remarks

Estimation of population proportion like the distribution rate of LED TV and the preva- lence of a disease are often estimated based on survey sample data. As the survey design is getting complicate, the estimation procedures are generally required to be complicate too.

This research examines the estimation of distribution rate with the ratio estimation based on

stratified multistage sampling, and gave some numerical results based on stratified random

sample data with about 25% of missing data. In the data used for this research, the survey

weight is determined by deterministic way. So, the weights are not random variable, and the

population distribution rate and its variance estimator can be estimated using population

mean estimation procedure. Even with that, if one estimates the variance of population pro-

portion estimator using ratio method, then the variances is inflated. Therefore, when one

(7)

estimates variance for population proportion, it is necessary to be examine the structure of data and the survey design before making a decision of an estimation method.

References

Burns, R. M. (1990). Multiple and replicate item imputation in a complex sample survey. Proceedings of sixth annual research conference, U.S. Bureau of the Census, Washington, 655-665.

Choi, B., You, H. S. and Yoon, Y. H. (2016). An estimation method for non-response model using Monte- Carlo expectation-maximization algorithm. Journal of the Korean Data & Information Science Society, 27, 587-598.

Cochran, W. G. (1977). Sampling techniques, 3rd Ed., Jonh Wiley & Sons, New York.

Heo, S. (2011). Varince estimation of the population ratio with missing values under complex sampling.

Proceedings of the Autumn Conference of the Korean Data & Information Science Society, 55-57.

Kalton, G. and Kasprzyk, D (1986). The treatment of missing sruvey data. Survey Methodology, 12, 1-16.

Kang, S. and Larsen, M. D. (2015). Large tests of independence in incomplete two-way contingency tables using fractional imputation. Journal of Korean Data & Information Science Society, 26, 971-984.

Little, R. J. A. (1986). Survey nonresponse adjustments for estimates of means. International Statistical Reviews, 54, 139-157.

Park, H. and Na, S. (2014). Estimation using response probability when missing data happen on the second occasion. Journal of Korean Data & Information Science Society, 25, 263-269.

Qin, Y, Rao, J. N. K. and Ren, Q. (2000). Confidence intervals for marginal parameters under imputation for item nonresponse. Journal of Statistical Planning and Inference, 138, 2283-2302.

Rao (1996). On variance estimation with imputed survey data. JASA, 91, 499-506.

Rao, J. N. K. and Shao, J. (1992). Jackknife variance estimation with survey data under hot deck imputation.

Biometrika, 79, 811-822.

Rao, J. N. K. (1988). Variance estimation in sampling surveys. Handbook of Statistics, Vol 6, Elsevier Science Publishers B. V., 427-447.

Rao, J. N. K. and Wu, C. F. J. (1988). Resampling inference with complex survey data. JASA, 83, 231-241.

Rubbin, D. B. (1976). Inference and missing data. Biometrika, 63, 581-592.

Rubbin, D. B. (1978), Multiple imputations in sample surveys - a phenomenological byesian approach to nonresponse. The Proceedings of the Survey Research Methods Section of the American Statistical Association, 20-30.

Rubbin, D. B. (1994), Multiple imputation after 18 years. JASA, 91, 473-489.

Shao, J. (1996). Resampling methods in sample surveys (with discussion). Statistics, 27, 203-254.

Woo, N. and Kim, D. H. (2016). A Bayesian model for two-way contingency tables with nonignorable

nonresponse from small areas. Journal of Korean Data & Information Science Society, 27, 245-254.

수치

Table 3.1 Distribution of missing values by region and administrative district (Dong-Eup/Myeon) (Upper), and total survey weights (Below)
Table 3.2 Point estimates of distribution rate and variance (standard errors) estimates by number of RHG (number of strata)

참조

관련 문서

The Joint Resarch Centre's European Chemicals Bureau has developed a hazard estimation software called Toxtree, capable of making structure-based predictions for a

•Targeted therapies are a cornerstone of precision cancer medicine , a form of medicine that uses. information about a person’s tumor genes and proteins to prevent,

 Settlement estimation based on realistic deformation characteristics measured from stress path tests which duplicate field stress paths and probable deformation modes of

Third, based on the above results, this study concluded that the competitiveness of the agricultural product distribution industry in uncertain business

Based on the results of this study, some implications for classes using online reading programs for elementary school students' English reading were

- Imprecise statistical estimation (probability distribution type, parameters, …).. - Only depending on the sample size and location - Ex) lack of

따라서, 종속변수에 가장 영향력이 있는 변수를 선정, 선정된 변수를 기준으로 층화추출법(Stratified sampling)을 진행한다. 작업시간추정

A Method for Line Parameter Estimation of Unbalanced Distribution System based on Forward/Backward Sweep Using..