Received: July 3, 2017 Revised: January 5, 2018 Accepted: January 8, 2018
OPEN ACCESS
HORTICULTURAL SCIENCE and TECHNOLOGY 36(3):350-361, 2018
URL: http://www.kjhst.org pISSN : 1226-8763 eISSN : 2465-8588
This is an Open Access article distributed under the terms of the Creative Commons Attribution Non-Commercial License which permits unrestricted non-commercial use, distribution, and reproduction in any medium, provided the original work is properly cited.
Copyrightⓒ2018 Korean Society for Horticultural Science.
Estimation of Lettuce Growth Characteristics Under Different LED Light Intensities in a Closed-type Plant Factory
Byeong Hyo Cho 1† , Tae Hwan Kang 2† , Chung Su Han 1 , Jung Hyun Lee 3 , Dong Il Lee 1 , and Hyun Kwon Noh 1*
1
Department of Biosystems Engineering,Chungbuk National University, Cheongju 28644, Korea
2
Major in Bio-Industry Mechanical Engineering,Kongju National University,Yesan 32439, Korea
3
Laboratory of Agricultural and Food Process Engineering, Hokkaido University, Sapporo 060-0808, Japan
*Corresponding author: [email protected]
†
These authors contributed equally to this work.
Abstract
The objective of this research was to develop a model to measure the external quality traits using Multi-Spectral Image Sensor (MSIS) in lettuce. In addition, this study was conducted to examine the effect of different intensities of LED mixed light on the growth of lettuce in a closed-type plant factory. The prediction models of lettuce growth data (shoot fresh weight, shoot dry weight, and leaf area) were developed using the correlation between growth data and the number of pixels on an acquired image. Also, SPAD value prediction models were developed using the correlation between the reflectance of a lettuce leaf in an acquired multi-spectral image and the measured SPAD value of the lettuce leaf. The characteristics of lettuce growth according to the light intensity in a closed-type plant factory was conducted under light intensities of 100, 150, and 200 µmol·
m
-2·s
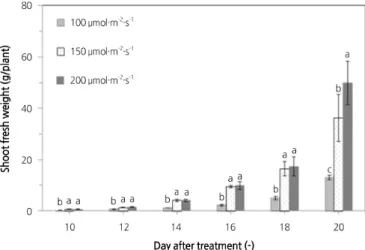
-1. At 200 µmol·m
-2·s
-1light intensity, the shoot fresh weight increased about 27.37-73.93%
when compared to 100 and 150 µmol·m
-2·s
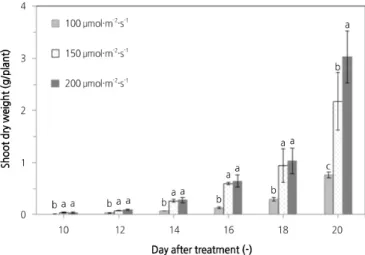
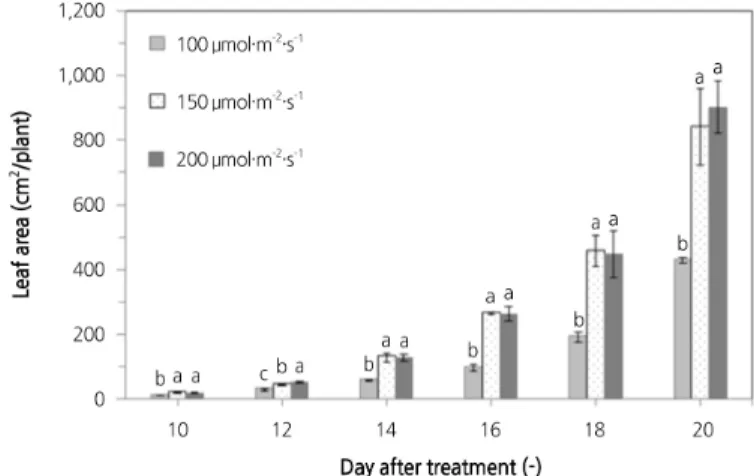
-1on 20 days after sowing. The shoot dry weight showed a similar tendency. Lettuce leaf area increased by 6.89-52.52% on 20 days after sowing when compared to plants grown under 100 and 150 µmol·m
-2·s
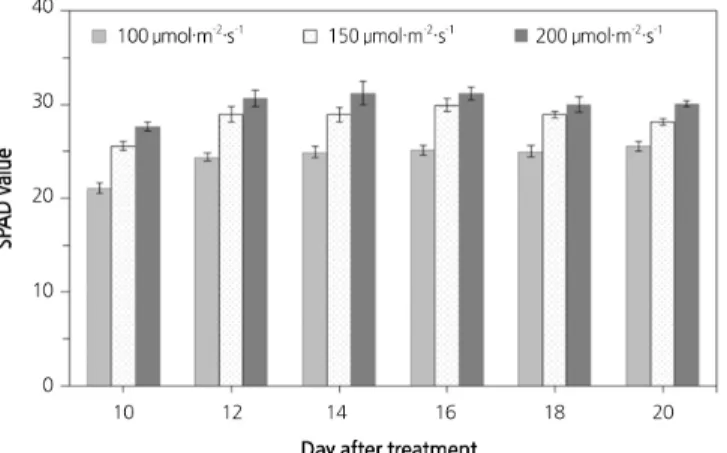
-1. At a light intensity of 200 µmol·m
-2·s
-1, the SPAD value increased about 3.56-23.76% when compared to plants grown under 100 and 150 µmol·m
-2·s
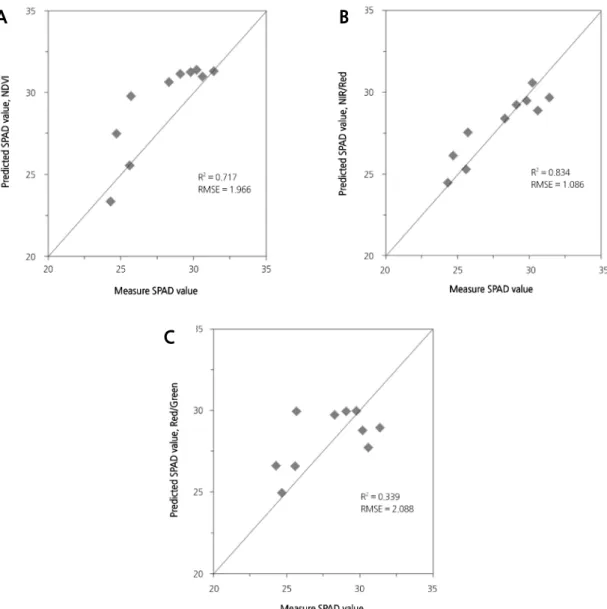
-1. Using prediction models based on the number of pixels on a lettuce leaf image, lettuce growth data (shoot fresh weight, shoot dry weight, and leaf area) can be predicted with high precision. In addition, the prediction models for SPAD value were developed using the vegetation indices NDVI (Normalized Difference Vegetation Index), GNDVI (Green NDVI), NIR/Red ratio, NIR/Green ratio, and Red/Green ratio. The SPAD values were predicted with relatively high precision (R
2= 0.834) using the prediction model based on NIR/Red.
Additional key words: image processing, multi-spectral image sensor, NIR, SPAD, vegetation index
Introduction
Lettuce is a typical leafy vegetable commonly used for wrapping, and known to have a great health
effect due to its vitamins, minerals, and fiber. The domestic lettuce production in the Republic of Korea
is 101,745 ton in 2015 (KREI, 2017).
Recently, lettuce has been consumed as a main ingredient in salads and as a leafy vegetable. Lettuce is also known as a crop suitable for production in a closed-type plant factory, and is widely used as an experimental crop (Lee et al., 2010; Kim, 2013).
Recently, there has been an increase in research on closed-type plant factories capable of stably producing high-quality agricultural products safe from abnormal weather and natural disasters (Kim et al., 2013a). Specifically, studies on light source, light quality, and LED photoperiod time using lettuce in a closed-type plant factory have been actively conducted (Park et al., 2012; Cha et al., 2013; Kim et al., 2014). Also, studies on light intensity using lettuce and Taraxacum platycarpum in a closed-type plant factory have been conducted (Cha et al., 2012; Hwang et al., 2016). However, studies on the light intensity of LED light sources using lettuce in a closed-type plant factory are still insufficient.
Meanwhile, consumers are increasing their demand for high-quality agricultural products with increasing income level and interest in health. The external quality of agricultural products can be classified as that which can be confirmed by visual and tactile properties such as size, color, weight, and shape (Kim, 2009; Park et al., 2012). Consumers oftein focus on external factors such as size, shape, and color when purchasing agricultural products. However, these external factors can be subjective because they are chosen by consumers’ intuition and evaluated by the naked eye. It is more desirable to purchase accurate and objective quality information, rather than selecting agricultural products depending on subjective judgment (Kim, 2009). For this reason, studies on nondestructive measurement for the selection and supply of high-quality agricultural products have been actively conducted by measuring the external quality of agricultural products. In particular, there has been considerable research in measuring the external quality of agricultural products using near-infrared and ultra-spectral measurements (Noh and Lu, 2009; Cho et al., 2011). Also, studies have been performed on the germination of seeds nondestructively in leafy plants using hyper-spectral data (Ahn et al., 2012a; Ahn et al., 2012b). In addition, lettuce growth analyses using a CCD camera in plant factories have been actively conducted (Kim et al., 2013b). However, further studies on nondestructive measurements of the external quality of lettuce are still needed. Therefore, the objective of this research was to measure the external quality of lettuce using a Multi-Spectral Image Sensor (MSIS). In addition, this study was conducted to examine the effect of light intensity from LED mixed light on the growth of lettuce in a closed-type plant factory.
Materials and Methods Experimental Material
Lettuce ( Lactuca sativa L. ‘Cheongchima’, Asia seed Co., Ltd., Korea) was used in this study. Each seed was sown on a rockwool sowing plate. The plate was placed on a closed-type plant factory with a fluorescent lamp [200 ± 30 µmol·m
-2·s
-1, 16/8 h (light/dark) photoperiod] and the temperature was maintained at 20 ± 2°C. The water supply was 2 L every two days.
The sowing were transplanted in plastic beds after sowing for 14 d in a closed-type plant factory. Thirty five sowing of lettuce per bed were grown for 20 d in the plant factory.
Growth Conditions
The closed-type plant factory for lettuce growth is located at Chungbuk National University. The factory was maintained
at a temperature of 20 ± 2°C, relative humidity of 55 ± 5%, and carbon dioxide concentration of 1,000 ± 200 µmol·mol
-1.
LED was used as the light source [Red:Blue=8:2, 16/8 h (light/dark) photoperiod], and the distance between LED and pot was 25 cm (Kang et al., 2016; Dlugosz-Grochowska et al., 2017). A nutrient film technique (NFT) culture system was applied for this cultivation.
The pH and EC of the nutrient solution were 6.0 ± 0.5 and 1.8 ± 0.2 dS·m
-1, respectively. The nutrient solution was circulated at a rate of 1.5 L·min
-1every 30 minutes during the experiment (Cha et al., 2013; Won, 2017).
Experimental Device
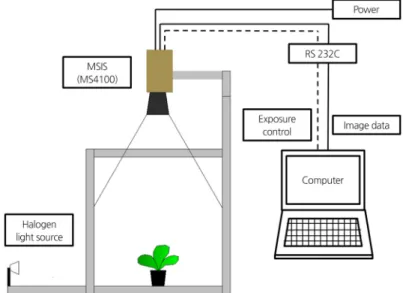
Fig. 1 shows a schematic diagram of the acquisition system used to obtain lettuce images. The Multi-Spectral Image Sensor (MS4100, Duncan Tech, USA) has 3 CCD sensing components centered at 550 nm (Green), 650 nm (Red), and 800 nm (Near-Infrared, NIR), with a bandwidth of 50 nm for each band. The spatial resolution of the Multi-Spectral Image Sensor (MSIS) is 1920 × 1080; the gain, offset, and exposure of each channel can be controlled individually through a serial RS 232 interface.
Fig. 1. Schematic diagram of the acquisition system used for lettuce (Cho, 2017).
Radiation reflected on an object through each CCD is quantified into a digital number or the gray level. The digital numbers in the MSIS output are affected by the incident light intensity and the reflectance on an object. The intensity of an image is represented as a single matrix; the matrix can be of class 256 steps (unit8, unsigned char 8 bit), in which case the digital number data range is (0, 255). The components in the intensity matrix represent various intensities, or gray levels, where the intensities are 0 (black), and 255 (white).
The MSIS was fixed at 650 mm from the bottom. A halogen light source (7 W, 12 V) was irradiated during image acquisition to maintain the reflectance.
Image Processing
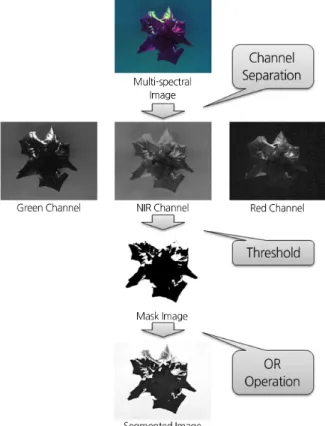
Fig. 2 shows a schematic diagram of the image pre-processing steps. The pre-processing of the multi-spectral images
involved the separation of the lettuce leaf from the background. In the dynamic separation, each multi-spectral image was
separated into channels of Green, Red, and NIR. Image spectrum analyses found that the lettuce reflectance in the NIR channel was much stronger than the background reflectance. Therefore, the image acquired from the NIR channel was used to separate the lettuce leaf from the background. After threshold process, the NIR channel image became in a masked image.
In this masked image, the lettuce became black (gray level = 0) and the background became white (gray level = 255). All unmasked portions of the original image were treated as background and were removed from the original image via an OR operation. The OR operation is a logical operation; the boolean value is 1 when two operations take different boolean values.
The OR operation was applied based on the gray level at point (x, y) in the masked image using the following equation (Noh, 2003).
Fig. 2. Schematic diagram of the image pre-processing steps (Cho, 2017).
g
x y
∪ ∪
(1)
Where g
i(x, y) is the segmented gray level at point (x, y) in the original image, g
m(x, y) is the masked gray level, f
i(x, y) is the original gray level, and i represents either the Green, Red, or NIR channel image.
This segmented image can be used to analyze the density of the pixel value in each channel of Green, Red, and NIR. The average gray value of a lettuce leaf in a multi-spectral image was calculated using the following equation (Noh, 2003):
G
∑
(2)
Where G
iis the average gray value in the Green, Red, or NIR channel, g
ciis the gray value of the pixel representing the lettuce leaf, and n
ciis the total number of pixels representing the lettuce leaf in each channel.
Fig. 3 shows a flow chart of image analysis steps. The reflectance of the lettuce leaf is calculated using the pixel value acquired in the pre-processing, and the vegetation index is calculated using the reflectance. The pixel value is used to predict lettuce growth data (shoot fresh weight, shoot dry weight, leaf area), and the vegetation index is used to predict the SPAD value of the lettuce leaf. The prediction model for lettuce growth was developed by regression analysis.
Fig. 3. Flow chart of the image analysis steps.
Experimental Methods
Shoot fresh and dry weight, leaf area, and SPAD values of lettuce plants grown under three different light intensities (100, 150, 200 µmol·m
-2·s
-1) irradiated with red and blue LEDs were measured. The light conditions were set up in such a way that the SPAD values differed (Park and Lee, 1999; Suh and Kim, 2011; Kwak, 2015; Hwang et al., 2016). In addition, growth characteristics of lettuce plants were measured every 2 d from day 10 to day 20 after sowing. After taking 5 images of each condition, shoot fresh and dry weight, leaf area, and SPAD values were measured.
The models for prediction of lettuce growth data were developed using measured 54 growth traits sorted in ascending order.
Then, 10 of the 54 traits were used for validation of the prediction models (traits number 5, 10, 15, 20, 25, 30, 35, 40, 45, and 50). The other 44 traits were used for calibration.
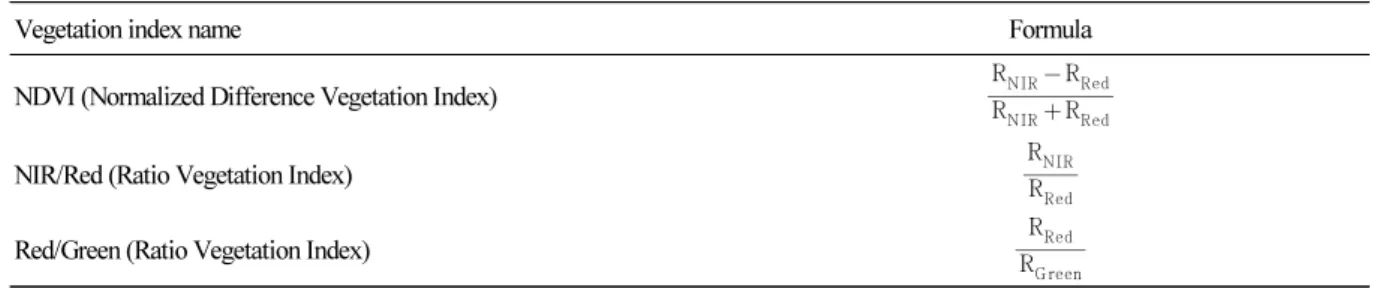
The vegetation index, which is the index of vegetation vitality and growth status, was used to predict the SPAD value. The vegetation indices were: NDVI (Normalized Difference Vegetation index) using R
NIRand R
Red, and GNDVI (Green NDVI) using R
NIRand R
Greenfrom acquired images. In addition, the R
NIRand R
Redratio, the R
NIRand R
Greenratio, and the R
Redand
Table 1. The selected vegetation indices
Vegetation index name Formula
NDVI (Normalized Difference Vegetation Index)
R
NIRR
RedR
NIR R
RedNIR/Red (Ratio Vegetation Index)
R
RedR
NIRRed/Green (Ratio Vegetation Index) R
Green