Received: November 7, 2016 Revised: November 7, 2016 Accepted:January 13, 2017
OPEN ACCESS
HORTICULTURAL SCIENCE and TECHNOLOGY 36(1):37-45, 2018
URL: http://www.kjhst.org pISSN : 1226-8763 eISSN : 2465-8588
This is an Open Access article distributed under the terms of the Creative Commons Attribution Non-Commercial License which permits unrestricted non-commercial use, distribution, and reproduction in any medium, provided the original work is properly cited.
Copyrightⓒ2018 Korean Society for Horticultural Science.
This research was supported by Wonkwang University in 2015.
Effect of Different Culture Nutrient Solution EC on Carrot Top Growth and Nutritional Contents in a Closed–type Plant Factory System
Young-Yeol Cho1, Mi-Kyung Cha1, Yang Gyu Ku2, Ho Cheol Kim2, and Jong Hyang Bae2*
1Major of Horticultural Science, Jeju National University, Jeju 63243, Korea
2Department of Horticulture Industry, Wonkwang University, Jeonbuk 54538, Korea
*Corresponding author: [email protected]
Abstract
The production of crops in controlled environments is a growing sector of modern agriculture. The objective of this study was to determine the optimal concentration of culture nutrient solution for the production of carrot leaves in a closed-type plant factory. After sowing, seedlings at the two-true-leaf stage were transplanted to a growing bed system. Hydroponic cultivation was performed using a three-layer NFT system. Culture nutrient solutions were supplied at three electrical conductivity (EC) levels (2.0, 3.0, and 4.0 dS·m-1). Measurements of plant growth characteristics, including fresh weight, dry weight, plant height, and leaf area, were performed 14 and 23 days after planting. Differences in culture nutrient solution concentrations did not affect leaf number and chlorophyll content, and did not cause significant difference in antioxidant capacities and total phenol content of carrot plants. However, contents of total phenol, chlorogenic acid, and kaempferol were highest in plants grown in the EC 2.0 dS·m-1 solution, whereas those grown in the EC 3.0 dS·m-1 solution had the highest fresh and dry weights. Collectively, our results indicate that an EC 3.0 dS·m-1 culture nutrient solution combined with a cultivation period of 20-25 days is optimal for the hydroponic cultivation of carrot leaves in a controlled environment. In addition, we found that carrot leaves contain antioxidant compounds and are thus suitable as a leaf vegetable.
Additional key words: antioxidant capacity, chlorogenic acid, cultivation days, kaempferol, total phenolic compounds
Introduction
Carrots are one of the most extensively cultivated vegetables in the world. The total production of carrots in Jeju Island, Korea, is approximately 50%, with crop cultivation mainly in the winter season (KOSIS, 2015). It is well known that carrot roots contain many functional components, including vitamins A, C, E, B1, B2, and B6, α-carotene, β-carotene (the precursor of vitamin A), and rutin (Shin and Bae, 2001; Lee et al., 2015). Carrot leaves also contain functional components such as fatty acids. It has been reported that unsaturated fatty acids are mainly contained in green vegetables (Almeida et al., 2009). Carrot leaves are consumed in the form of dry tea which does not make full use of their nutritional value.
Plant factories are systems whereby control is exerted over the environmental factors necessary for plant growth, such as light, temperature, humidity, carbon dioxide (CO2), and mineral nutrient composition. These controlled environments enable rapid, year-around mass production of crops (Cha et al., 2012). Recently, the number of crops grown in plant factories has been gradually increasing, with the majority of crops produced being leafy vegetables such as ice plant (Cha et al., 2014) and sowthistle (Qin et al., 2008; Cho et al., 2012). However, plant factories are not universally applicable because of the associated high running costs. In recent years, the adoption of fusion technologies that integrate automation technology into agriculture has increased (Lee and Cha, 2015). In addition, as climate change is threatening the stable production of agricultural crops, there is a growing interest in alternative means of cultivation (Heo et al., 2010; Lee and Cha, 2015; Lee et al., 2016).
As a consequence of global warming, changes in the water temperature of the equatorial oceans are now causing anomalous climate conditions worldwide (Neelin, 1990). Recent years have seen an increase in the frequency of El Niño events, and the World Meteorological Organization has indicated that 2016 was the hottest year in the history of meteorological observations.
In addition, the Korea Meteorological Administration has stated that the climate of Korea is changing as a consequence of the El Niño phenomenon (KMA, 2016), with winters tending to be warmer and wetter compared to that in previous years. Such changes have important implications for crop cultivation.
Under optimal growth conditions, plants grow rapidly throughout the year and do not display negative responses to unfavorable environmental conditions. Moreover, it is possible to exert environmental control in a purposeful manner so as to produce not only high yielding but also high quality crops (Morimoto et al., 1995). Plant factories are mainly based on hydroponics systems because these minimize external pollution. In general, the optimum culture concentration for the production of leafy vegetables during hydroponic cultivation is equivalent to an electrical conductivity (EC) of approximately 1.0-2.0 dS·m-1. When plants are grown in an optimal environment, their growth rate tends to be faster compared to that of plants grown under normal growth conditions. Therefore, it is desirable that the culture nutrient solution concentration is maintained at an optimum level for plant growth and development. Ikeda et al. (1992) reported that the growth rate of lettuce grown under optimal conditions was eight times faster than that under normal conditions. This rapid growth rate is a major cause of physiological disorders related to mineral nutrition (Ikeda et al., 1992; Um et al., 2010).
For the successful cultivation of crops in plant factories, experiments have been conducted on the appropriate plant density, the composition and concentration of culture nutrient solutions, the economic efficiency of crops, and the appropriate amount of light (Cha et al., 2012; Cha et al., 2014). In this study, we accordingly sought to determine the appropriate concentration of culture nutrient solution for the cultivation of carrot leaves growing in a fully controlled environment.
Materials and Methods
Experimental Plant Material and Mineral Nutrition Supply
The plant material used was carrot cultivar ‘Yangmyeon 5 chon’ (KOREGON Co., Korea). The experiment was conducted from April 18, 2016 to May 20, 2016. Seeds were sown in a urethane sponge (2.5 × 2.5 × 2.5 cm) and seedlings were transplanted to a growing bed once two leaves had emerged. The hydroponic culture system consisted of a three-layer thin-film hydroponic (NFT) system (240 × 60 × 200 cm: L × W × H) with a tank volume of 110 L and a culture volume of 90 L. The supply of mineral nutrition was started when the true leaves had emerged, and the pH and EC of the culture nutrient
solution were measured every 1 to 2 d and adjusted as necessary.
Plant Environmental Condition
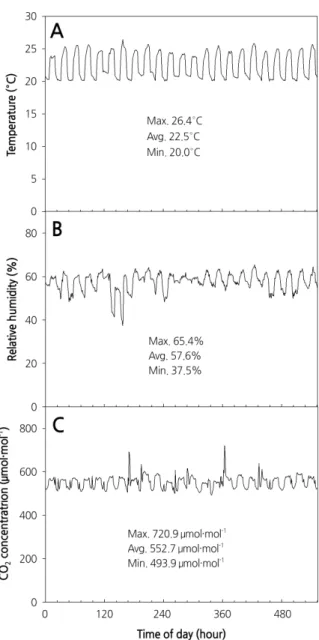
Light intensity was measured by using a quantum sensor (LI-190; Li-cor, Lincoln, Nebraska, USA). The temperature and relative humidity were measured using a temperature and relative humidity sensor (HMP45AC; Campbell Scientific, Logan UT, USA), and CO2 concentration was measured using a CO2 sensor (GMP222, Vaisala, Helsinki, Finland) (Fig. 1). Tem- perature and relative humidity in the plant factory were controlled by an ON/OFF system using a controller (SDM-CD16AC, Campbell Scientific, Logan UT, USA). The temperature was maintained at 20-26°C using an air conditioner (HP-N239L;
Samsung Electronics Co., Ltd., Korea) and heaters (HV-7800; Hanvit System Co., Ltd., Korea, and NH-5; Hwajeun Eng., Korea), and humidity was controlled using a dehumidifier (SG-M220S-4; Shinan Green-Tech Co., Ltd., Korea).
Fig. 1. Changes in temperature (A), relative humidity (B), and CO2 concentration (C) during the experimental period (April 18-May 20, 2016).
CO2 concentrations were maintained at 500-720 μmol·mol-1 using underground air (Kim et al., 2007). An air circulation fan (SGA-120, Shinan Green-Tech Co., Ltd., Korea) was used to maintain the air flow. A sensor was installed 1.5 m from the bottom and CO2 concentration was controlled according to a set value using the average of value measured at three plant factories. Light intensity, temperature, relative humidity, and CO2 concentration data were collected for 10 min every hour using a data collection device (CR-1000; Campbell Scientific, Logan UT, USA). The composition of culture nutrient solution used was a developmental medium prepared by analyzing the plants and adjusting the cation ratio.
Plant Growth Measurements
Leaf length, leaf area, plant fresh weight, and plant dry weight were measured for plants grown in each concentration of culture nutrient solution. Roots developed in the form of fibrous roots rather than a single taproot, and therefore root data were omitted.
Evaluation of Total Phenol Content and Antioxidant Capacity
Carrot shoots were collected on 33 days after the initiation of treatment and the leaves were lyophilized. The lyophilized samples were thereafter stored in a dark incubator at 4°C until analysis. Total phenolic content was determined by using a slightly modified Folin-Ciocalteu method (Ainsworth and Gillespie, 2007). The lyophilized samples were ground into a powder and samples (approximately 4 mg, 5 replicates) were mixed with 4 mL of 80% acetone and sonicated for 15 min (Sk5210HP; Hangzhou Nade Scientific Instruments, Zhejiang, China). The extract solution was maintained under dark conditions at 4°C for 12 h and then centrifuged at 3,000 × g for 2 min. The supernatant of the sample was used for analysis.
The subsequent procedure followed that described by Lee and Oh (2015). The unit is expressed as gallic acid-equivalent (mg) per gram of dry weight (mg GAE/g DW). Antioxidant activity was measured using 2,2′-azino-bis (3-ethylbenzothiazoline- 6-sulfonic acid) (ABTS; Sigma-Aldrich, St. Louis, Mo., USA) (Miller and Rice-Evans, 1996). The solution extracted with 80% acetone was treated at -20°C for 12 h. The subsequent process followed that described by Lee and Oh (2015). A standard curve was prepared using 6-hydroxy-2,5,7,8-tetramethylchroman-2-carboxylic acid (Trolox; Sigma-Aldrich, St. Louis, Mo., USA) and the used unit was Trolox-equivalent antioxidant capacity (mM) per dry weight (mM TEAC·g-1 DW).
Analysis of Total Phenolic Compounds
A sample of lyophilized material (approximately 0.1 g, 5 replicates) was mixed with 1.5 mL of acetonitrile containing 0.5%
HCl and hydrolyzed in a water bath at 80°C. The hydrolyzed solution was then subjected to ultrasonic extraction for 30 min (Sk5210HP; Hangzhou Nade Scientific Instruments, Zhejiang, China). The extract solution was then centrifuged at 3,000 × g for 20 min and the supernatant was filtered using a 0.22 μm syringe filter (Noble Bio, Hwaseong, Korea). Polyphenol compounds in the extract solution were analyzed using a high-performance liquid chromatograph system (YL9100;
Younglin, Anyang, Korea). The polyphenol compounds were isolated using an ACE-5-AQ column (4.6 × 250 mm; Advanced Chromatography Technologies Ltd., Reading, UK) equipped with a guard column. The column temperature was 30°C and the injection volume was 10 μL. Solvents A and B were water containing 100% acetonitrile and 0.5% acetic acid, respectively.
The solution gradient conditions were as follows: solvent A acetonitrile 0-10% (10 min), 10-20% (30 min), 20-30% (40 min), 30-40% (50 min), 40-80% (60 min), 80-0% (61 min), and 0-0% (70 min). The flow rate was 0.8 mL·min-1 and the absorbance
was measured at 320 nm using standard chlorogenic acid (Sigma-Aldrich, St. Louis, MO, USA) and kaempferol (Sigma-Aldrich, St. Louis, Mo., USA). The units were expressed in mg per 100 g of dry weight (mg/100 g DW).
Statistical analysis
The experimental design was a randomized block design and statistical analysis was performed using the SAS statistical package (Statistical Analysis, Ver. 9.3, Cary, NC, USA). Significance was determined using Duncan’s multiple rage test (DMRT) at a 95% confidence level.
Results and Discussion Plant Growth Parameters
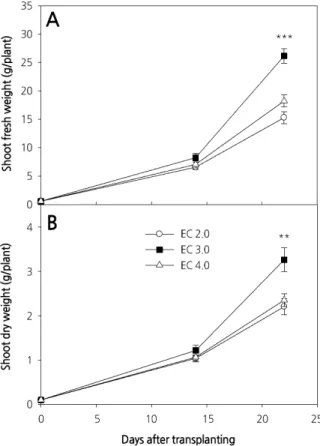
Changes in the fresh and dry weights of carrot shoots at 14 and 23 days after planting (DAP) are shown in Fig. 2. Although carrot shoot fresh and dry weights at 14 DAP were unchanged by growing under varying concentrations of culture nutrient solution (Fig. 2A and 2B), significant differences were observed among different treatments at 23 DAP. Fresh and dry weight were highest in plants grown in the EC 3.0 dS·m-1 culture nutrient solution, whereas there were no significant differences in the weights of plants grown in the EC 2.0 and EC 4.0 dS·m-1 solutions. These results are consistent with those previously
Fig. 2. Shoot fresh (A) and dry (B) weights of carrot plants grown under different levels of culture nutrient solution electrical conductivity (EC) in a closed-type plant factory system. Error bars are SEM (n = 8). **,***Significant at p ≤ 0.01 or 0.001, respectively.
reported for Eruca sativa L. (salad rocket), whereby a high concentration culture nutrient solution significantly affected growth (D’Anna et al., 2003). However, in contrast, endive grown under a high concentration of culture nutrient solution did display enhanced growth (Kowalczyk et al., 2016).
Previous experiments using a protected cultivation system indicated that the highest plant growth rate was obtained with a culture nutrient solution concentration of EC 1.0 dS·m-1. Moreover, plant growth rates were significantly lower with culture nutrient solution concentrations greater than EC 3.0 dS·m-1. However, our results indicate that the growth rate was highest at EC 3.0 dS·m-1, suggesting that the concentration of culture nutrient solution for optimal growth can differ according to the growing system used.
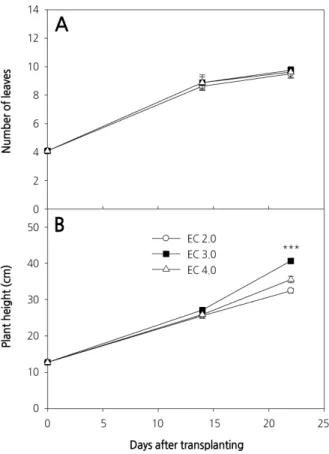
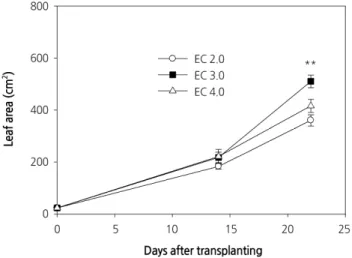
We observed an increase in the number of carrot leaves during the experimental period, although there were no significant differences among the three culture nutrient solution treatments (Fig. 3A). Plant heights between treatments also were not significantly different at 14 DAP; however, different culture nutrient solution treatments had a significant effect on plant height at 23 DAP (Fig. 3B). This result is in contrast to those of D’Anna et al. (2003), who reported that there was no dif- ference in the heights of E. sativa plants grown in EC 2.8 dS·m-1 and EC 3.8 dS·m-1 culture nutrient solutions. Plant height is an important determinant of crop harvesting time in plant factories with limited cultivation space. Leaf area was comparable between treatments at 14 DAP; however, at 23 DAP, there was a significant difference in the leaf area of plants grown in the different culture nutrient solutions (Fig. 4). Comparable to shoot fresh weight, leaf area increased rapidly following 14 DAP and the greatest and least leaf area at 23 DAP was measured in those plants grown with EC 3.0 dS·m-1 and EC 2.0 dS·m-1
Fig. 3. Number of leaves (A) and height (B) of carrot plants grown under different levels of culture nutrient solution electrical conductivity (EC) in a closed–type plant factory system. Error bars are SEM (n = 8). ***Significant at p ≤ 0.001.
culture nutrient solutions, respectively. Preliminary experiments were conducted using an EC 1.0 dS·m-1 culture nutrient solution on the basis of greenhouse experiments; however, unlike in the greenhouse, the plants grown hydroponically displayed severe chlorosis. Therefore, the concentration of the culture nutrient solution was increased in this experiment (data not shown).
In contrast to previous experiments, we observed no significant differences in chlorophyll a, chlorophyll b, and total chlorophyll contents among plants treated with different culture nutrient solution concentrations (Table 1). Total phenol content was significantly different between plants grown under different culture nutrient solution treatments, with the highest content measured in plants grown in the EC 2.0 dS·m-1 culture nutrient solution (Fig. 5). However, as described above, the highest dry weight was obtained for plants grown in the EC 3.0 dS·m-1 culture nutrient solution. Therefore, the total phenol content would be affected based on differences in dry weight. Furthermore, in addition to being affected by culture nutrient solution concentration, total phenol content has been shown to increase with an increase in temperature (Sakamoto and Suzuki, 2015). In contrast to phenol content, the sulfur oxidizing ability representing antioxidant activity did not show any significant differences among the various EC treatments (Fig. 5). Recently, there have been a number of studies conducted on the antioxidant activities and functional components of different vegetable crops (Yu et al., 2006). In many preliminary studies, radical scavenging activity has been found to increase in proportion to polyphenol content (Park, 2000; Lee et al., 2005). Although the present study showed that total polyphenol content was highest with EC 2.0 dS·m-1, other studies have observed no difference in antioxidant activity among plants treated with culture nutrient solution of different concentrations.
These results suggest that antioxidant activity remains relatively static from the beginning of plant growth to the end of harvest.
Fig. 4. Leaf area of carrot plants grown under different levels of culture nutrient solution electrical conductivity (EC) in a closed-type plant factory system. Error bars are SEM (n = 8). **Significant at p ≤ 0.01.
Table 1. Chlorophyll content of carrot leaves grown under different levels of electrical conductivity (EC) at 23 days after planting Electrical conductivity (dS·m-1) Chlorophyll a (mg·g-1 FW) Chlorophyll b (mg·g-1 FW) Total chlorophyll (mg·g-1 FW)
2.0 5.85 ± 0.124z 2.08 ± 0.066 7.93 ± 0.187
3.0 5.38 ± 0.556 1.79 ± 0.163 7.17 ± 0.719
4.0 5.74 ± 0.240 1.94 ± 0.081 7.68 ± 0.318
zMean ± SE (n = 6).
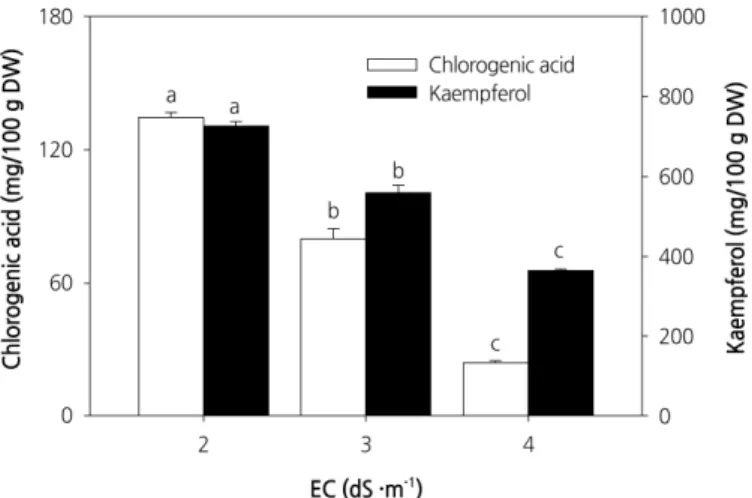
The results for chlorogenic acid and kaempferol content in response to different treatments are shown in Fig. 6. The contents of both chlorogenic acid and kaempferol were highest in plants grown at EC 2.0 dS·m-1 and lowest in plants grown at EC 4.0 dS·m-1. Chlorogenic acid is a polyphenolic compound formed through an ester bond between coffeic acid and quinic acid (Clifford, 2000). It is used as a preservative and flavoring agent that prevents the decay of food in container packages, and has be shown to contribute to the prevention of cancer and cardiovascular diseases caused by oxidative damage in vivo.
Chlorogenic acid in the human diet is found primarily in coffee, potatoes, burdock, and sweet potato (Fang et al., 2005).
However, here we observed that carrot leaves contain both chlorogenic acid and kaempferol, and thus have potential as a functional food. Although the phenol content per gram of dry weight was highest in plants grown under the EC 2.0 dS·m-1 treatment, it would be more appropriate to cultivate carrot at EC 3.0 dS·m-1 since plants grown at this concentration have a higher dry weight. The results of the present study indicate that an EC 3.0 dS·m-1 culture nutrient solution combined witha cultivation period of 20-25 d is optimal for cultivating carrot leaves in a plant factory. Carrot leaves grown under such conditions have potential as a functional food because they are rich in phenols.
Fig. 5. Total phenolic concentration (TP) and antioxidant capacity (AOC) of carrot plants grown under different levels of culture nutrient solution electrical conductivity (EC) at 33 days after transplanting. Error bars are SEM (n = 5).
Fig. 6. Chlorogenic acid and kaempferol content of carrot plants grown under different levels of culture nutrient solution electrical conductivity (EC) at 33 days after transplanting. Different letters indicate significant differences (Duncan’s test, p ≤ 0.05). Error bars are SEM (n = 5).
Literature Cited
Almeida VV, Bonafe EG, Muniz EC, Matsushita M, Souza NE, Visentainer JV (2009) Optimization of the carrot leaf dehydration aiming at the preservation of omega-3 fatty acids. Quim Nova 32:1334–1337. doi:10.1590/S0100-40422009000500042
Ainsworth EA, Gillespie KM (2007) Estimation of total phenolic content and other oxidation substrates in plant tissues using Folin- Ciocalteu reagent. Nat Protoc 2:875-877. doi:10.1038/nprot.2007.102
Cha MK, Kim JS, Shin JH, Son JE, Cho YY (2014) Practical design of an artificial light-used plant factory for common ice plant (Mesembryanthemum crystallinum L). J Bio-Environ Control 23:371-375. doi:10.12791/ksbec.2014.23.4.371
Cha MK, Kim JS, Cho YY (2012) Growth response of lettuce to various levels of EC and light intensity in plant factory. J Bio-Environ Control 21:305-311. doi:10.12791/ksbec.2012.21.4.305
Cho YY, Choi KY, Lee YB, Son JE (2012) Growth characteristics of sowthistle (Ixeris dentata Nakai ) under different levels of light inten- sity, electrical conductivity of culture nutrient solution, and planting density in a plant factory. Hortic Environ Biotechnol 53:368-372.
doi:10.1007/s13580-012-0691-1
Clifford MN (2000) Chlorogenic acid and other cinnamates-nature, occurrence, dietary burden, absorption and metabolism. J Sci Food Agric 80:1033-1043. doi:10.1002/(SICI)1097-0010(20000515)80:7<1033::AID-JSFA595>3.0.CO;2-T
D’Anna F, Miceli A, Vetrano F (2003) First results of floating system cultivation of Eruca sativa L. Acta Hortic 609:361-364. doi:10.
17660/ActaHortic.2003.609.54
Fang SH, Yerra KR, Tzeng YM (2005) Inhibitory effects of flavonol glycosides from cinnamomum osmophloeum on inflammatory mediators in LPS/IFN-γ-activated murine macrophages. Bioorg Med Chem 13:2381-2388. doi:10.1016/j.bmc.2005.01.050 Han SH, Kim JS, Teruya T, Teruya Y, Moromizato I, Lim CK (2016) Comparison of the fruit qualities, the free radical scavenging activities
and mangiferin content of the mango, cv. Irwin cultivated in Jeju and Okinawa. Korean J Hortic Sci Technol 34:634-643. doi.
org/10.12972/kjhst.20160065
H eo JW, Lee YB, Chang YS, Lee JT, Lee DB (2010) Effects of light quality and lighting type using an LED chamber system on chrysanthemum growth and development cultured in vitro. Korean J Environ Agric 29:374-380. doi:10.5338/KJEA.2010.29.4.374 Ikeda A, Y Tanimura, K Ezaki, Y Kawai, S Nakayama, K Iwao, H Kageyama (1992) Environmental control and operation monitoring in a
plant factory using artificial light. Acta Hortic 304:151-158. doi:10.17660/ActaHortic.1992.304.16 KMA (2016) http://web,kma.go.kr/notify/press/kma_list.jsp.E1 Nino status and outlook (Press release No.3972)
Kowalczyk K, Wolska J G, Marcinkowska M, Cetner MD, Kalaji HM (2016) Response of growth, quality parameters and photosynthetic apparatus of endive plant to different culture media. Folia Hortic 28:25-30. doi:10.1515/fhort-2016-0004
KOSIS (2015) Open field vegetable cultivation area. 1975-2016
Lee GJ, Heo JW, Kim HH, Jung CR, Kim DE, Nam SY (2016) Effects of artificial light sources on growth and yield of Peucedanum japonicum hydroponically grown in plant factory. Protected Hortic Plant Fac 25:16-23. doi:10.12791/KSBEC.2016.25.2.77 Lee JE, Cha WC (2015) An analysis of the professional's cognition regarding the plant factory feasibility. J Digital Converg 13:89-97.
doi:10.14400/JDC.2015.13.12.89
Lee J, Chang MS, Kim GH (2015) Quality characteristics and antioxidant activities of organically and conventionally grown carrot. J Korean Soc Food Cult 30:778-782. doi:10.7318/KJFC/2015.30.6.778
Lee SO, Lee HJ, Yu MH, Im HG, Lee IS (2005) Total polyphenol contents and antioxidant activities of methanol extracts from vegetables produced in Ullung Island. Korean J Food Sci Technol 37:233-240
Miller NJ, Rice-Evans CA (1996) Spectrophotometric determination of antioxidant activity. Redox Rep 2:161-171. doi:10.1080/13510002.
1996.11747044
Morimoto T, Torii T, Hashimoto Y (1995) Optimal control of physiological processes of plants in a green plant factory. Control Eng Pract 3:505-511. doi:10.1016/0967-0661(95)00022-M
Neelin JD (1990) A hybrid coupled general circulation model for E1 Nino studies. J Atmos Sci 47:674-693. doi:10.1175/1520-0469 (1990)047<0674:AHCGCM>2.0.CO;2
Park SY (2000) Studies on the SOD-like activity of young green barley leaves (Hordenum vulgare L). MS thesis, Korea University, Seoul, Korea, p 9
Qin L, S Guo, W Ai, Y Tang (2008) Selection of candidate salad vegetables for controlled ecological life support system. Adv Space Res 41:768-772. doi:10.1016/j.asr.2007.09.037
Sakamoto M, Suzuki T (2015) Elevated root-zoon temperature modulates growth and quality of hydroponically grown carrots. Agric Sci 6:749-757. doi:10.4236/as.2015.68072
Shin MO, Bae SJ (2001) The effect of Daucus carota L. extracts on the fluidity of phospholipid liposomes. Korean J Soc Food Sci 30:
646-650
Um YC, Oh SS, Lee JG, Kim SY, Jang YA (2010) The development of container-type plant factory and growth of leafy vegetables as affected by different light sources. J Bio-Environ Control 19:333-342
Yu MH, IM HG, Lee HJ, Ji YJ, Lee IS (2006) Components and their antioxidative activities of methanol extracts from sarcocarp and seed of Zizyphus jujuba var. inermis Rehder. Korean J Food Sci Technol 38:128-134