Korean J Environ Agric (2012) Online ISSN: 2233-4173 Vol. 31, No. 1, pp. 24-29 http://dx.doi.org/10.5338/KJEA.2012.31.1.24 Print ISSN: 1225-3537
Effects of electron donors and acceptors in generating bioelectrical energy using microbial fuel cells
Anup Gurung and Sang Eun Oh*
Bioenergy Laboratory, Department of Biological Environment, Kangwon National University, Gangwon-do, South Korea
Received: 29 February 2012 / Accepted: 23 March 2012
ⓒ 2012 The Korean Society of Environmental Agriculture
*교신저자(Corresponding author),
Phone: +82-33-250-6449; Fax: +82-33-241-6640;
E-mail: [email protected]
24
Abstract
BACKGROUND: In recent years, microbial fuel cells (MFCs) have emerged as a promising technology for recovering renewable energy from waste biomass, especially wastewater. In this study, the possibility of bioelectricity generation in two chambered mediator-less microbial fuel cells (MFCs) was successfully demonstrated using fermentable and non-fermentable substrates.
METHODS AND RESULTS: Two different electron acceptors have been tested in the cathode chamber for the effects of reducing agent on the power generation in MFCs. The average voltages of 0.26±0.014 V and 0.36±0.02 V were achieved with acetate using oxygen and potassium ferricyanide as reducing agent, respectively.
Similarly, with glucose the average voltages of 0.256±0.05 V and 0.340±0.04 V were obtained using oxygen and ferricyanide, respectively. Using potassium ferricyanide as the reducing agent, the power output increases by 39 and 43% with acetate and glucose, respectively, as compared to the dissolved oxygen. Slightly higher coulombic efficiency (CE%) was obtained in acetate as compared to MFCs operated with glucose. The maximum power densities of 124 mW/m
2and 204 mW/m
2were obtained using dissolved oxygen and K
3Fe(CN)
6, respectively.
CONCLUSION(s): This study demonstrates that power generation from the MFCs can be influenced significantly by the different types of catholyte.
Relatively higher CE was obtained with K
3Fe(CN)
6. Thus, application of K
3Fe(CN)
6as the catholyte can be vital for scaling uppower generation from the MFCs forreal time applications.
Key Words: Bioelectricity, mediator less, microbial fuel cell, power density, swine wastewater
Introduction
Depending on the end-use applications, microorganism can produce fuels like ethanol, methanol and hydrogen from organic matter (Mohan et al., 2007; Oh and Logan, 2005). In recent years, it has been reported that microorganism can also generate power by converting organic matter into electricity using microbial fuel cells (MFCs) (Logan et al., 2006; Logan and Regan, 2006; Mohan et al., 2007; Rabaey and Verstraete, 2005).
MFCs are bio-electrochemical reactors that convert biodegradable organic material directly into bioelectricity using electrochemically active microorganisms as biocatalysts (Jeremiasse et al., 2010; Logan et al., 2006;
Logan and Regan, 2006).
A typical MFC consists of anode and cathode compartments separated by cation specific membrane (proton exchange membrane; PEM) (Logan et al., 2006;
Oh et al., 2004). Microbes in the anode compartment
Open Access
Research Article
oxidize fuel (electron donor) generating electrons and proton through the anaerobic respiration of organic substrates (Logan et al., 2006; Oh and Logan, 2006;
Oh et al., 2009). The electrons are transported to the cathode through an external circuit (Mohan et al., 2007).
Electrons and protons are consumed in the cathode compartment, reducing oxygen to water (Jeremiasse et al., 2010; Logan et al., 2006). During the process, the potential difference between the respiratory system and electron acceptor generates the current and voltage needed to generate electricity (Logan et al., 2006;
Mohan et al., 2008; Oh and Logan, 2006; Oh and Logan, 2005).
MFCs technology provides new opportunities for the sustainable generation of bioelectrical energy from biodegradable and reduced organic compounds through the metabolic activity of the bacteria (Logan et al., 2006; Pant et al., 2010; Rabaey and Verstraete, 2005).
MFCs have tremendous electron donor versatility in which microorganism use wastewater as substrates to generate electricity and accomplish wastewater treatment simultaneously (Lu et al., 2009; Mohan et al., 2007;
Oh and Logan, 2005; Pant et al., 2010). In most of the MFCs studies so far, acetate and glucose have been the substrate of choice for electricity generation (Pant et al., 2010). These substrates are commonly used as carbon source in MFCs because of their inertness towards alternative microbial conversions, and cheap and readily available (Basu and Basu, 2010). In a MFC, substrate is regarded as one of the most important biological factors that influence the integral composition of the bacterial community in the anodic biofilm and the MFC performance including power density and coulombic efficiency (Chae et al., 2009;
Liu et al., 2009; Lu et al., 2009; Oh and Logan, 2006;
Pant et al., 2010).
There are a variety of factors that affect the overall performance of a MFC, such as performance of the cathode, solution conductivity, pH, alkalinity, circuit resistance, proton transfer through the membrane and type of organic matter (Gil et al., 2003; Liu et al., 2005; Logan et al., 2006; Oh and Logan, 2006). In most of the MFC studies so far, mainly Pt has been used as a catalyst to improve the oxygen reduction rate at the cathode (Liu et al., 2005). Pt has high catalytic performance, however, is an expensive catalyst and presently limits the large scale application in MFCs (Jeremiasse et al., 2010). Pt is expensive and its components present in wastewaters can affect the
performance of MFCs negatively (Selembo et al., 2009). Therefore, there is need for alternative catalyst at the cathode that is cost-effective.
Due to its unlimited availability and high standard redox potential, oxygen was used as terminal electron acceptor in the cathode compartment of MFCs (Tran et al., 2009). In this study, we report on power generation in two chamber mediators-less MFC, using organic compounds as substrate (carbon source or electron donor). Two different cathodic catalysts; oxygen and potassium ferricyanide (K
3Fe(CN)
6) were evaluated in order to ascertain the effect of these materials on power generation.
Materials and Methods
MFC configuration
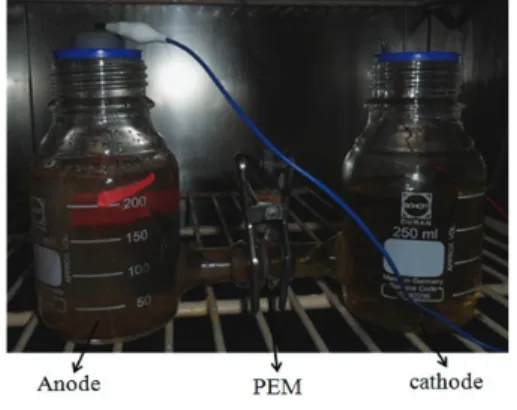
The two chambered H-type MFCs (310 mL capacity, corning Inc. NY) were constructed as described previously (Fig. 1) (Oh et al., 2009). The anode and cathode compartments were separated by a PEM (3.5 cm
2cross section, Nafion
TM117, DuPont Co., Delaware, USA), and the working volume of each chamber was 200 mL. The PEM was pretreated and stored in deionized (DI) water prior to being used as mentioned elsewhere (Oh and Logan, 2006). For the MFC where potassium ferricyanide was used as the terminal electron acceptor, both the anode and cathode electrodes (2.5cm × 4cm; 10cm
2) were made of carbon paper (NARA, Guro-GU, Seoul, South Korea). Whereas in case of oxygen as terminal electron acceptor, the cathode electrode was coated with a Pt-catalyst (0.5 mg/cm
2) on one side (De Nora North America, Inc.). Pretreatment of electrodes and electrical connections were done as previously mentioned (Oh and Logan, 2006).
Fig. 1 Picture of two-chamber H-type MFC system used in this experiment
Inoculation and operation of MFCs
All MFCs were inoculated with anaerobically digested swine wastewater collected from a local pig farm in Anseong, Gyeonggi Province, Korea. Initially 5 mL swine wastewater was inoculated in a nutrient mineral buffer (NMB) solution together with 1 g/L acetate. The NMB medium consisted of: NaHCO
3(3.13 gL
-1),NH
4Cl (0.31 g L
-1), NaH
2PO
4.H
2O (0.75 g L
-1), KCl (0.13 g L
-1), NaH
2PO
4(4.22 g L
-1), Na
2HPO
4(2.75 g L
-1), and trace metal and vitamin solutions were also added as previously described in Oh et al (2004).
The anode and cathode compartments were filled with the same medium (200 mL); NMB solution. The anode chamber was flushed with N
2(80%) for 5 min and then sealed with a rubber stopper and cap. In the case of oxygen as terminal electron acceptor, the cathode chamber was continuously sparged with air, whereas the cathode chamber was filled with 50 mM K
3Fe(CN)
6where K
3Fe(CN)
6was used as the terminal electron acceptor. All MFC tests were operated at a fixed external circuit resistance (1,000 Ω unless stated otherwise). The MFC experiments were conducted in a constant temperature (30℃) by placing in the temperature controlling incubator.
Analyses and calculations
Each MFC system was monitored using a precision multi-meter and a data acquisition system (2700, Keithley, OH) with a voltage across resistor recorded every 30 min. The potential of the individual electrodes was measured by an Ag/AgCl reference electrode (0.195; corrected to a normal hydrogen electrode, NHE).
Polarization curves were obtained using an IviumStat electrochemical analyzer (IVIUM Technology, the Netherlands). Polarization curves were produced by sweeping current values covering the range of 0.05- 0.65 mA. Power (P) was calculated according to P= IV (I=V/R), where I (A) is the current, V (v) is the voltage, and R (Ω) is the external resistance. The power density (PD) was calculated as previously described by Logan et al. (2006), in which the power output is normalized to the projected anode surface area. The coulombic efficiency (CE) (%) was calculated as previously described by Oh and Logan (2006).
All data were expressed as mean value (±) standard deviation of the number of experiments using Microsoft Excel Software 2007. One-way analysis of variance (ANOVA) was used to determine the significance of differences in the average voltage production and
power density using different electron donors and acceptors. To compare whether the average values are significantly different or not, least significant difference (LSD) was calculated at α=0.05 as described in Little and Hills (1978). Statistical significance was considered at p<0.05.
Results and discussion
Start-up and enrichment of the MFCs
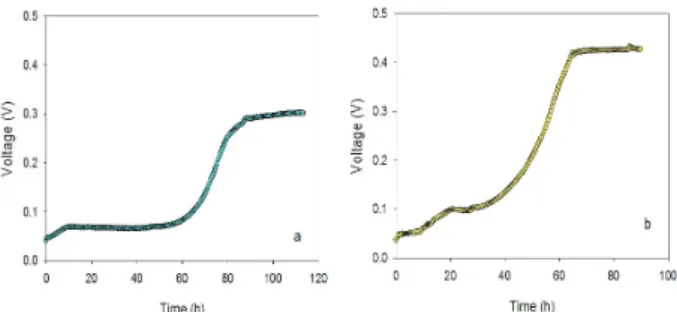
Initially 1 g/L acetate was fed to the MFCs in order to reach a reproducible state of the MFCs and to achieve enrichment of the anodic electrode with electrochemically active bacteria. As depicted in the Fig. 2(a and b) there were observations of lag phase approximately 45~50 h during the start-up period.
When a stable voltage was generated, the anodic solution in the MFC systems was replaced with fresh NMB solution and 0.1 g/L acetate. The open circuit voltage (OCV) of 0.766±0.001 V was obtained using oxygen as reducing agent in the cathode chamber.
Similarly, with K
3Fe(CN)
6as the reducing agent, the OCV stabilized to 0.81 V after nearly 9 h. The anode and cathode potentials of the air-cathode MFCs were found to be-0.525 and 0.225 V, respectively. Whereas, with K
3Fe(CN)
6as terminal electron acceptor, the anode and cathode potentials were-0.442 and 0.371 V, respectively.
Fig. 2. Enrichment of the MFCs using (a) oxygen and (b) ferricyanide as the electron acceptors
Electricity generation using different substrates and catholytes
After achieving a stable reproducible voltage of the
MFCs, the culture medium in the anode chamber was
replaced with fresh medium (NMB solution) and 0.1
g/L acetate was added. Fig. 3a depicts the voltage
generation with oxygen as terminal electron acceptor
at a fixed external load (1000 Ω). When 0.1 g/L of
acetate was added into the MFCs, stable voltage was
reproduced within short period of time in the system.
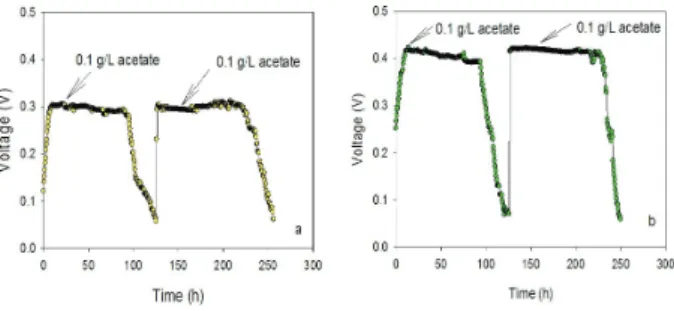
It might be due to the presence of certain bacteria with electricity generating activity that was obviously present in the attached microbial consortium at the anodice lectrode. When the cell potential decreased below 0.06 V, the anodic chamber was replenished with 0.1 g/L acetate.
Two cycles of replacing were investigated. However, there was no much difference in cell potential output in each cycle where the steady cell potential was observed and registered at a maximum value of 0.301±0.009 V, suggesting the steady state of the MFCs. Thus, the average voltage of 0.26±0.014 V and the power of 0.06 mW were achieved at 1000 Ω with air-cathode. Relatively higher CE of 63±5.4% was obtained using air-cathode. The voltage and the CE obtained in this study with acetate were comparable to the previous MFCs studies (Jung and Regan, 2007;
Oh and Logan, 2006; Oh et al., 2004).
Fig. 3. Voltage generation from MFCs with (a) oxygen and (b) ferricyanide as the electron acceptors in the cathode compartments using 0.1 g/L acetate
Fig. 3b shows the voltage generation using K
3Fe(CN)
6as the catholyte at the external load (1000 Ω). With K
3Fe(CN)
6as the terminal electron acceptor, the power increased as compared to oxygen as the catholyte, and the maximum voltage stabilized at 0.412±0.006 V.
The average voltage of 0.36±0.02 V and the power 0.13 mW were achieved, respectively. With K
3Fe(CN)6 as the catholyte the CE increased significantly (84±5.4%). The working voltage obtained in this study was lower than reported by the previous MFC studies (Zhang et al., 2011). Zhang et al (2011) obtained the working voltage of 505±5 mV (at 1000 Ω) using K
3Fe(CN)
6as the catholyte with acetate. However, the CE obtained in the current study was much higher than the CE obtained by Zhang et al (2011). The statistical analysis showed significant differences in the voltage production using oxygen and K
3Fe(CN)
6as reducing agents in the cathode. Use of K
3Fe(CN)
6as the reducing agent was highly significant and produced higher voltage as compared to oxygen as reducing agent with acetate as substrate (p<0.05).
In order to investigate the voltage generation with glucose as substrate, both the anodic and cathodic compartments were replaced with fresh NMB solution.
0.1 g/L glucose was added in the anode chamber. As shown in the Fig.4 (a and b), the cell potential increased steadily and stabilized the maximum voltage after 8-10 h. The voltages obtained using glucose were similar to that of acetate using oxygen and the K
3Fe(CN)
6as the terminal electron acceptors. The average voltages of 0.256±0.05 and 0.340±0.04 V were obtained using oxygen and K
3Fe(CN)
6, respectively.
Relatively lower CEs were obtained using glucose as substrate in the MFCs. The CEs were 40±5 and 59±4%, respectively, with oxygen and K
3Fe(CN)
6as the terminal electron acceptors. The statistical analysis showed significant differences in the voltage production using oxygen and K
3Fe(CN)
6as reducing agents in the cathode with glucose as substrate. Use of oxygen as the reducing agent produced significantly lower voltage as compared to K
3Fe(CN)
6as the reducing agent (p<0.05).
Fig. 4. Voltage generation from MFCs with (a) oxygen and (b) ferricyanide as the electron acceptors in the cathode compartments using 0.1 g/L glucose
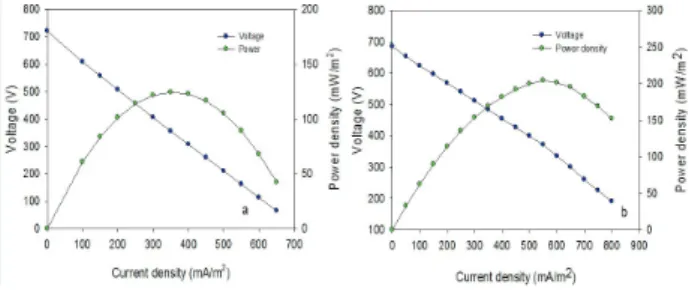
Polarization characteristics of the MFCs
Furthermore, the effects of catholyte on power
generation were investigated by drawing polarization
curves. Fig.5a shows the polarization curve for the
air-cathode with 0.1 g/L acetate. The maximum power
density of 124 mW/m
2was obtained corresponding to the
maximum current density of 350 mA/m
2. Fig.5b
shows the polarization curve for the K
3Fe(CN)
6as the
catholyte. The maximum power density of 204
mW/m
2was obtained corresponding to the maximum
curren tdensity of 550 mA/m
2. Fig.6 (a and b)
represents the polarization curves with oxygen and
K
3Fe(CN)
6as the electron acceptors using 0.1 g/L glucose. The maximum power densities of 99 and 168 mW/m
2were obtained using oxygen and K
3Fe(CN)
6, respectively.
Fig. 5. Polarization curves for the MFCs under different catholytes; (a) oxygen and (b) ferricyanide with 0.1 g/L acetate
Fig. 6. Polarization curves for the MFCs under different catholytes; (a) oxygen and (b) ferricyanide with 0.1 g/L glucose