INTRODUCTION
The seawater is generally used as a cooling agent. This is common practice because power plants need a great deal of cooling agents in its daily operation. Nuclear power plants need cooling waters more than thermal power plants because of the lower thermal efficient. Consequently, these cooling waters-called thermal discharges or thermal effluents-enter waters adjacent to these power plants. These thermal dis- charges have an influence on marine ecosystems and often limit the distribution of marine organisms including phyto- plankton at discharge areas (Langford 1990; Suresh et al.
1995).
Principal factors affecting organisms, in thermal discharges of power plants are (1) thermal shock due to abrupt changes in water temperature (2) chlorination of the discharge water, and (3) elevated temperatures caused by cooling water dis- charge. Chlorine, used to control slime build-up in power plant cooling systems, inhibits the growth of phytoplankton assemblages (e.g. Morgan and Stross 1969; Hamilton et al.
1970; Brook and Baker 1972; Carpenter et al. 1972). Among the several groups of marine organisms that can be entrain- ed, phytoplankton have special significance because they contribute a basic link the aquatic food chain. The entrain- ment effects on phytoplankton are variable and depend on the location and operating conditions of power plant (Warin- ner and Brehmer 1966; Hamilton et al. 1970; Brook and Baker 1972; Carpenter et al. 1972; Fox and Moyer 1973,
─
─ 173 ──
Fluctuation Rates of Phytoplankton Assemblages by Passage through Power Plant Cooling System
Yeon-Shik Kang*, Ju-Hwan Lim, Yeon-Tae Jeong and In-Sung Jeon KEPCO Research Institute, Daejeon 305-760, Korea
Abstract -- In order to investigate the fluctuation rates [FR] of phytoplankton after passage through a cooling system, the standing crops, chlorophyll a concentrations and carbon assimilation num- ber of phytoplankton were surveyed at intake and outlet at Wolsong nuclear power plant [NPP]
from July 2006 to June 2008. As a result, the total mean standing crops of phytoplankton were 1.0
×
×106cells L--1and 7.3××105cells L--1at intake and outlet, respectively. The FR of phytoplankton by passage through the cooling system [PTCS] was 27.0%. Among them, the FR of microplankton and nanoplankton were 34.1% and 12.4%, respectively. In addition, the FR of diatoms and dino- flagellates were 33.9% and 29.7%, respectively. These results showed the entrainment effects on microplankton and diatoms by PTCS were higher than those of nanoplankton and dinoflagellates.
The FR of total chlorophyll a concentrations were 54.4%, and the FR of microplankton, nano- plankton and picoplankton were 58.9%, 38.5%, and 52.4%, respectively. So the entrainment effects on microplankton by PTCS were higher than those of nanoplankton and picoplankton. The mean FR of carbon assimilation number of phytoplankton was 57.6%, and the seasonal variations of FR of carbon assimilation number ranged from 47.5% to 76.8%. Our results indicated that the phytoplankton species responded differently to power plant operating conditions such as elevated temperature, chlorination, and mechanical impacts.
Key words : cooling system, fluctuation rates, phytoplankton, nuclear power plant
* Corresponding author: Yeon-Shik Kang, Tel. 042-865-7662, Fax. 042-865-7509, E-mail. [email protected]
1975). Most attention has been focused on the effects of temperature increases and chlorination; however, chlorina- tion is normally associated with estuarine and marine envi- ronments which are typically populated with fouling com- munities. The concentration of chlorophyll a in a standing crop was measured to estimate effects on the phytoplankton.
The result of this measurement was a photosynthesis index rate of 14C. Carbon assimilation, chlorophyll a and various physiological indices were used to measure the response of phytoplankton entrainment in once-through cooling waters at the power plant (Dunstall 1985). Some studies were con- ducted on phytoplankton community structure and the influ- ence of thermal discharges on phytoplankton in the adjacent waters of power plants in Korea (Yi and Chin 1987; Yeo and Shim 1992; Lee and Lee 1997; Kang and Choi 2001, 2002;
Kang et al. 2003; Kang 2008). These studies performed around power plants were mainly focused on ecological aspects of phytoplankton ecology, i.e. temporal and spatial variation of species composition, standing crops and domi- nant species. The entrainment effects on phytoplankton pass- ing through the cooling systems of power plants have yet to be fully understood (Yeo and Kim 1998; Choi et al. 2004).
Wolsong nuclear power plant (NPP) is located in the coa- stal area of Kyeongju, East Sea (35�43′35N, 129�30′35′′).
The present unit began operation in 1986. Electrical generat- ing capacity of the plant is 260 MW. Circulation pumps move water through the condenser system at the rate of about 40~50 m3sec-1. Chlorine was injected continuously in the mouth of intake at concentrations of about 0.33 mg L-1. As part of normal plant operations, there was a low concentra- tion of usually less than 0.1 mg L-1chlorine at the front of outlet.
In this study, we tried to analyze the standing crops, chlo- rophyll a concentrations, and carbon assimilation number of phytoplankton before and after PTCS of Wolsong NPP- gain a more information of entrainment effect on phytoplank- ton communities.
MATERIALS AND METHODS
Thermal discharges from Wolsong NPP were used for the field examination and laboratory experiment of possible thermal and chlorination effects. Samples of intake and out- let water were taken from July 2006 to June 2008. Standing
crops, chlorophyll a concentrations, and carbon assimilation number of phytoplankton were made. Residence time of cooling waters between the two sampling points (A, B) is approximately 15 minutes, but in reality depends on the rate of power plant operation. Sampling stations for the intake and outlet are shown in Fig. 1. The sea surface temperature (SST), salinity, and pH at intake and outlet were measured by CTD meter (IDRONAUT 316).
Standing crops, carbon assimilation numbers, and chloro- phyll a concentrations were measured before and after PTCS.
Phytoplankton samples were counted using a microscope with 150× magnification and filtered through a glass filter fiber (GF/F, Whatman). The procedure from Parsons et al.
(1984) was used to determine the chlorophyll a concentra- tions. The phytoplankton carbon assimilation number was measured by the 14C-technique based on Parson et al. (1984).
The results were expressed as mean counts of duplicate sam- ples per two hours of incubation. Water samples for measur- ing chlorophyll a concentrations were size-fractionated with separate filtration: microplankton (¤20μm), nanoplankton (5~20μm) and picoplankton (⁄5 μm). Filtered seawater was kept deep frozen and analyzed at the laboratory on Tur- ner 10-AU fluorometer. In field 14C experiments, phytoplank- ton samples were incubated in constant artificial light and temperature-controlled water baths in all of the studies. The heating-cooling apparatus employed was a spiral glass tub- ing 3 cm in diameter and about 30 cm in length. It was sub- merged in a thermostatic water bath in situ.
The fluctuation rates (FR) of standing crops, chlorophyll a concentrations, and carbon assimilation number of sam- Fig. 1. Map showing the sampling station at the Wolsong NPP (A:
Intake, B: Outlet).
Wolsong nuclear power plant
A
B
ples were compared in the intake and outlet water of Wol- song NPP. The FR of phytoplankton by PTCS was calculat- ed by the following equation:
[IntakeSC,Chl,CA-OutletSC,Chl,CA] FR (%)==mmmmmmmmmmmmmmmmmmmmmmmmm×100
IntakeSC,Chl,CA
The value of IntakeSC,Chl,CAand OutletSC,Chl,CArepresent the standing crops (SC), chlorophyll a concentrations (Chl) and carbon assimilation number (CA) of phytoplankton at the intake and outlet, respectively.
RESULTS
1. Distribution of temperature, salinity, and pH
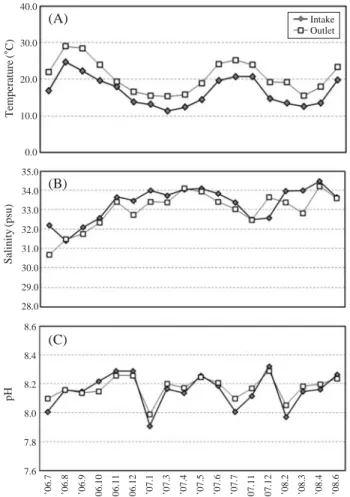
The SST varied from 11.4~24.8�C and 15.4~29.0�C in intake and outlet during the survey periods, respectively (Fig.
2A). So the differences of SST between intake and outlet
varied from 1.4 (November 2006)~6.2 (September 2006)�C with the operation conditions. The SST varied 11.4~13.5 (mean 12.7)�C, 12.4~19.7 (mean 16.0)�C, 16.9~24.8 (mean 21.1)�C and 13.9~19.7 (mean 16.6)�C in winter, spring, summer and autumn, respectively. The salinity of intake and outlet varied from 31.4~34.4 psu and 30.7~34.2 psu, respectively (Fig. 2B). The variations of pH in the intake and outlet varied from 7.9~8.3 and 8.0~8.3, respectively (Fig. 2C). So there was little difference in salinity and pH between the intake and outlet.
2. FR of the standing crops by PTCS
The standing crops of phytoplankton were compared in water samples at intake and outlet of Wolsong NPP. The total standing crops of phytoplankton ranged from 3.9×10⁵ cells L-1to 5.2×10⁶(mean 1.0×10⁶) cells L-1at intake and from 2.5×10⁶ cells L-1to 3.4×10⁶(mean 7.3×10⁵) cells L-1at outlet (Table 1). The total standing crops of phyto- plankton were reduced by PTCS during the survey periods and the amount of mean decrease was 2.7×10⁵cells L-1. The FR of standing phytoplankton crops was -16.0~59.3 (mean 27.0)% (Fig. 3A). They were markedly reduced in July (45.3%) 2006 and April (59.3%) 2007. The total stand- ing crops of phytoplankton at outlet, however, were higher than those of them at intake in May, June 2007 and April 2008 (Table 1). The standing crops of microplankton (¤20 μm) ranged from 9.8×10⁴ cells L-1to 4.9×10⁶(mean 6.7
×105) cells L-1at intake and from 5.6×10⁴ cells L-1to 2.7
×106(mean 4.5×10⁵) cells L-1at outlet (Table 1). The amount of mean decrease was 2.3×10⁵ cells L-1. So the FR of total standing crops of microplankton was -21.4~61.7 (mean 34.1%) (Fig. 3A). They were markedly reduced in July 2006 (50.6%) and April 2007 (61.7%). The standing crops of microplankton at outlet, however, were higher than those of them at intake in May, June 2007 and June 2008 (Fig. 3A).
Among microplankton, the amount of mean decrease of diatoms was 2.1×10⁵ cells L-1(Table 1). So the FR of di- atoms was -17.5~61.9 (mean 33.9%) (Fig. 3B). They were markedly reduced in July 2006 (50.8%) and March (47.7%) and April (61.9%) 2007. In November 2006, January, May, and June 2007, and June 2008, however, the standing crops of diatoms at outlet were higher than those of them at intake.
The amount of mean decrease of dinoflagellates was 1.4×
40.0
30.0
20.0
10.0
0.0 35.0 34.0 33.0 32.0 31.0 30.0 29.0 28.0 8.6
8.4
8.2
8.0
7.8
7.6
Temperature(�C)Salinity(psu)pH
(A)
(B)
(C)
’06.7 ’06.8 ’06.9 ’06.10 ’06.11 ’06.12 ’07.1 ’07.3 ’07.4 ’07.5 ’07.6 ’07.7 ’07.11 ’07.12 ’08.2 ’08.3 ’08.4 ’08.6
Intake Outlet
Fig. 2. Changes in temperature (A), salinity (B) and pH (C) at intake and outlet of Wolsong NPP from July 2006 to June 2008.
104 cells L-1(Table 1). So the mean FR of dinoflagellates was 29.7%. They were markedly reduced in September (57.9%), November (57.9%) 2006, March 2007 (47.7%) and February 2008 (61.9%) (Fig. 3B). In March and June 2007 and April and June 2008, however, the standing crops of dinoflagellates at outlet were higher than those of them at intake. In addition, the mean FR of other groups (Cyano- phyta, Chrysophyta, Euglena, etc.) was 17.6%.
On the other hand, the standing crops of nanoplankton (⁄20μm) ranged from 5.9×10⁴ cells L-1to 8.4×10⁵(mean 3.3×10⁵) cells L-1and from 4.2×10⁴ cells L-1to 6.8×10⁵ (mean 2.9×10⁵) cells L-1at intake and outlet, respectively (Table 1). The amount of mean decrease was 4.1×10⁴ cells L-1. So the FR of nanoplankton was -24.2~49.9 (mean 12.4)% (Fig. 3A). There were markedly reduced in July (33.5%) and November (35.8%) 2006 and June 2008 (49.9%).
The standing crops of nanoplankton at outlet, however, were higher than those of them at intake in August 2006, January and June 2007, and April 2008.
Accordingly, the mean FR of standing crops of micro- plankton, nanoplankton, diatoms, dinoflagellates and other groups during the survey periods was 34.1%, 12.4%, 33.9%, 29.7% and 17.6%, respectively (Fig. 3A, B). The seasonal changes in FR of microplankton were 1.7~32.3%, and the highest and lowest value were found in spring and winter,
respectively. But the seasonal changes in mean FR of nano- plankton were 10.3~15.7%, so a little was differences in seasons (Fig. 4). The seasonal changes in mean FR of diatom were 4.0~30.8%, and the highest and lowest value were found in spring and winter, respectively. The seasonal chan- ges in mean FR of dinoflagellate were -4.2~44.0%, and the highest value was found in summer (Fig. 4). The diatoms and dinoflagellates appeared as a dominant groups during this survey, the diatoms significantly controlled the overall variations of standing crops of phytoplankton while passing through the cooling systems.
These results showed that the FR of microplankton was higher than that of nanoplankton and the FR of diatoms was higher than that of dinoflagellates. Our results, therefore, indicated that the entrainment effects on microplankton and diatoms were higher than those of nanoplankton and dino- flagellates. In addition, phytoplankton decrement by PTCS was high at time when the standing crops of phytoplankton were high. But the decrement of phytoplankton was generally low at time when the standing crops of phytoplankton were low.
3. FR of the major species by PTCS
The standing crops of Chaetoceros debilis ranged from 6.4×10² cells L-1to 3.8×10⁵(mean 7.5×10⁴) cells L-1at Table 1. The standing crops of phytoplankton at intake and outlet of Wolsong NPP from July 2006 to June 2008 (Units: ×103 cells L-1)
Microplankton Nanoplankton
Year (¤20μm) (⁄20μm) Total Diatoms Dinoflagellates Other groups
Int. Out. Int. Out. Int. Out. Int. Out. Int. Out. Int. Out.
’06.7 791 391 360 239 1,151 630 755 371 32 17 4 2
’06.8 497 453 228 270 724 723 446 409 49 41 1 2
’06.9 519 307 323 277 841 585 354 232 161 73 6 3
’06.10 224 122 260 191 484 313 132 72 91 49 0.8 0.9
’06.11 98 57 298 191 395 248 24 25 73 31 0.9 1
’06.12 139 95 327 317 466 412 84 59 54 36 1 *ND
’07.1 292 224 327 385 619 609 242 249 49 46 1 4
’07.3 294 152 459 410 753 563 268 140 25 12 0.6 0.6
’07.4 4,942 1,895 272 225 5,214 2,120 4,900 1,865 40 28 1 1
’07.5 2,373 2,691 843 684 3,216 3,375 2,271 2,622 91 65 7 2
’07.6 178 216 345 380 523 596 102 115 74 97 1 4
’07.7 375 266 59 42 434 308 351 246 22 19 2 0.6
’07.11 359 288 478 439 837 728 327 266 32 21 1 2
’07.12 145 137 356 339 501 476 121 125 22 11 2 0.6
’08.2 422 284 219 183 641 467 408 276 13 6 1 2
’08.3 322 203 275 193 597 397 310 178 12 25 0.5 *ND
’08.4 114 113 235 292 349 406 99 95 12 15 1 3
’08.6 117 140 262 131 379 271 105 124 11 16 0.6 *ND
Mean 678 446 329 288 1,007 735 628 415 48 34 2 2
*ND: Non detected
intake and from 4.9×10² cells L-1to 4.5×10⁵(mean 6.1×
104) cells L-1at outlet. The standing crops of C. debilis were slightly reduced and the amount of mean decrease was 1.3
×104 cells L-1. So the FR of standing crops of C. debilis was -70.0~84.9 (mean 17.8)% (Fig. 5). They were marked- ly reduced in March (72.7%) and November (84.9%) 2007 and February (72.9%) and March (75.2%) 2008. The stand-
ing crops of C. debilis at outlet, however, were higher than those at intake in May and June 2007. The standing crops of C. socialis ranged from 0 to 4.4×10⁶(mean 2.8×10⁵) cells L-1at the intake and from 0 to 1.6×10⁶(mean 1.0×
105) cells L-1at outlet. The standing crops of C. socialis were markedly reduced and the amount of mean decrease was 1.7×10⁵ cells L-1. So the FR of standing crops of C.
socialis was 8.7~100.0 (mean 62.8%) (Fig. 5). The stand- ing crops of Leptocylindrus danicus ranged from 0 to 5.2×
104(mean 1.3×10⁴) cells L-1at intake and from 0 to 7.0×
104(mean 1.1×10⁴) cells L-1at outlet. The standing crops of L. danicus were slightly reduced and the amount of mean decrease was 1.8×10³ cells L-1. So the mean FR of stand- ing crops of L. danicus was 14.2% (Fig. 5). The standing crops of Pseudo-nitzschia seriata ranged from 0 to 5.2×10⁴ (mean 1.0×10⁴) cells L-1at intake and from 0 to 7.6×10⁴ (mean 1.1×10⁴) cells L-1at outlet. The standing crops of P. seriata were slightly reduced and the mean decrease was 1.8×10³ cells L-1. So the mean FR of standing crops of P.
seriata was 26.9% (Fig. 5). The standing crops of Skeleto-
80.0
60.0
40.0
20.0
0.0
-20.0
-40.0
100.0
50.0
0.0
-50.0
-100.0
-150.0
Fluctuation rates(%)Fluctuation rates(%)
(A)
(B)
’06.7 ’06.8 ’06.9 ’06.10 ’06.11 ’06.12 ’07.1 ’07.3 ’07.4 ’07.5 ’07.6 ’07.7 ’07.11 ’07.12 ’08.2 ’08.3 ’08.4 ’08.6
’06.7 ’06.8 ’06.9 ’06.10 ’06.11 ’06.12 ’07.1 ’07.3 ’07.4 ’07.5 ’07.6 ’07.7 ’07.11 ’07.12 ’08.2 ’08.3 ’08.4 ’08.6
Microplankton Nanoplankton Total phytoplankton
Diatoms Dinoflagellates
Fig. 3. Changes in FR of microplankton, nanoplankton, total phytoplankton, diatoms and dinoflagellates by PTCS of Wolsong NPP from July 2006 to June 2008.
Fig. 4. Seasonal changes in FR of microplankton, nanoplankton, diatoms and dinoflagellates by PTCS of Wolsong NPP from July 2006 to June 2008.
50.0
40.0
30.0
20.0
10.0
0.0
-10.0 Microplankton Nanoplankton Diatoms Dinoflagellates
Mean fluctuation rate(%)
Winter Summer Spring Autumn
nema costatum-like species ranged from 0 to 1.5×10⁴(mean 4.9×10³) cells L-1at intake and from 0 to 1.6×10⁴(mean 4.2×10³) cells L-1at outlet. So the FR of S. costatum-like species was -142.7~100.0 (mean 14.0%) (Fig. 5). The
standing crops of Thalassiosira decipiens ranged from 5.2
×103 cells L-1 to 3.0×10⁶(mean 5.6×10⁴) cells L-1at intake and from 4.4×10³ cells L-1to 1.8×10⁵(mean 5.1×
104) cells L-1at outlet. The standing crops of T. decipiens Fig. 5. Changes in FR of major species by PTCS of Wolsong NPP from July 2006 to June 2008.
100.0 80.0 60.0 40.0 20.0 0.0 -20.0 -40.0 -60.0 -80.0 -100.0
120.0 90.0 60.0 30.0 0.0 -30.0 -60.0 -90.0 -120.0 -150.0 -180.0 -210.0 100.0
80.0
60.0
40.0
20.0
0.0
-20.0 100.0
50.0
0.0
-50.0
-100.0
100.0
50.0
0.0
-50.0
-100.0
-150.0 100.0
50.0
0.0
-50.0
-100.0
-150.0
-200.0
-250.0
’06.7 ’06.8 ’06.9 ’06.10 ’07.1 ’07.3 ’07.5 ’07.6 ’07.7 ’07.11 ’07.12 ’08.2 ’08.4 ’08.6
’06.7 ’06.8 ’06.9 ’06.10 ’06.11 ’06.12 ’07.1 ’07.3 ’07.4 ’07.5 ’07.7 ’07.11 ’07.12 ’08.2 ’08.3 ’08.4 ’08.6
’06.7 ’06.9 ’07.1 ’07.3 ’07.4 ’08.2 ’08.3 ’06.8 ’06.9 ’06.12 ’07.1 ’07.3 ’07.4 ’07.11 ’07.12 ’08.2 ’08.3 ’08.4
’06.7 ’06.8 ’06.9 ’06.10 ’06.11 ’06.12 ’07.1 ’07.3 ’07.4 ’07.5 ’07.6 ’07.7 ’07.11 ’07.12 ’08.2 ’08.3 ’08.4 ’08.6
’06.7 ’06.8 ’06.9 ’06.10 ’06.11 ’07.1 ’07.3 ’07.4 ’07.5 ’07.6 ’07.7 ’07.11 ’07.12 ’08.2 ’08.3 ’08.4 ’06.7 ’06.8 ’06.9 ’06.10 ’06.11 ’06.12 ’07.1 ’07.3 ’07.4 ’07.5 ’07.6 ’07.7 ’07.11 ’07.12 ’08.2 ’08.3 ’08.4 ’08.6
Leptocylindrus danicus
Pseudo-nitzschia seriata Chaetoceros socialis
Chaetoceros debilis Thalassiosira decipiens
Skeletonema costatum-like species
Prorocentrum sp.
100.0
50.0
0.0
-50.0
-100.0
-150.0
-200.0
Fluctuation rates(%)Fluctuation rates(%)Fluctuation rates(%)Fluctuation rates(%) Fluctuation rates(%)Fluctuation rates(%)Fluctuation rates(%)
were reduced the amount of mean decrease was 5.3×10³ cells L-1. So the mean FR of standing crops of T. decipiens was 9.5% (Fig. 5). The standing crops of Prorocentrum sp.
ranged from 5.4×10²to 4.2×10⁴(mean 1.2×10⁴) cells L-1 at intake and from 5.4×10² cells L-1to 2.3×10⁴(mean 8.5
×103) cells L-1at outlet. The mean decrease of Prorocen- trum sp. was 3,983 cells L-1. So the mean FR of standing crops of Prorocentrum sp. was 31.8% (Fig. 5).
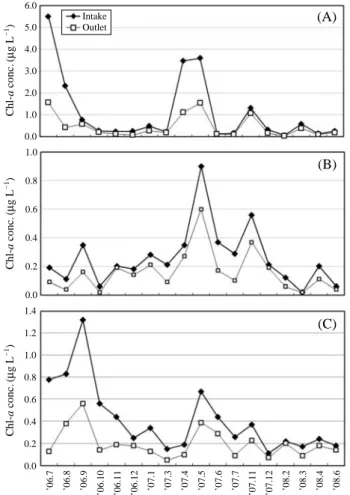
4. FR of chlorophyll a concentrations by PTCS The chlorophyll a concentrations of phytoplankton were compared in the samples of the intake and outlet of Wolsong NPP. The total chlorophyll a concentrations ranged from 0.40μg L-1to 6.47 (mean 1.79)μg L-1at intake and from 0.30μg L-1to 2.54 (mean 0.82)μg L-1at outlet. The amount of mean decrease of chlorophyll a concentrations was 0.97 μg L-1. So the FR of total chlorophyll a concentrations was 25.0~74.0 (mean 54.4)%. There were markedly reduced in
July (72.5%) and August (74.0%) 2006 and April 2007 (63.2%) (Fig. 7).
The chlorophyll a concentrations of microplankton ranged from 0.06μg L-1to 5.50 (mean 1.12)μg L-1at intake and from 0.04μg L-1to 1.56 (mean 0.46)μg L-1at the outlet (Fig. 6A). The amount of mean decrease in chlorophyll a concentrations was 0.66μg L-1. So the FR of chlorophyll a concentrations of microplankton was 7.7~81.5 (mean 58.9)%
(Fig. 7A). They were markedly reduced in July (71.6%), August (81.5%), and December (68.0%) 2006 and April 2007 (68.1%). But, there was little difference in FR between intake and outlet in March (9.5%) and June (7.7%) 2007.
The chlorophyll a concentrations of nanoplankton ranged from 0.02μg L-1to 0.90 (mean 0.26)μg L-1at intake and from 0.02μg L-1to 0.60 (mean 0.16)μg L-1at outlet (Fig.
6B). The amount of mean decrease in chlorophyll a concen- trations was 0.10μg L-1. So the FR of chlorophyll a concen- trations of nanoplankton was 0.0~66.7 (mean 38.5)% (Fig.
7A). They were markedly reduced in August (63.6%) and October (66.7%) 2006, and July 2007 (65.5%). But, there was little difference in FR between intake and outlet in June 2006 (5.0%), December 2007 (9.5%), and March 2008 (0.0%) (Fig. 7).
Fig. 6. Changes in chlorophyll a concentrations of microplankton (A), nanoplankton (B) and picoplankton (C) at intake and outlet of Wolsong NPP from July 2006 to June 2008.
6.0
5.0
4.0
3.0
2.0
1.0
0.0 1.0
0.8
0.6
0.4
0.2
0.0 1.4
1.2
1.0
0.8
0.6
0.4
0.2
0.0
Chl-aconc.(μg L-1)Chl-aconc.(μg L-1)Chl-aconc.(μg L-1) ’06.7 ’06.8 ’06.9 ’06.10 ’06.11 ’06.12 ’07.1 ’07.3 ’07.4 ’07.5 ’07.6 ’07.7 ’07.11 ’07.12 ’08.2 ’08.3 ’08.4 ’08.6
(A)
(B)
(C)
Intake Outlet
Fig. 7. The yearly (A) and seasonal (B) changes in FR of chloro- phyll a concentrations by PTCS of Wolsong NPP from July 2006 to June 2008.
100.0
80.0
60.0
40.0
20.0
0.0
70.0
60.0
50.0
40.0
30.0
20.0
Winter Spring Summer Autumn
Fluctuation rates(%)Mean fluctuation rates(%) ’06.7 ’06.8 ’06.9 ’06.10 ’06.11 ’06.12 ’07.1 ’07.3 ’07.4 ’07.5 ’07.6 ’07.7 ’07.11 ’07.12 ’08.2 ’08.3 ’08.4 ’08.6
(A)
(B)
Microplankton Nanoplankton Picoplankton Total phytoplankton
Microplankton Nanoplankton Picoplankton
On the other hand, the chlorophyll a concentrations of picoplankton ranged from 0.11μg L-1to 1.32 (mean 0.42) μg L-1at intake and from 0.05μg L-1to 0.56 (mean 0.26) μg L-1at outlet (Fig. 6C). The amount of mean decrease in chlorophyll a concentrations was 0.22μg L-1. So the FR of chlorophyll a concentrations of picplankton was 9.1~83.3 (mean 52.4)% (Fig. 7). They were markedly reduced in July (83.3%), October 2006 (75.0%), and January (61.8%), March (66.7%) 2007. But, there was little difference in FR between intake and outlet in February 2008 (9.1%) (Fig. 7A).
Accordingly, the mean decrement in total chlorophyll a concentrations was 54.4%. The mean decrement of chloro- phyll a concentrations of microplankton was at 58.9% and higher than that of nanoplankton (38.5%) and picoplankton (52.4%). These results showed that the entrainment effects on microplankton by PTCS were higher than those of nano- plankton and picoplankton. The seasonal changes in FR of total chlorophyll a concentrations ranged from 36.4% (in winter season) to 62.8% (in summer season) (Fig. 7B). The FR of chlorophyll a concentrations of microplankton, nano- plankton and picoplankton ranged from 29.3% to 52.3%, ranged from 33.0% to 59.0% and ranged from 34.1% to 65.1%, respectively. Our results showed that the entrainment effects on chlorophyll a concentrations were the highest in summer when the ambient seawater temperature was high (¤20�C) (Fig. 7B).
5. FR of the carbon assimilation number
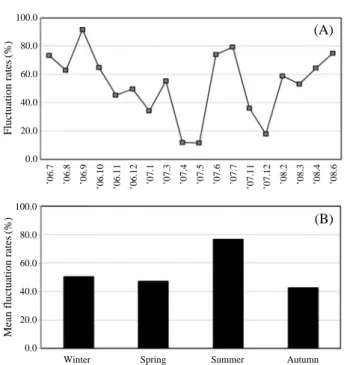
The carbon assimilation number of phytoplankton ranged from 2.6 to 48.1 (mean 14.4) mgC chl a-1hr-1at intake and from 1.5 to 30.6 (mean 6.1) mgC chl a-1hr-1at outlet during the survey periods (Fig. 8). The FR of carbon assimilation
number of phytoplankton was 11.8~91.6 (mean 57.6%) (Fig. 9A). They were markedly reductions in July (73.5%), and September (91.6%) 2006, June (74.0%) and July (79.3%) 2007, and June 2008 (75.1%). So the seasonal changes in FR of carbon assimilation number were 50.6%, 47.5%, 76.8%
and 42.9% in winter, spring, summer and autumn, respec- tively (Fig. 9B). Our results showed that the entrainment effects on carbon assimilation number were the highest in summer.
DISCUSSION
The mean decrement of standing crops of total phytoplank- ton, microplankton, and nanoplankton by PTCS was 27.0%, 34.1% and 12.4%, respectively. The mean decrement of standing crops of diatoms and dinoflagellates was 33.9%
and 29.7%, respectively. The decrease of diatoms abundances by PTCS was higher than those of dinoflagellates. So, the diatoms are very sensitive to temperature rise in comparison with members of Dinophyceae and Chlorophyceae. There- fore, it is considered that the sudden temperature rise may have a strong effect on diatoms (Hirayama and Hirano 1970;
Carpenter 1973).
In this study, the diatom C. debilis, C. socialis, L. danicus, Fig. 8. Changes in carbon assimilation number of phytoplankton at
intake and outlet of Wolsong NPP during July 2006~June 2008.
60.0
50.0
40.0
30.0
20.0
10.0
0.0
Carbon assimilation numbers (mgC chl a-1hr-1) ’06.7 ’06.8 ’06.9 ’06.10 ’06.11 ’06.12 ’07.1 ’07.3 ’07.4 ’07.5 ’07.6 ’07.7 ’07.11 ’07.12 ’08.2 ’08.3 ’08.4 ’08.6
Intake Outlet
Fig. 9. The yearly (A) and seasonal (B) changes in FR of carbon assimilation number by PTCS of Wolsong NPP from July 2006 to June 2008.
100.0
80.0
60.0
40.0
20.0
0.0
100.0
80.0
60.0
40.0
20.0
0.0
Fluctuation rates(%)Mean fluctuation rates(%) ’06.7 ’06.8 ’06.9 ’06.10 ’06.11 ’06.12 ’07.1 ’07.3 ’07.4 ’07.5 ’07.6 ’07.7 ’07.11 ’07.12 ’08.2 ’08.3 ’08.4 ’08.6
Winter Spring Summer Autumn
(A)
(B)
P. seriata, S. costatum-like species, T. decipiens and dino- flagellate Prorocemtrum sp. were major species. Among them, the decrement of the standing crops of C. socialis by PTCS was higher than that of other species, but the decre- ment of T. decipiens was lower than that of other species.
Hirayama and Hirano (1970) reported that the growth of S.
costatum was affected by high temperature at 35�C, and is completely damaged by exposure to 37�C, whereas Chlamy- domonas sp. was affected by high temperature at 43�C, in laboratory experiments. S. costatum, therefore, was more sensitive to high temperature than Chlamydomonas sp. They concluded that high temperature and residual chlorine efflu- ents from a power plant discharging into the open sea, should not cause great damage to marine phytoplankton. Among the major species, the decrement of standing crops of C.
socialis was higher than that of other species. The standing crops of major species by PTCS, however, were reduced or increased irregularly, according to survey time. Our results showed that all the phytoplankton species, including the major species which were observed generally throughout the year, by PTCS clearly were affected. FR them, by the way, after PTCS was variable. These results indicated that the all phytoplankton species responded differently to opera- tion conditions of power plant such as elevated temperature, chlorination, and mechanical impacts.
The mean decrement of chlorophyll a concentrations of size-fractionated class (microplankton, nanoplankton and picoplankton) by PTCS was 58.9%, 38.5% and 52.4%, res- pectively. Our results showed that the microplankton (¤20 μm) were more sensitive than nanoplankton (5~20 μm) and picoplankton (⁄5μm). The seasonal variations of the mean decrement of chlorophyll a concentrations were 36.4~
62.6%. The highest value of decrement was observed in sum- mer when the ambient temperature of seawater was high but the lowest value of it was observed in winter.
The comparisons of the entrainment effects on phyto- plankton by PTCS at power plants in variable sites are in Table 2. Fox and Moyer (1973) reported that the decrement of chlorophyll a concentrations at Florida power plant was variable. Takesue and Tsuruta (1978) reported that the decre- ment of chlorophyll a concentrations at Owase-Mita power plant was 71.0~77.0% in August and 31.0~46.0% in Janu- ary. KEPCO (2010) reported that the decrement of chloro- phyll a concentrations at Younggwang nuclear power plant was at a mean of 33.6%. The decrement of phytoplankton
carbon assimilation number was 11.8~91.6 (mean 57.6%).
The seasonal variations of it were 42.9 (in winter)~76.8%
(in summer). So, there were marked reductions of carbon assimilation number in summer. Hamilton et al. (1970) show- ed that increased water temperature as having an effect on the marine organisms present. Effects are most profound immediately following heat exposure and their severity seems to be proportional to the temperature of the intake water. He reported the decrease of primary productivity was 50.5~
91.3% at Chalk point, USA. Fox and Moyer (1975) reported the primary productivity dropped an average of 25.9% at Florida power plant. Flemer and Sherk Jr. (1977) reported that photosynthetic rates didn’t change at 18~19�C but dropped an average 58% at 26�C in Vienna stream station.
Takesue and Tsuruta (1978) reported that the depression of photosynthetic activity at Owase-Mita power plant was 71~ 77% in August and 31~46% in January. Yeo and Kim (1998) reported that the decrease of chlorophyll a concentra- tions after entrainment was 20.8~59.0 (mean 37.1%) in Kori nuclear power plant and was 15.5~34.9 (mean 25.0%) in Seocheon thermal plant. Choi et al. (2004) analyzed on the pigment composition of phytoplankton assemblages using HPLC at four NPPs in Korea in April 2004 and they report- ed the concentrations of chlorophyll a decreased 9.7% and 86.5% in Younggwang and Wolsong NPP, respectively but increased to 130.3% and 85.0% in Kori and Ulchin NPP, respectively. They, therefore, indicated that the entrainment effects on the biomass of phytoplankton varied considerably and were site-specific. KEPCO (2010) reported that the pri- mary productivity of phytoplankton dropped an average of 32.1% at Younggwang NPP. Previous studies showed that the entrainment effects on phytoplankton communities were highly variable because the phytoplankton species respond- ed differently to various parameters such as elevated tempe- rature, chlorination, and mechanical impact.
The sampling effort required to measure effects to statis- tically acceptable criterion in receiving waters is immense.
In a detailed study at the Millstone power station, it was found that although 80~100% of the primary productivity was suppressed during PTCS, no significant differences could be detected between mixing zone and control areas.
The authors concluded that 88 samples were required at each station to detect a plus or minus 5% change in produc- tivity. Detecting a 10% change would require 22 samples at each station, a 20% change in six samples. The general
interpretation of field data on phytoplankton and compari- sons of different site studies require some caution. Three main problems arise: (1) differences in sampling methods and locations in relation to the design and configuration of the cooling system. Sampling difficulties become formi-
dable when the problem of power plant effects is viewed in terms of field studies. In this regard, Carpenter et al. (1974) considered the effect of ‘patchiness’ in the vicinity of a power plant and determined the number of samples required for a given level of precision. Other considerations that effect Table 2. Comparisons of the entrainment effects on phytoplankton by PTCS of power plant in variable sites
Sites Results Authors
Chalk point Primary productivity Hamilton et al. (1970)
∙Cl2(0.05~0.40 ppm): decrease of 50.5~91.3%
∙no Cl2injection: decrease of 30.5%
Miquel sea water (Lab.) Chlamydomonas sp.: no effect at 43�C, 20.0 ppm Hirayama and Hirano (1970) Skeletonema costatum: dead at 35�C, 1.5~2.3 ppm
Allens King power plant O2concentrations Brook and Baker (1972)
∙Cl2injection: decrease of 57%
∙ΔT: no effect
Long Island Sound Primary productivity Carpenter et al. (1972)
∙Cl2(1.2 ppm): decrease of 83%, Cl2(0.1 ppm): decrease of 79%
∙no Cl2injection: no changes
∙no Cl2injection: increase of 11.0~14.0% (only winter season)
Florida power plant Primary productivity: decrease of avg. 25.9% Fox and Moyer (1973) Chlorophyll a conc.: variables
Very small increase at ATP and bacteria
Florida power plant Primary productivity Fox and Moyer (1975)
∙Cl2injection: decrease of 57%
∙no Cl2injection: decrease of 13%
Alamitos & Haynes power plant Abundances (total decrease of 41.7%) Briand (1975)
∙diatoms: decrease of 45.7%
∙dinoflagellates: decrease of 32.8%
Chalk point Ambient water temperature Flemer and Sherk Jr. (1977)
∙at 28�C: high decrease of photosynthetic rates
Vienna stream station Ambient water temperature Flemer and Sherk Jr. (1977)
∙at 18~19�C: no change of photosynthetic rates
∙at 26�C: decrease of 58% at photosynthetic rates
Morgantown power plant Ambient water temperature Flemer and Sherk Jr. (1977)
∙at 24�C: decrease of standing crops and photosynthetic rates
Owase-Mita power plant Chlorophyll a conc.: Takesue and Tsuruta (1978)
∙decrease of 71~77% (Aug.) and 31~46% (Jan.) Primary productivity:
∙decrease of 32% (Aug), 11% (Nov.) and 15% (Jan.)
∙no change: on December
Power plant Chlorophyll a conc. Yeo and Kim (1998)
∙Kori NP P (’96): decrease of 20.8~59.0 (mean 37.1)%
∙Seocheon TP (’94~’95): decrease of 15.5~34.9 (mean 25.0)%
Nuclear power plant Chlorophyll a conc. (April 2004): site-specific Choi et al. (2004)
∙Kori/Ulchin: increase of 130.1%/85.0%, respectively
∙Wolsong/Younggwang: decrease of 86.5%/9.7%, respectively
Younggwang NPP Primary productivity: mean decrease of 32.1% KEPCO (2010) Total chlorophyll a conc.: mean decrease of 34.6%
Wolsong NPP Total standing crops: mean decrease of 27.0% Present
∙micro-/nanoplankton: decrease of 34.1% and 12.4%
∙diatoms/dinoflagellates: decrease of 33.9% and 29.7%
Total chlorophyll a conc.: mean decrease of 54.4%
∙microplankton (58.9%), nanoplankton (38.5%), picoplankton (52.4%) Carbon assimilation number
∙decrease of 12.1~91.6 (mean 57.6)%
evaluation of baseline information in power plant studies are the variable distribution from year to year of the phyto- plankton biomass and species composition; (2) differences in the methods of incubation and temperatures; and (3) whether the sampling intensity is adequate for correct statistical treat- ment, particularly for separating out such factors as spatial and temporal heterogeneity (Langford 1990).
In the cooling system of a thermal/nuclear power plant, phytoplankton would severely be damaged both by tempera- ture rise in the condenser and by mechanical destruction and by chlorination. When they are subjected to heat shock alone, the impairment of photosynthesis would be temporary and the recovery would take place. In the thermal effluent water, however, the additional factors of mechanical stress and chlorination cannot be overlooked. Harmful effects of the cooling system on phytoplankton seem not always to be temporary. We point out the effect of mechanical stress and chlorination shock on phytoplankton and the recovery of photosynthetic activity by passage through the cooling sys- tems are subjects for further detailed study.
REFERENCES
Briand FJ-P. 1975. Effects of power plant cooling systems on marine phytoplankton. Mar. Biol. 33:135-146.
Brook AJ and AL Baker. 1972. Chlorination at power plants:
impact on phytoplankton productivity. Science 176:1414- 1415.
Carpenter EJ, BB Peck and SJ Anderson. 1972. Cooling water chlorination and productivity of entrained phytoplankton.
Mar. Biol. 16:37-40.
Carpenter EJ. 1973. Brackish-water phytoplankton response to temperature elevation. Est. Coastal Mar. Sci. 1:37-44.
Carpenter EJ, SJ Anderson and BB Peck. 1974. Copepod and chlorophyll-a concentration in receiving water of a nuclear power station and problems associated with their measure- ments. Est. Coastal Mar. Sci. 2:83-88.
Choi HC, YS Kang, JK Choi, TY Song and MH Yoo. 2004.
Analysis on the pigment composition of phytoplankton assemblages using HPLC (High Performance Liquid Chro- matography) in the adjacent waters of nuclear power plants in spring. J. Korean Soc. Oceanogr. 39:234-242.
Dunstall TG. 1985. Effects of entrainment on phytoplankton primary production at four thermal electric generating sta- tions on the Laurentian Great Lakes. Rev. Gesamten. Hyd- robiol. 70:247-257.
Flemer D and JA Sherk Jr. 1977. The effects of steam electric
station operation on entrained phytoplankton. Hydrobiolo- gia 55:33-44.
Fox JL and MS Moyer. 1973. Some effect of power plant chlo- rination on marine microbiota. Chesap. Sci. 14:1-10.
Fox JL and MS Moyer. 1975. Effect of power plant chlorina- tion on estuarine productivity. Chesap. Sci. 16:66-68.
Goldman JC and HL Quinby. 1979. Phytoplankton recovery after power plant entrainment. J. Water Poll. Control Fed.
51:1818-1823.
Hamilton DA Jr., DA Flemer, CV Keefe and JA Mihursky.
1970. Power plants: effects of chlorination on estuarine primary production. Science 169:197-198.
Hirayama K and R Hirano. 1970. Influence of high temperature and residual chlorine on marine phytoplankton. Mar. Biol.
7:205-213.
Kang YS. 2008. Characteristics of phytoplankton communities in the coastal waters of power plant. Algae 23:31-52.
Kang YS and JK Choi. 2001. Ecological characteristics of phy- toplankton communities in the coastal waters of Gori, Wulseong, Uljin and Youngkwang I. Species composition and distritution (1992~1996). Algae 16:85-111.
Kang YS and JK Choi. 2002. Ecological characteristics of phy- toplankton communities in the coastal waters of Gori, Wulseong, Uljin and Youngkwang II. Distributions of standing crops and envrionmental variables (1992~1996).
J. Korean Soc. Oceanogr. 26:77-82.
Kang YS, JK Choi and HM Eum. 2003. Ecological character- istics of phytoplankton communities in the coastal waters of Gori, Wulseong, Uljin and Youngkwang III. Distribution of dominat species and environmental variables. Algae 18:
29-47.
KEPCO (Korea Electric Power Corporation). 2010. Environ- mental survey and assessment around the Younggwang nuclear power plant (2007~2009). 405p.
Langford TEL. 1990. Ecological effects of thermal discharges.
London: Elsevier Applied Science. 468p.
Lee JH and EH Lee. 1997. Seasonal varinations of phytoplank- ton communities in the vicinity of thermal power plants (Boryung and Seochon). Algae 12:105-115.
Morgan RP and RD Stross. 1969. Destruction of phytoplankton in the cooling water supply of a steam electric station.
Chesap. Sci. 10:165-171.
Parsons TR, Y Maita and CM Lalli. 1984. A manual of chemi- cal and biological methods for seawater anaylysis. Perga- mon Press. 173p.
Suresh K, MS Ahamed, G Durairaj and KVK Nair. 1995. Envi- ronmental physiology of the mole crab Emerita asiatica, at a power plant discharge area on the east coast of India.
Environ. Pollut. 17:161-165.
Takesue K and A Tsuruta. 1978. The thermal effects of cooling
system of a thermal power plant on photosynthesis of marine phytoplankton. J. Oceanogr. Soc. Japan 34:295-302.
Warinner JB and ML Brehmer. 1966. The effects of thermal effluents on marine organisms. Int. J. Air Wat. Pollut. 10:
277-289.
Yeo HG and JH Shim. 1992. Ecological effects of thermal efflu- ents in the Korean coastal waters III. Abiotic environmen- tal and the community structure of primary producers in the vicinity of Kori nuclear power plant. Korean J. Environ.
Biol. 11:124-130.
Yeo HG and MK Kim. 1998. The effect of phytoplankton pass- ed through the cooling systems of nuclear power plant and thermoelectric power plant. Korean J. Environ. Biol. 16:101- 105.
Yi SK and P Chin. 1987. Effects of cooling water system of power plant on marine organisms I. Effects on primary production. Bull. Korean Fish. Soc. 20:381-390.
Received: 7 May 2012 Revised: 27 August 2012 Revision accepted: 27 August 2012