Development and Validation of Deep-Learning Algorithm for Electrocardiography-Based Heart Failure Identification
11
0
0
전체 글
(2) Deep-Learning for Heart Failure Diagnosis. Sung-Min Lim https://orcid.org/0000-0003-4833-4440 Pil Sang Song https://orcid.org/0000-0001-6427-3911 Jinsik Park https://orcid.org/0000-0002-6583-9769 Rak Kyeong Choi https://orcid.org/0000-0001-7432-1390 Byung-Hee Oh https://orcid.org/0000-0002-9945-4306 Conflict of Interest The authors have no financial conflicts of interest. Author Contributions Conceptualization: Kwon JM, Jeon KH, Park J; Data curation: Kwon JM, Jeon KH, Kim KH, Kim HM, Kim MJ, Lim SM, Song PS, Park J, Oh BH; Formal analysis: Kwon JM, Jeon KH, Kim MJ, Lim SM, Choi RK; Investigation: Kwon JM; Methodology: Kwon JM, Jeon KH, Kim KH, Kim MJ, Choi RK; Project administration: Kwon JM; Resources: Kwon JM; Software: Kwon JM; Supervision: Kwon JM, Kim KH; Validation: Kwon JM, Jeon KH, Kim KH; Visualization: Kwon JM; Writing - original draft: Kwon JM, Kim KH; Writing - review & editing: Kwon JM, Kim KH, Kim HM, Lim SM, Song PS, Park J, Oh BH.. INTRODUCTION Heart failure (HF) has a prevalence as high as 2% of adults overall (8% of adults aged≥75 years), affecting 26 million patients worldwide and 3.5 million new patients every year.1) It is a critical disease, with 17–45% of patients admitted for HF dying within 1 year and the majority of the remaining patients dying within 5 years.2) Patients with HF have reduced physical activity, and many are hospitalized repeatedly, leading to deterioration of quality of life and great expense. The cost of treatment for patients with HF accounts for 2% of total health care expenses and is expected to double by 2030 due to population aging.3) Various methods are used for the diagnosis of HF. These methods, however, require a physical examination, echocardiography, and laboratory tests, as well as a high level of expertise for interpretation of results and making a diagnosis.4) Furthermore, existing methods are fixed tools that do not account for the relationships among variables and thus provide limited performance.5)6) For these reasons, existing screening and early diagnosis strategies for HF are limited in value. Electrocardiography (ECG) is non-invasive and simple to perform and is widely used as part of a general check-up. The ability to identify HF using only demographic factors and ECG could be used for early diagnosis and would enable referral for further investigation. A previous study showed a significant association between HF and ECG features.7) However, statistical limitations associated with logistic regression (LR) analysis prevented researchers from developing a predictive model for HF using ECG. Several attempts have now been made to develop a predictive model for HF using machine-learning.8-10) To achieve high accuracy with limited information, we used deep-learning techniques to develop a diagnostic algorithm. Deep-learning technique has achieved state-of-art performance in several medical domains, such as image detection and clinical outcome prediction.11-13) An advantage of deeplearning technique is the automatic-learning feature and ability to identify associations using available data.14) This study developed and validated a deep-learning algorithm for ECG-based HF identification (DEHF).. METHODS Study population We performed a multicenter retrospective cohort study involving 2 hospitals. The study subjects were ECGs of adult (aged≥18 years) patients who had undergone echocardiography within 4 weeks. We excluded patients with missing values (Figure 1). The Sejong General Hospital Institutional Review Board (IRB) (No. 2018-0384) and Mediplex Sejong Hospital IRB (No. 2018-024) approved this study protocol and waived the need for informed consent due to impracticality and minimal harm. We excluded subjects with missing demographic and echocardiographic information.. Data management The characteristics of both hospitals were different (hospital A: a cardiovascular teaching hospital, hospital B: a community general hospital). Data from hospital A (October 2016–July 2018) were split into algorithm derivation and internal validation data by randomization. Data from hospital B (March 2017–July 2018) were only used for external validation. The derivation data were used to develop the deep-learning algorithm, DEHF. We evaluated the https://e-kcj.org. https://doi.org/10.4070/kcj.2018.0446. 630.
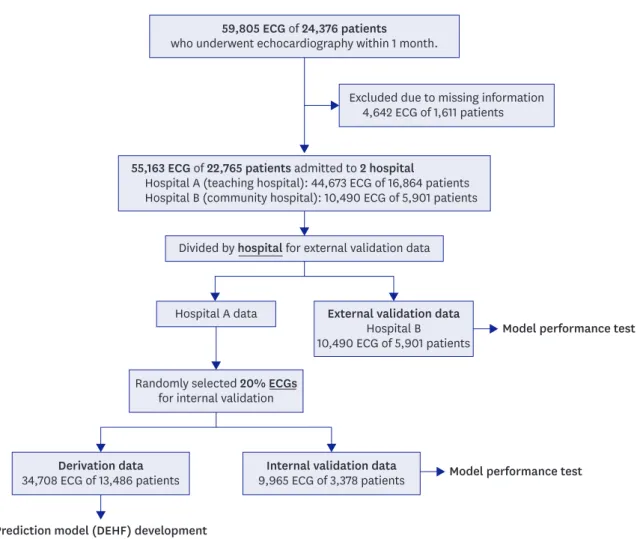
(3) Deep-Learning for Heart Failure Diagnosis. 59,805 ECG of 24,376 patients who underwent echocardiography within 1 month.. Excluded due to missing information 4,642 ECG of 1,611 patients. 55,163 ECG of 22,765 patients admitted to 2 hospital Hospital A (teaching hospital): 44,673 ECG of 16,864 patients Hospital B (community hospital): 10,490 ECG of 5,901 patients Divided by hospital for external validation data. External validation data Hospital B 10,490 ECG of 5,901 patients. Hospital A data. Model performance test. Randomly selected 20% ECGs for internal validation. Derivation data 34,708 ECG of 13,486 patients. Internal validation data 9,965 ECG of 3,378 patients. Model performance test. Prediction model (DEHF) development Figure 1. Study flow chart. DEHF = deep-learning algorithm for electrocardiography-based heart failure identification; ECG = electrocardiography.. accuracy of the algorithm using internal validation data that were not used for algorithm derivation. Furthermore, we used external validation data from hospital B to verify that the algorithm was applicable across centers. The primary endpoint was detection of HF with reduced ejection fraction (HFrEF), defined as ≤40% on echocardiography.4) The secondary endpoint was detection of HF with midrange to reduced ejection fraction (EF), defined as ≤50% on echocardiography.4) We used demographic information and ECG features including age, sex, weight, height, heart rate, presence of atrial fibrillation (AF) or atrial flutter (AFL), QT interval, QRS duration, R wave axis, and T wave axis, as the predictive variables. For use of the algorithm in AF, we did not include the P wave axis or PR interval as predictive variables.. Development of deep-learning algorithm As shown in Figure 2, we developed the deep-learning algorithm, DEHF, using only derivation data. The algorithm was developed using deep neural network (DNN), a method of deep-learning with 5 hidden layers, 45 nodes, and dropout layers.15) Because there was no gain in accuracy with more than 5 layers, we used 5 to minimize the parameters to be learned. The first to fifth layers consisted of 15, 13, 11, 10, and 6 nodes, and used a rectified linear unit https://e-kcj.org. https://doi.org/10.4070/kcj.2018.0446. 631.
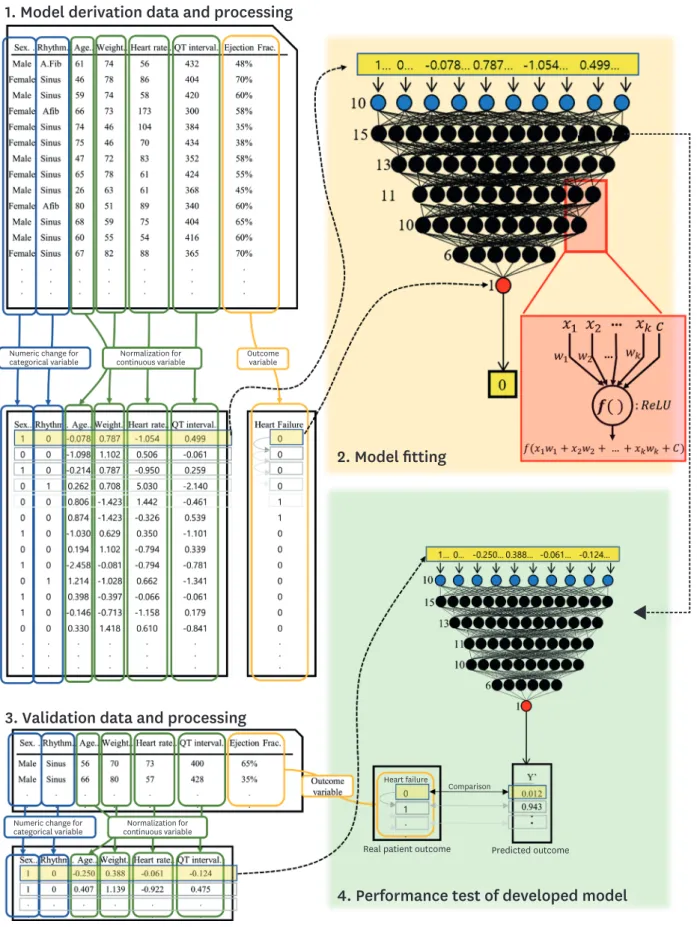
(4) Deep-Learning for Heart Failure Diagnosis. 1. Model derivation data and processing. Numeric change for categorical variable. Outcome variable. Normalization for continuous variable. 2. Model fitting. 3. Validation data and processing. Heart failure. Numeric change for categorical variable. Comparison. Normalization for continuous variable. Real patient outcome. Predicted outcome. 4. Performance test of developed model Figure 2. Development and validation of DEHF. DEHF = deep-learning algorithm for electrocardiography-based heart failure identification; ECG = electrocardiography; HF = heart failure.. https://e-kcj.org. https://doi.org/10.4070/kcj.2018.0446. 632.
(5) Deep-Learning for Heart Failure Diagnosis. as the activation function.16) The last layer consisted of 1 node, which represented the risk of each outcome and used a sigmoid function. We used TensorFlow (the Google Brain Team) as the backend.17) Furthermore, we used the Adagrad optimizer with default parameters and binary cross-entropy as the loss function. As shown in Figure 2, the value at 1 node of the DNN is added by multiplying the values from the upper layer nodes (xk) by their weights (wk). The added value, (x1+w1+x2+w2+...+xkwk+c), is processed by the activation function, and the value of f(x1+w1+x2+w2+...+xkwk+c) is sent to the next node. As shown in Figure 2, before using the derivation data for DEHF development, we replaced the values of the categorical variables with binary numeric values and normalized the value of the continuous variables.18) This data preprocessing was separately performed for the derivation, interval validation, and external validation data.18) To train the deep-learning algorithm, we input each value of the derivation data in the input layer and adjusted the weight (wk) using back propagation.18). Development of machine-learning-based algorithm for comparison We also developed LR and random forest (RF) machine-learning algorithms, for comparison of performance with the DEHF. In previous studies, LR and RF were the most commonly used machine-learning methods and showed better performance than traditional methods in several medical domains.19) We identified the best LR algorithm among all possible algorithms using the glmulti package in R (R Foundation, Vienna, Austria).20)21) We used original Akaike IC as the information criterion and used pairwise interactions. For LR algorithm selection, we used forward-backward directions. RF is used to construct a multitude of decision trees. Each decision tree partitions the sample data by splitting the variables at discrete cut-points. Each tree is derived by randomly selecting data from the derivation data, and the RF algorithm concludes with a summary result for each decision tree. In this study, the RF algorithm consisted of 10,000 decision trees using the randomForest package in R (R Foundation).21) The optimal number of variables, which were randomly sampled as candidates at each split, was determined using 10-fold cross-validation.. Validation of algorithm performance and statistical analysis After we developed the deep-learning and machine-learning algorithms, we compared their performance using the internal and external validation data that were not used for algorithm development. We used the area under the receiver operating characteristic curve (AUROC) as the comparative measure. The AUROC is a frequently used metric and the receiver operating characteristic (ROC) curve shows the sensitivity against 1-specificity. We evaluated the 95% confidence interval (CI) using bootstrapping (10,000 times resampling with replacement).22) We confirmed characteristics of the HF patient group as shown in Table 1. Continuous variables are presented as mean and standard deviation and compared using the unpaired Student's t-test or Mann-Whitney U-test. Categorical variables are expressed as frequencies and percentages and compared using the χ2 test. We confirmed the importance of variables in each developed algorithm. We confirmed the deviance difference of each predictive variable in the LR model and mean decrease in https://e-kcj.org. https://doi.org/10.4070/kcj.2018.0446. 633.
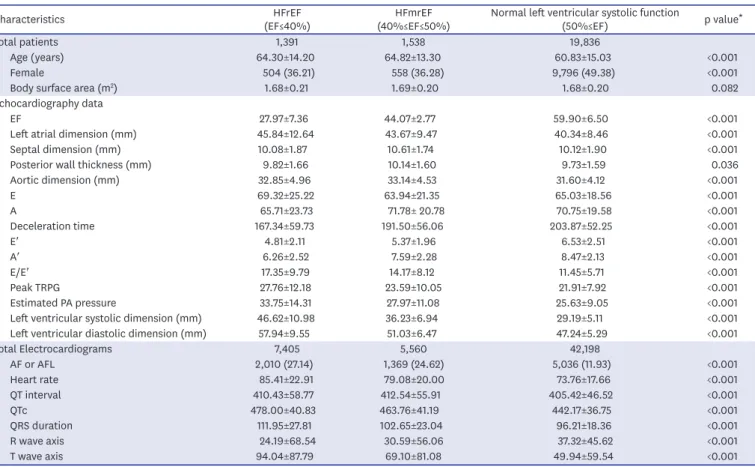
(6) Deep-Learning for Heart Failure Diagnosis. Table 1. Baseline characteristics Characteristics. HFrEF (EF≤40%) 1,391 64.30±14.20 504 (36.21) 1.68±0.21. HFmrEF (40%≤EF≤50%) 1,538 64.82±13.30 558 (36.28) 1.69±0.20. Normal left ventricular systolic function (50%≤EF) 19,836 60.83±15.03 9,796 (49.38) 1.68±0.20. p value*. Total patients Age (years) <0.001 Female <0.001 Body surface area (m2) 0.082 Echocardiography data EF 27.97±7.36 44.07±2.77 59.90±6.50 <0.001 Left atrial dimension (mm) 45.84±12.64 43.67±9.47 40.34±8.46 <0.001 Septal dimension (mm) 10.08±1.87 10.61±1.74 10.12±1.90 <0.001 Posterior wall thickness (mm) 9.82±1.66 10.14±1.60 9.73±1.59 0.036 Aortic dimension (mm) 32.85±4.96 33.14±4.53 31.60±4.12 <0.001 E 69.32±25.22 63.94±21.35 65.03±18.56 <0.001 A 65.71±23.73 71.78± 20.78 70.75±19.58 <0.001 Deceleration time 167.34±59.73 191.50±56.06 203.87±52.25 <0.001 E′ 4.81±2.11 5.37±1.96 6.53±2.51 <0.001 A′ 6.26±2.52 7.59±2.28 8.47±2.13 <0.001 E/E′ 17.35±9.79 14.17±8.12 11.45±5.71 <0.001 Peak TRPG 27.76±12.18 23.59±10.05 21.91±7.92 <0.001 Estimated PA pressure 33.75±14.31 27.97±11.08 25.63±9.05 <0.001 Left ventricular systolic dimension (mm) 46.62±10.98 36.23±6.94 29.19±5.11 <0.001 Left ventricular diastolic dimension (mm) 57.94±9.55 51.03±6.47 47.24±5.29 <0.001 Total Electrocardiograms 7,405 5,560 42,198 AF or AFL 2,010 (27.14) 1,369 (24.62) 5,036 (11.93) <0.001 Heart rate 85.41±22.91 79.08±20.00 73.76±17.66 <0.001 QT interval 410.43±58.77 412.54±55.91 405.42±46.52 <0.001 QTc 478.00±40.83 463.76±41.19 442.17±36.75 <0.001 QRS duration 111.95±27.81 102.65±23.04 96.21±18.36 <0.001 R wave axis 24.19±68.54 30.59±56.06 37.32±45.62 <0.001 T wave axis 94.04±87.79 69.10±81.08 49.94±59.54 <0.001 Data are shown as mean±standard deviation or number (%). AF = atrial fibrillation; AFL = atrial flutter; EF = ejection fraction, HFrEF = heart failure with reduced ejection fraction; HFmrEF = heart failure with mid-range ejection fraction; PA = pulmonary artery, TRPG = trans-tricuspid pressure gradient. *An alternative explanation for this p value is based on differences between the 3 groups.. Gini coefficient for each predictive variable in RF to assess the importance of the variable. For variable importance in the deep-learning model, we assessed the decrease in accuracy (AUROC) when each variable was excluded.. RESULTS We included 59,805 ECG studies of 24,376 patients with value of left ventricular systolic function confirmed on echocardiography within 4 weeks. We excluded 4,642 ECG studies of 1,611 patients with missing values. As shown in Figure 1, the study population comprised 22,765 patients, of whom 1,391 had HFrEF. Baseline characteristics of study subjects are shown in Table 1. A deep-learning predictive model was developed using 34,708 ECG studies with derivation data. The performance test was conducted using 9,965 interval validation data from hospital A and 10,790 external validation data from hospital B. We provided the deep-learning algorithm (DEHF), coding book for input data, example of input data, and python code for validation as a supplemental file to this article. As shown in Table 1, HF patients had a significantly prolonged QT interval and QRS duration, as well as a significantly greater heart rate, longer T wave duration, and significantly shorter R wave duration. HF patients also had a greater proportion with AF/AFL. https://e-kcj.org. https://doi.org/10.4070/kcj.2018.0446. 634.
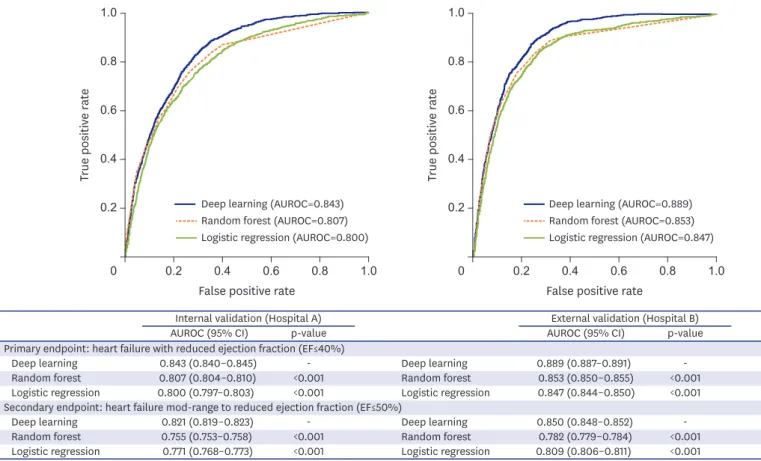
(7) Deep-Learning for Heart Failure Diagnosis. As shown in Figure 3, the ROC curve of the DEHF was above the ROC curve of the other models for the primary and secondary endpoints. This means that the DEHF is more accurate than the other models in all aspects of sensitivity and specificity. During internal validation for identification of the primary endpoint (HFrEF), the AUROC of the deeplearning algorithm, DEHF, was 0.843 (95% CI, 0.840–0.845), and this result significantly outperformed RF (0.807 [0.804–0.810]) and LR (0.800 [0.797–0.803]). In the external validation, the AUROC of the DEHF was 0.889 (0.887–0.891), and this result significantly outperformed the RF (0.853 [0.850–0.855]) and LR (0.847 [0.844–0.850]). The AUROC values of DL were significantly higher than those of RF and LR (p<0.001). At the 90% sensitivity point in external validation, the specificities of DL, RF, and LR were 0.604, 0.587, and 0.487, respectively. As shown in Figure 3, the AUROC values of DL for identification of the secondary endpoint, i.e., mid-range to reduced left ventricular EF (≤50%), were 0.821 (0.819–0.823) and 0.850 (0.848–0.852) for internal and external validation, respectively, and the AUROC value of DL was significantly higher than that of RF or LR (p<0.001).. 1.0. 1.0. 0.8. 0.8. True positive rate. True positive rate. As shown in Table 2, the variable importance was different for each prognostic model. All 3 models used T wave duration as an important predictive variable. While LR and RF used heart rate and QRS duration as important predictive variables, their importance in deep-learning is low. Instead, deep-learning used weight and presence of AF or AFL as important variables.. 0.6. 0.4 Deep learning (AUROC=0.843) Random forest (AUROC=0.807) Logistic regression (AUROC=0.800). 0.2. 0. 0.2. 0.4. 0.6. 0.8. 1.0. 0.6. 0.4 Deep learning (AUROC=0.889) Random forest (AUROC=0.853) Logistic regression (AUROC=0.847). 0.2. 0. False positive rate Internal validation (Hospital A) AUROC (95% CI) p-value Primary endpoint: heart failure with reduced ejection fraction (EF≤40%) Deep learning Deep learning 0.843 (0.840–0.845) Random forest <0.001 Random forest 0.807 (0.804–0.810) Logistic regression <0.001 0.800 (0.797–0.803) Logistic regression Secondary endpoint: heart failure mod-range to reduced ejection fraction (EF≤50%) Deep learning Deep learning 0.821 (0.819–0.823) Random forest <0.001 0.755 (0.753–0.758) Random forest Logistic regression <0.001 0.771 (0.768–0.773) Logistic regression. 0.2. 0.4. 0.6. 0.8. 1.0. False positive rate External validation (Hospital B) AUROC (95% CI) p-value 0.889 (0.887–0.891) 0.853 (0.850–0.855) 0.847 (0.844–0.850). <0.001 <0.001. 0.850 (0.848–0.852) 0.782 (0.779–0.784) 0.809 (0.806–0.811). <0.001 <0.001. Figure 3. AUROC of each algorithm for identification of HF. AUROC = area under the receiver operating characteristic curve; EF = ejection fraction; HF = heart failure; HFrEF = heart failure with reduced ejection fraction; HFmrEF = heart failure with mid-range ejection fraction.. https://e-kcj.org. https://doi.org/10.4070/kcj.2018.0446. 635.
(8) Deep-Learning for Heart Failure Diagnosis. Table 2. Importance of variables in derivation data for each algorithm LR RF Deep-learning Variable importance (deviance difference) (mean decreased Gini) (difference in AUROC) 1 Heart rate (−1,265.7) T-wave axis (777.0) T-wave axis (0.103) 2 T-wave axis (−821.7) QRS duration (416.0) Weight (0.087) 3 QRS duration (−502.6) Heart rate (299.5) AF/AFL (0.073) 4 QT interval (−323.9) R wave axis (183.4) Age (0.070) 5 Sex (−176.8) Height (76.1) Heart rate (0.069) 6 AF/AFL (−106.3) Age (65.7) QT interval (0.067) 7 R-wave axis (−30.1) QT interval (44.8) R-wave axis (0.064) 8 Weight (−29.0) AF/AFL (44.7) QRS duration (0.063) 9 Height (−2.2) Weight (40.6) Height (0.061) 10 Age (−0.4) Sex (34.4) Sex (0.055) AF = atrial fibrillation; AFL = atrial flutter; AUROC = area under the receiver operating characteristic curve; LR = logistic regression; RF = random forest.. DISCUSSION This study developed and validated a deep-learning algorithm, DEHF, for identification of HF using ECG. Through validation, this study confirmed that the performance of the deeplearning algorithm was excellent for identification of HF, with greater accuracy than that using RF or LR. HF has high prevalence, and is associated with increased health care expenses, repeated hospitalization, and significant reduction in quality of life, which may be resolved with rapid diagnosis and effective treatment. Recent guidelines from the American College of Cardiology and American Heart Association4) for the initial diagnosis of HF and referral for echocardiography recommend the use of B-type natriuretic peptide in combination with clinical assessment. These methods, however, require consultations and many tests, as well as a high level of expertise for interpretation of large amounts of complex data and determination of a treatment plan. Furthermore, existing methods are fixed tools that do not account for the relationships among variables and thus provide limited performance for early diagnosis and screening.5)6) This led to various attempts to use a new method, i.e., machine-learning, for the diagnosis of HF. Deep-learning and machine-learning are branches of artificial intelligence science, a study of algorithms that allows computers to independently collect data and make new predictions. Thus, machine-learning enables computers to establish a new predictive algorithm without direct and explicit input by a human. Son et al.23) and Masetic and Subasi24) developed machine-learning predictive algorithms based on age, sex, blood pressure, and findings of hematology; echocardiography; ECG; radiography; and physical activity in populations ranging from 15 to 4,489 patients, with an AUROC of 0.77 to 0.95 for the accuracy of HF diagnosis. Betanzos et al.25) and Isler26) developed classification algorithms based on the type of HF (HF with preserved EF, mid-range EF, and reduced EF). Melillo et al.27) developed classification algorithms based on the severity of HF. Guidi et al.28) developed a remote care system and a monitoring tool for patients with HF. Studies to date have shown potential for the diagnosis of HF; however, the fact that they use test results from various modalities limits their use for early diagnosis of HF as a screening tool. Because of this, we developed an identification algorithm using only baseline demographic information and ECG features. We used deep-learning to develop a highperformance algorithm. An important advantage of deep-learning compared with machinehttps://e-kcj.org. https://doi.org/10.4070/kcj.2018.0446. 636.
(9) Deep-Learning for Heart Failure Diagnosis. learning is feature learning.14) Machine-learning techniques are limited in their ability to process natural data in their raw form. Machine-learning requires careful engineering to design a feature extractor that transforms the raw data into suitable internal representation. This process requires a lot of manpower, and important information may be missed. On the other hand, deep-learning includes feature learning, which is a set of methods that allows a model to be created using raw data for automatic identification of the features and relationships needed to perform a task.14) It is important to note that feature learning is not designed by humans. As this process is conducted automatically, it is effective at identifying intricate structures in high-dimensional data without information loss and requires very little engineering by humans.14) Therefore, it can be quickly applied to other tasks with ease. Owing to these prospects, deep-learning has been applied in various domains, and shows better performance than all other methods.14) In general, the predictive accuracy of external validation is lower than that of internal validation. However, in the present study, the accuracy of external validation outperformed internal validation in all predictive models. As shown in the Supplementary Figure 1, hospital A (internal validation) had a greater proportion of HF patients, as well as a greater proportion of patients in bordering areas. This finding may be due to differences in the characteristics of the 2 hospitals (hospital A: a cardiovascular teaching hospital, hospital B: a community general hospital). Therefore, the task of predicting HF using internal validation might be easier than that using external validation. DEHF, LR, and RF predicted endpoints using different structures. The patients in whom each model correctly predicted the endpoints also differed. Moreover, the variable importance of DEHF is different from that of LR or RF, as shown in Table 2. For this reason, different algorithms can complement each other's weaknesses; thus, many researchers attempt to improve accuracy by combining predictive algorithms. This method, called an ensemble algorithm, is our next area of research. Several limitations were present in our study. First, deep-learning is considered a black box. Although we can fit the deep-learning algorithm by confirming each weight, we cannot interpret the algorithm in terms of the approach to the decision for a clinical endpoint. For example, if the deep-learning algorithm in this study predicts that a patient has HF, the reason for the prediction cannot be ascertained. Attempts to explain deep-learning are recent, and this will be our next area of study.29) Second, as this study was only conducted in 2 hospitals in Korea, it is necessary to validate this model in HF patients in other countries.30) For this reason, we have provided supplemental files with our deep-learning model (DEHF), data preprocessing method, and code for validation. The deep-learning algorithm can be developed more easily than a machine-learning method. Using our results, other researchers can develop algorithm for their own patients. Third, we did not use raw ECG signals but instead used features of ECG. We aimed for easy application of DEHF in local clinics and general check-ups, but this method could limit the performance of a predictive algorithm. We plan to conduct a study with raw ECG signals for prediction of HF. Despite several limitations, deep-learning has achieved high predictive performance in several medical domains. Medical researchers should investigate the applicability and future development of deep-learning in various domains of medicine. Competency in medical knowledge: this study developed and validated a DEHF. With this algorithm, we can identify HF using only demographic and ECG features. Many patients can https://e-kcj.org. https://doi.org/10.4070/kcj.2018.0446. 637.
(10) Deep-Learning for Heart Failure Diagnosis. be identified at an early stage and referred for diagnostic investigation. The deep-learning algorithm achieved state-of-the-art performance in identification of HF and outperformed other machine-learning algorithms. Translational outlook: deep-learning technology has not been widely applied in the medical field. Hence, further investigation and validation are required in various medical fields.. SUPPLEMENTARY MATERIAL Supplementary Figure 1 Distribution of EF in validation groups. Click here to view. REFERENCES 1. Ziaeian B, Fonarow GC. Epidemiology and aetiology of heart failure. Nat Rev Cardiol 2016;13:368-78. PUBMED | CROSSREF. 2. Ponikowski P, Anker SD, AlHabib KF, et al. Heart failure: preventing disease and death worldwide. ESC Heart Fail 2014;1:4-25. PUBMED | CROSSREF. 3. Ambrosy AP, Fonarow GC, Butler J, et al. The global health and economic burden of hospitalizations for heart failure: lessons learned from hospitalized heart failure registries. J Am Coll Cardiol 2014;63:1123-33. PUBMED | CROSSREF. 4. Yancy CW, Jessup M, Bozkurt B, et al. 2017 ACC/AHA/HFSA focused update of the 2013 ACCF/AHA guideline for the management of heart failure: a report of the American College of Cardiology/American Heart Association task force on clinical practice guidelines and the Heart Failure Society of America. J Am Coll Cardiol 2017;70:776-803. PUBMED | CROSSREF. 5. Bagley SC, White H, Golomb BA. Logistic regression in the medical literature: standards for use and reporting, with particular attention to one medical domain. J Clin Epidemiol 2001;54:979-85. PUBMED | CROSSREF. 6. Breiman L. Statistical modeling: the two cultures. Stat Sci 2001;16:199-215. 7. Nainwal A, Kumar Y, Jha B. Morphological changes in congestive heart failure ECG. 2nd International Conference on Advances in Computing, Communication, & Automation (ICACCA); 2016 Sep 30–Oct 1; Fri, India. Bareilly: Institute of Electrical and Electronics Engineers; 2016. 8. Hendry PB, Krisdinarti L, Erika M. Scoring system based on electrocardiogram features to predict the type of heart failure in patients with chronic heart failure. Cardiol Res 2016;7:110-6. PUBMED | CROSSREF. 9. Attia ZI, Kapa S, Lopez-Jimenez F, et al. Screening for cardiac contractile dysfunction using an artificial intelligence-enabled electrocardiogram. Nat Med 2019;25:70-4. PUBMED | CROSSREF. 10. Sengupta PP, Kulkarni H, Narula J. Prediction of abnormal myocardial relaxation from signal processed surface ECG. J Am Coll Cardiol 2018;71:1650-60. PUBMED | CROSSREF. 11. Johnson KW, Torres Soto J, Glicksberg BS, et al. Artificial intelligence in cardiology. J Am Coll Cardiol 2018;71:2668-79. PUBMED | CROSSREF. 12. Ting DS, Cheung CY, Lim G, et al. Development and validation of a deep learning system for diabetic retinopathy and related eye diseases using retinal images from multiethnic populations with diabetes. JAMA 2017;318:2211-23. PUBMED | CROSSREF. https://e-kcj.org. https://doi.org/10.4070/kcj.2018.0446. 638.
(11) Deep-Learning for Heart Failure Diagnosis. 13. Kwon JM, Lee Y, Lee Y, Lee S, Park J. An algorithm based on deep learning for predicting in-hospital cardiac arrest. J Am Heart Assoc 2018;7:e008678. PUBMED | CROSSREF. 14. LeCun Y, Bengio Y, Hinton G. Deep learning. Nature 2015;521:436-44. PUBMED | CROSSREF. 15. Pal SK, Mitra S. Multilayer perceptron, fuzzy sets, and classification. IEEE Trans Neural Netw 1992;3:683-97. PUBMED | CROSSREF. 16. Nair V, Hinton GE. Rectified linear units improve restricted Boltzmann machines. Proceedings of the 27th International Conference on Machine Learning (ICML-10); 2010 Jun 21–24; Mon, Israel. Haifa: International Machine Learning Society; 2010. 17. Abadi M, Barham P, Chen J, et al. TensorFlow: a system for large-scale machine learning. Proceedings of the 12th USENIX Symposium on Operating Systems Design and Implementation (OSDI' 16); 2016 Nov 2–4; Wen, USA. Savannah (GA): USENIX Association; 2016. 18. Jayalakshmi T, Santhakumaran A. Statistical normalization and backpropagation for classification. Int J Comput Theory Eng 2011;3:89-93. CROSSREF. 19. Shouval R, Hadanny A, Shlomo N, et al. Machine learning for prediction of 30-day mortality after ST elevation myocardial infraction: an acute coronary syndrome Israeli survey data mining study. Int J Cardiol 2017;246:7-13. PUBMED | CROSSREF. 20. Calcagno V, de Mazancourt C. Glmulti: an R package for easy automated model selection with (generalized) linear models. J Stat Softw 2010;34:1-29. CROSSREF. 21. Khalilia M, Chakraborty S, Popescu M. Predicting disease risks from highly imbalanced data using random forest. BMC Med Inform Decis Mak 2011;11:51. PUBMED | CROSSREF. 22. Carpenter J, Bithell J. Bootstrap confidence intervals: when, which, what? A practical guide for medical statisticians. Stat Med 2000;19:1141-64. PUBMED | CROSSREF. 23. Son CS, Kim YN, Kim HS, Park HS, Kim MS. Decision-making model for early diagnosis of congestive heart failure using rough set and decision tree approaches. J Biomed Inform 2012;45:999-1008. PUBMED | CROSSREF. 24. Masetic Z, Subasi A. Congestive heart failure detection using random forest classifier. Comput Methods Programs Biomed 2016;130:54-64. PUBMED | CROSSREF. 25. Alonso-Betanzos A, Bolón-Canedo V, Heyndrickx GR, Kerkhof PL. Exploring guidelines for classification of major heart failure subtypes by using machine learning. Clin Med Insights Cardiol 2015;9:57-71. PUBMED | CROSSREF. 26. Isler Y. Discrimination of systolic and diastolic dysfunctions using multi-layer perceptron in heart rate variability analysis. Comput Biol Med 2016;76:113-9. PUBMED | CROSSREF. 27. Melillo P, De Luca N, Bracale M, Pecchia L. Classification tree for risk assessment in patients suffering from congestive heart failure via long-term heart rate variability. IEEE J Biomed Health Inform 2013;17:727-33. PUBMED. 28. Guidi G, Pettenati MC, Melillo P, Iadanza E. A machine learning system to improve heart failure patient assistance. IEEE J Biomed Health Inform 2014;18:1750-6. PUBMED | CROSSREF. 29. Fong RC, Vedaldi A. Interpretable explanations of black boxes by meaningful perturbation. Proc IEEE Int Conf Comput Vis 2017;3449-57. 30. Wolpert DH. The supervised learning no-free-lunch theorems. In: Roy R, Köppen M, Ovaska S, Furuhashi T, Hoffmann F, editors. Soft Computing and Industry. London: Springer; 2002. p.25-42.. https://e-kcj.org. https://doi.org/10.4070/kcj.2018.0446. 639.
(12)
수치
관련 문서
Preliminary Study of IR Sensor Equipped Drone-based Nuclear Power Plant Diagnosis Method using Deep Learning. Ik Jae Jin and
The above-mentioned findings suggested that the learning motivation program had a good effect on enhancing the children's learning attitude and their pursuit
The study carried out small group cooperative learning as an experimental group and lecture-type learning as a control group for 12 weeks and compared
Therefore, in this study, we investigate how workplace innovation affects workers' workplace learning and corporate performance for workers engaged in
In Chapter 3, we looked at teaching and teaching models using video media, which can be the basis of the YouTube culture and learning model, and
data mining - process of applying machine learning, visualization, statistical analysis. knowledge discovery & construction - evaluation & interpretation of the extracted
If we wish to develop a learning process based on
This study aims to analyze the process and the features of corporate e-Learning as a form of informal learning. For this purpose, the concept of
