Evaluation of Renal Pathophysiological Processes Induced by an Iodinated Contrast Agent in a Diabetic Rabbit Model Using Intravoxel Incoherent Motion and Blood Oxygenation Level-Dependent Magnetic Resonance Imaging
14
0
0
전체 글
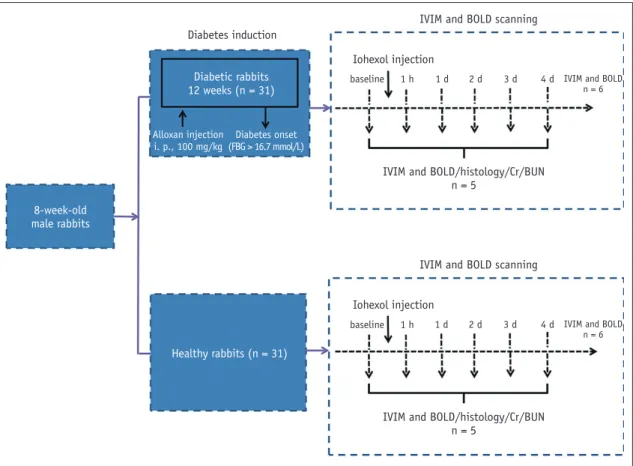
(2) IVIM, BOLD, CI-AKI, and Diabetes Mellitus. individuals (3-6). As previously reported, the rate of CI-AKI occurrence in diabetic patients could be as high as 29.4%, even in the absence of preexisting renal insufficiency (7). However, the underlying mechanism that places diabetic patients at a higher risk of CI-AKI needs to be investigated. Due to the rapid development of the functional magnetic resonance imaging (fMRI) methodology, it may be possible to acquire valuable information on the pathophysiology of CIAKI when it follows the onset of diabetes in a patient (8). Preclinical studies have demonstrated that blood oxygenation level-dependent (BOLD) imaging could serve as a reliable noninvasive method to measure the renal oxygen content in both humans and animals (9-11). In addition, intravoxel incoherent motion (IVIM) imaging could detect the diffusion of water molecules and perfusion-dependent diffusion in vivo (12-15). Previous studies have reported that a decrease in pure molecular diffusion coefficient (D), pseudo-diffusion coefficient (D*), and perfusion fraction (f) values was detected when IVIM imaging was conducted on CI-AKI rat models while an increase in apparent transverse relaxation rate (R2*) values was detected when BOLD imaging was conducted on contrast-induced rat models (12, 16).. Although the occurrence of medullary hypoxia in the kidney has been reported previously (17), the association between renal hypoxia and renal failure has not been systematically evaluated. Recent reports have demonstrated that the expression of hypoxia-inducible transcription factor1α (HIF-1α) is correlated with hypoxia in CI-AKI (17, 18), and thus may lead to an increase in the R2* value (16). In addition, accumulating evidence has shown that the overexpression of HIF-1α increases angiogenesis by inducing vascular endothelial growth factor (VEGF) expression (19, 20). It is noteworthy to mention that hypoxia is the main stimulus for HIF-1α and VEGF expression and production (21). The objective of this study was to determine whether IVIM and BOLD imaging could noninvasively identify changes in renal water diffusion, perfusion, and oxygenation during acute renal damage in diabetic rabbits after the administration of a CA. The IVIM and BOLD images were compared to detect changes in the histology and the expression of HIF-1α and VEGF at different time points after the administration of the CA.. IVIM and BOLD scanning Diabetes induction Iohexol injection Diabetic rabbits 12 weeks (n = 31). baseline. 1h. 1d. 2d. 3d. 4 d IVIM and BOLD n=6. Alloxan injection Diabetes onset i. p., 100 mg/kg (FBG > 16.7 mmol/L). IVIM and BOLD/histology/Cr/BUN n=5 8-week-old male rabbits IVIM and BOLD scanning Iohexol injection baseline. 1h. 1d. 2d. 3d. 4 d IVIM and BOLD n=6. Healthy rabbits (n = 31). IVIM and BOLD/histology/Cr/BUN n=5. Fig. 1. Experimental flow chart. BOLD = blood oxygen level-dependent, BUN = blood urea nitrogen, Cr = serum creatinine, d = day, FBG = fasting blood glucose, h = hour, IVIM = intravoxel incoherent motion. kjronline.org. https://doi.org/10.3348/kjr.2018.0757. 831.
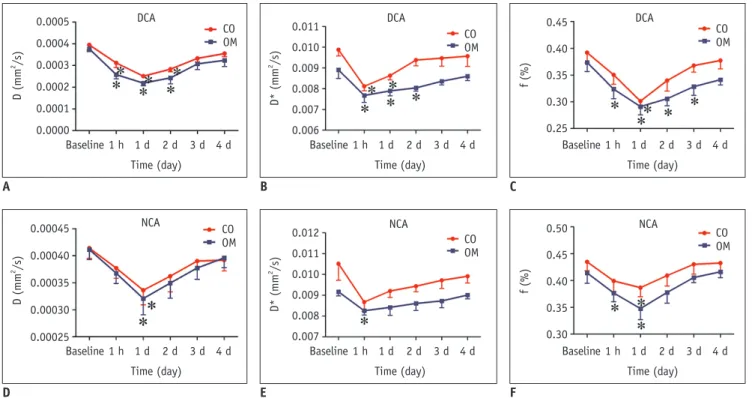
(3) Wang et al.. MATERIALS AND METHODS Establishment of the Diabetic Rabbit Model This study was approved by China Medical University and was performed in accordance with the guidelines of the institutional animal care and use committee. A total of 62 8-week-old male New Zealand white rabbits (body weight, 2.5–3.0 kg) were used. The diabetic rabbit model was established by administering a single intravenous injection of 100 mg/kg body weight of alloxan freshly dissolved in 0.9% saline after a 12-hour overnight fasting period (22). The rabbits that became diabetic (fasting blood glucose levels > 16.7 mmol/L) were used in the study 12 weeks after the administration of alloxan (22, 23). Experimental Setup Before the magnetic resonance imaging (MRI), the rabbits were anesthetized with 3% pentobarbital sodium (0.5 mL/ kg of body mass). Following this, iohexol 350 (350 mgI/mL, 830 mOsm/kg H2O; Omnipaque, GE Healthcare, Shanghai, China) that was preheated at 37°C was intravenously injected at a dose of 2.5 g I/kg body weight (24, 25). Firstly, since the intra-group comparisons of the baseline DCA. D* (mm2/s). 0.0004 0.0003 0.0002 0.0001 0.0000 Baseline 1 h 1 d. 2d. 0.010 0.008. 2d. 0.00035 0.00030 0.00025 Baseline 1 h 1 d. 2d. 0.25 Baseline 1 h 1 d. 3d 4d. 3d 4d. 2d. 3d 4d. Time (day). C 0.012. D* (mm2/s). 0.00040. 0.35. Time (day). CO OM. CO OM. 0.30. 0.007. B NCA. DCA. 0.40. 0.009. Time (day). 0.00045. 0.45. CO OM. 0.006 Baseline 1 h 1 d. 3d 4d. A. D (mm2/s). DCA. NCA. 0.50. CO OM. 0.011 0.009 0.007 Baseline 1 h 1 d. D E Fig. 2. Temporal changes in IVIM measurements in two groups.. CO OM. 0.40 0.35. 0.008. Time (day). NCA. 0.45. 0.010. f (%). D (mm2/s). 0.011. CO OM. Experimental Procedure All MRI scans were performed using a clinical 3T Twin Speed MR scanner (GE Healthcare, Milwaukee, WI, USA) with a cardiac matrix coil. The details of the sequences. f (%). 0.0005. values showed significant differences, 6 out of the 31 diabetic rabbits were imaged longitudinally before and 1 hour, 1 day, 2 days, 3 days, and 4 days after iohexol administration to investigate renal changes during CI-AKI. Then, 5 randomly selected diabetic rabbits were euthanized at the end of the study (4 days). Secondly, to validate the fMRI findings, 5 diabetic rabbits were randomly selected from the remaining rabbits for blood measurements and histological studies after MRI scanning at the 5 time points (baseline, 1 hour, 1 day, 2 days, 3 days). Meanwhile, 6 out of the 31 healthy rabbits underwent IVIM and BOLD examinations at the baseline (pre-contrast), and at 1 hour, 1 day, 2 days, 3 days, and 4 days after the iohexol administration, and 5 randomly selected rabbits were euthanized at the end of the study (4 days). The remaining animals were randomly sacrificed for further analysis after MRI scanning at the baseline, and at 1 hour, 1 day, 2 days, and 3 days (n = 5 each) (Fig. 1).. 2d. 0.30 Baseline 1 h 1 d. 3d 4d. Time (day). 2d. 3d 4d. Time (day). F. (A-C) DCA group, (D-F) NCA group. Serially measured parameters (baseline, 1 hour, 1 day, 2 days, 3 days, and 4 days after CA injection) in 6 representative animals were recorded. Asterisk indicates p < 0.05 compared with baseline values. CA = contrast agent, CO = cortex, D = pure tissue molecular diffusion coefficient, D* = pseudo-diffusion coefficient, DCA = diabetic rabbits with contrast agent, f = perfusion fraction of voxel, NCA = healthy rabbits with contrast agent, OM = outer medulla. 832. https://doi.org/10.3348/kjr.2018.0757. kjronline.org.
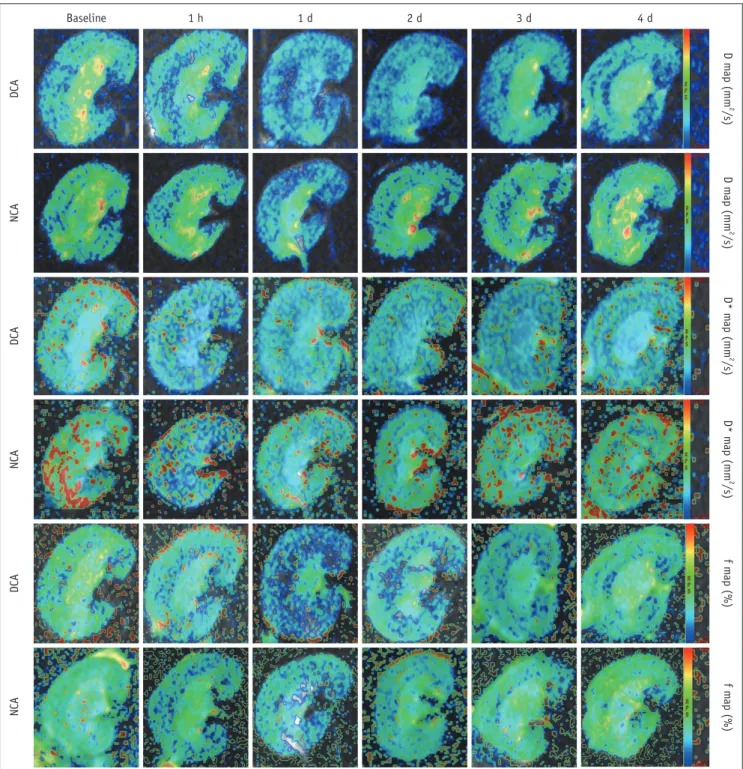
(4) IVIM, BOLD, CI-AKI, and Diabetes Mellitus. obtained with the optimized MRI parameters are shown in Supplementary Table 1 (in the online-only Data Supplement). The functional feature of the advanced workstation software (GE Healthcare) was used for image analysis. The quantitative regional IVIM parameters and R2* values were calculated using manually defined regions of interest. 1h. 1d. 2d. 3d. 4d D map (mm2/s). DCA. Baseline. (ROIs) for each of the anatomic layers (the cortex [CO] and the outer medulla [OM]) (26). A circular ROI was placed in the renal CO (30–35 mm2) and OM (35–40 mm2) regions (Supplementary Fig. 1 in the online-only Data Supplement). The ROIs drawn over the inner medulla were not analyzed due to the presence of the renal pelvis and calyx.. NCA. D map (mm2/s). DCA. D* map (mm2/s). NCA. D* map (mm2/s). DCA. f map (%). NCA. f map (%). Fig. 3. Representative IVIM images of two groups at corresponding time points. Maps were produced with same window and level settings. Maximum D and f signal changes appeared after day 1, whereas D* values appeared after 1 hour, followed by gradual recovery toward baseline values at subsequent time points.. kjronline.org. https://doi.org/10.3348/kjr.2018.0757. 833.
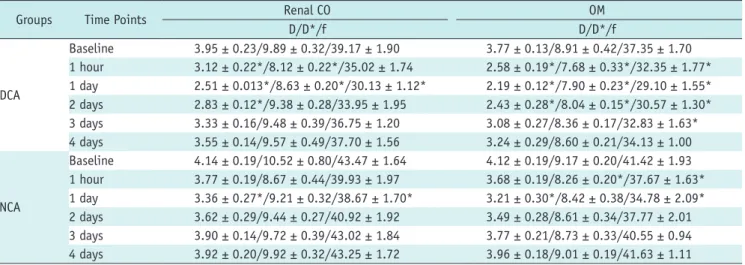
(5) Wang et al.. Table 1. Mean Values of D (x 10-4 mm2/s), D* (x 10-3 mm2/s), and f (%) Recorded after Injection of Contrast Agent for Two Groups Groups. DCA. NCA. Time Points Baseline 1 hour 1 day 2 days 3 days 4 days Baseline 1 hour 1 day 2 days 3 days 4 days. Renal CO D/D*/f 3.95 ± 0.23/9.89 ± 0.32/39.17 ± 1.90 3.12 ± 0.22*/8.12 ± 0.22*/35.02 ± 1.74 2.51 ± 0.013*/8.63 ± 0.20*/30.13 ± 1.12* 2.83 ± 0.12*/9.38 ± 0.28/33.95 ± 1.95 3.33 ± 0.16/9.48 ± 0.39/36.75 ± 1.20 3.55 ± 0.14/9.57 ± 0.49/37.70 ± 1.56 4.14 ± 0.19/10.52 ± 0.80/43.47 ± 1.64 3.77 ± 0.19/8.67 ± 0.44/39.93 ± 1.97 3.36 ± 0.27*/9.21 ± 0.32/38.67 ± 1.70* 3.62 ± 0.29/9.44 ± 0.27/40.92 ± 1.92 3.90 ± 0.14/9.72 ± 0.39/43.02 ± 1.84 3.92 ± 0.20/9.92 ± 0.32/43.25 ± 1.72. OM D/D*/f 3.77 ± 0.13/8.91 ± 0.42/37.35 ± 1.70 2.58 ± 0.19*/7.68 ± 0.33*/32.35 ± 1.77* 2.19 ± 0.12*/7.90 ± 0.23*/29.10 ± 1.55* 2.43 ± 0.28*/8.04 ± 0.15*/30.57 ± 1.30* 3.08 ± 0.27/8.36 ± 0.17/32.83 ± 1.63* 3.24 ± 0.29/8.60 ± 0.21/34.13 ± 1.00 4.12 ± 0.19/9.17 ± 0.20/41.42 ± 1.93 3.68 ± 0.19/8.26 ± 0.20*/37.67 ± 1.63* 3.21 ± 0.30*/8.42 ± 0.38/34.78 ± 2.09* 3.49 ± 0.28/8.61 ± 0.34/37.77 ± 2.01 3.77 ± 0.21/8.73 ± 0.33/40.55 ± 0.94 3.96 ± 0.18/9.01 ± 0.19/41.63 ± 1.11. *p < 0.05 vs. baseline. CO = cortex, D = pure tissue molecular diffusion coefficient, D* = pseudo-diffusion coefficient, DCA = diabetic rabbits with contrast agent, f = perfusion fraction of voxel, NCA = healthy rabbits with contrast agent, OM = outer medulla. Apparent transverse relaxation rate (R2* = 1/T2*) is a measure of the deoxygenated hemoglobin content in the tissue, which in turn reflects the partial pressure of hypoxia in the tissue (27). The diffusion-weighted signal intensity depends on a cylindrical two-compartment model in the voxel (Equation 1) (28). D is the molecular diffusion coefficient of pure tissue. D* is the pseudo-diffusion coefficient, and f is the perfusion fraction of the voxel. Sb / S0 = (1 - f) exp (-b ∙ D) + f exp (-b ∙ D*). (1). where S0 is the signal intensity in the absence of diffusion weighting (b = 0), and Sb is the signal intensity with the diffusion gradient b. Blood samples (1.5–2.0 mL) were obtained from the marginal ear vein and were immediately centrifuged at 3200 rpm (4°C) for 15 minutes. After the MRI, the right kidneys were removed, cut into small pieces, and subsequently fixed in 4% buffered paraformaldehyde. The inner medulla was excluded from the analysis. The pieces were then cut into 5-μm slices and stained with hematoxylin and eosin (H&E) and with Masson’s trichrome. Cortical alterations were graded as follows: normal kidney, 0; minimal injury (0–25%), 1; moderate injury (25–50%), 2; intermediate injury (50– 75%), 3; and severe injury (75–100%), 4 (29). The severity of tubular injury was graded based on the levels of tubular necrosis and the proteinaceous casts observed: 0, no damage; 1, mild; 2, moderate (< 25%); 3, severe (25–50%); and 4, very severe (> 50%) (30). The details outlining the immunostaining methods have been previously described (31), and the antibodies used 834. are listed in Supplementary Table 2 (in the online-only Data Supplement). The areas displaying HIF-1α+ nuclei and VEGF+ podocyte expression were quantified using ImageJ software (https://imagej.nih.-gov/ij/download.html). Statistical Analysis Statistical analysis was performed using SPSS software (SPSS 21; IBM Corp., Armonk, NY, USA). A p value < 0.05 was considered statistically significant. The IVIM parameters and R2* values were statistically compared with the baseline values using repeated-measures analysis of variance (ANOVA), and the Bonferroni post hoc test was used for further comparisons. The semi-quantitative pathological damage was statistically analyzed using a oneway ANOVA. The Kruskal-Wallis test was used to analyze the non-continuous parameters. The Spearman correlation coefficient was used to assess the relationships of the IVIM parameters and R2* values with the histological scores of right kidneys of all the animals at the various time points.. RESULTS General Characteristics of the two Treatment Groups In general, the animals did not show any signs of discomfort after the CA administration. As shown in Supplementary Table 3 (in the online-only Data Supplement), the fasting blood glucose levels of all the diabetic rabbits were significantly higher than those of the healthy rabbits. The mean body and kidney weight and the kidney/body weight ratio were significantly different between the two groups (all p < 0.05). https://doi.org/10.3348/kjr.2018.0757. kjronline.org.
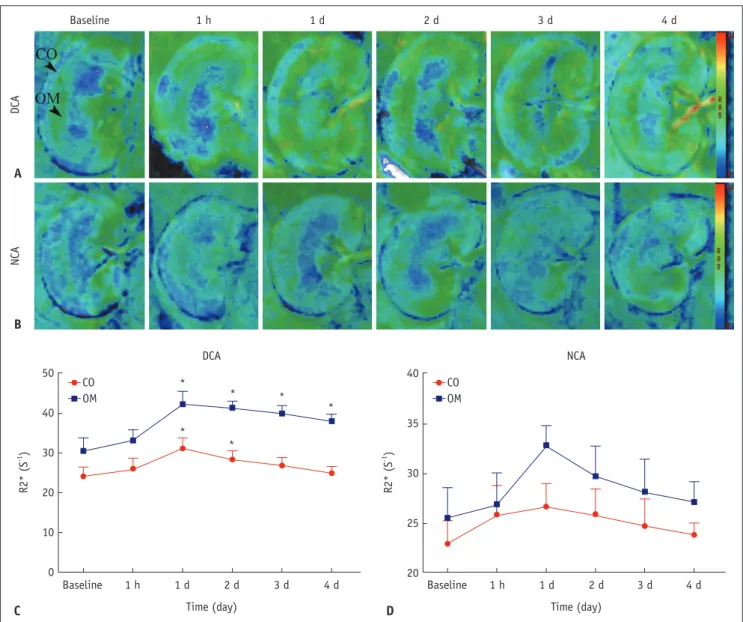
(6) IVIM, BOLD, CI-AKI, and Diabetes Mellitus. As shown in Supplementary Table 4 (in the online-only Data Supplement), the serum creatinine (Cr) and blood urea nitrogen (BUN) concentrations reached their maximum values on day 3 in the diabetic rabbits with the contrast agent (DCA) group (p < 0.05), whereas they were slightly increased without statistical differences after the iohexol administration in the healthy rabbits with the contrast agent (NCA) group. Intra-Renal Diffusion and Hemodynamics Measured by IVIM Figure 2 shows the time course of the IVIM parameters measured in the two groups. A comparison of the temporal 1h. 1d. 2d. 3d. 4d. DCA. Baseline. changes in the IVIM results between the two groups is shown in Figure 3. The data of the two contrast groups are shown in Table 1. In the DCA group, the D values were significantly decreased 1 hour, 1 day, and 2 days post-injection in the CO and OM of the kidneys compared to the baseline values (-21.1% with respect to baseline, p = 0.004 [CO, 1 hour]; -31.7% with respect to baseline, p < 0.001 [OM, 1 hour]; -36.4% with respect to baseline, p < 0.001 [CO, 1 day]; -41.9% with respect to baseline, p < 0.001 [OM, 1 day]; -28.4% with respect to baseline, p = 0.001 [CO, 2 days]; -35.5% with respect to baseline, p = 0.002 [OM, 2 days]), and they were still significantly lower compared. NCA. A. B DCA 50. CO OM. NCA 40. *. *. *. 40. 35. *. *. 30. R2* (S-1). R2* (S-1). *. 20. 30. 25. 10 0. CO OM. Baseline. C. 1h. 1d. 2d. 3d. 20. 4d. Time (day). D. Baseline. 1h. 1d. 2d. 3d. 4d. Time (day). Fig. 4. R2* maps for two groups obtained at each time point.. A. R2* maps in DCA group until day 4. B. R2* maps in NCA group until day 4. C, D. Each data point was average of R2* measurements in 6 rabbits from same group at one scan time. For each group, sharp increase in R2* values was observed after day 1 in two anatomical layers; subsequently, R2* values returned to baseline over time. Asterisk indicates p < 0.05 compared with baseline values. R2* = apparent transverse relaxation rate. kjronline.org. https://doi.org/10.3348/kjr.2018.0757. 835.
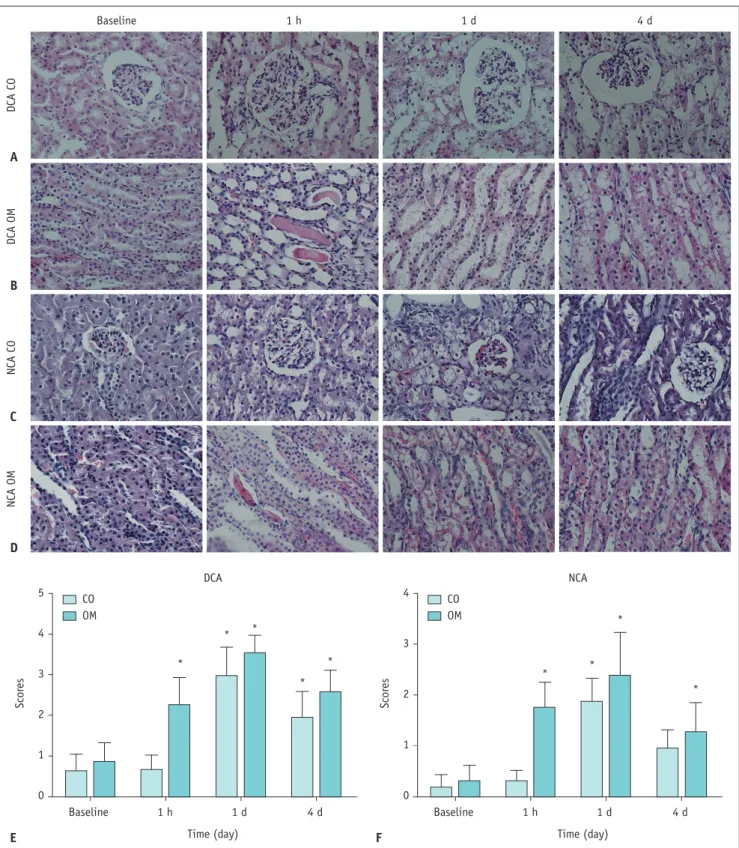
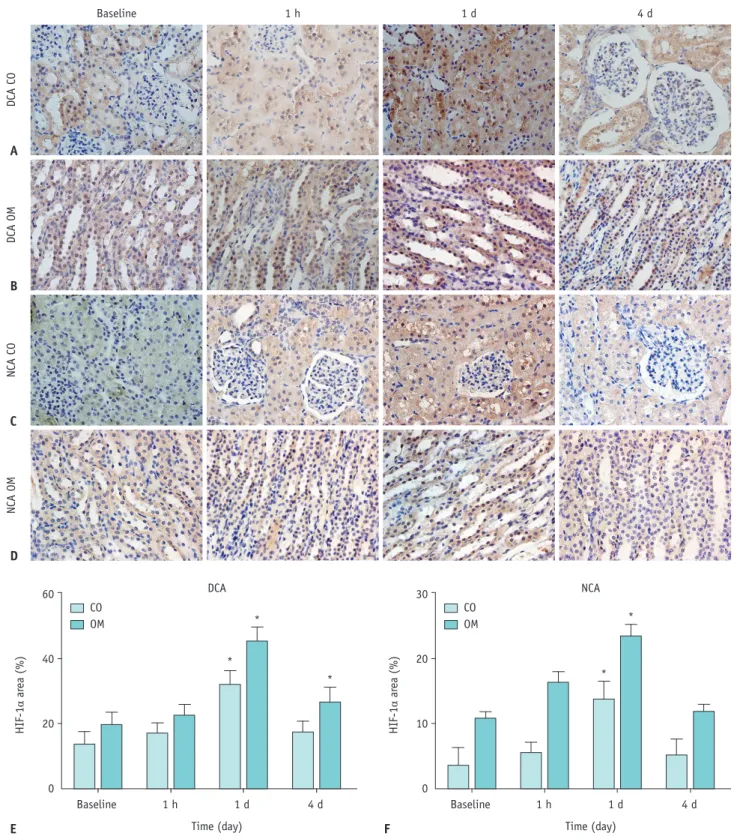
(7) Wang et al.. to the baseline values afterwards (reduced by 10.1% [CO]; 14.1% [OM]). In the NCA group, iohexol caused a much shorter duration of having reduced D values compared to the baseline, lasting 1 day in the CO (-18.8% with respect to baseline, p = 0.015) and 1 day in the OM (-22.1% with respect to baseline, p = 0.043). After 2 days, the D values gradually returned close to the baseline levels. With regard to perfusion measurements, a remarkable decline in the D* values in the OM was observed in the DCA group after 1 hour (-13.8% with respect to baseline, p = 0.009) and was only slightly alleviated after 2 days (-9.8% with respect to baseline, p = 0.044). In the CO, a prominent reduction in the D* values compared to the baseline values was observed after 1 hour to 1 day (-17.9% with respect to baseline at 1 hour, p = 0.001; -12.7% with respect to baseline at 1 day, p = 0.018), followed by a progressive increase starting from day 2. In the NCA group, iohexol only resulted in a progressive decrease in the D* values in the OM by approximately 8.2% of the baseline values at 1 hour after the injection time (p = 0.001). With regard to the f values in the renal OM, deficiency in the CA-induced medullary perfusion level aggravated within 1 hour to 3 days when compared to the baseline levels (-13.4% with respect to baseline, p = 0.012 [1 hour]; -22.1% with respect to baseline, p = 0.007 [1 day]; -18.2% with respect to baseline, p = 0.008 [2 days]; and -12.1% with respect to baseline, p = 0.001 [3 days]) and remained at low levels until day 4. In the CO, the f values reached their maximum by day 1 (-23.1% with respect to baseline, p = 0.002), but they subsequently returned to baseline levels by day 2. In the NCA group, the f values were significantly lower compared to the baseline levels and were reduced by 11.0% in the CO (p = 0.046) and by 16.0% in the OM (p = 0.025) after day 1. Intra-Renal Oxygenation by BOLD Figure 4A, B illustrates representative R2* images for each time point in the 2 groups after the iohexol injection. Figure 4C, D summarizes the R2* time course in the 2 groups. Table 2 summarizes the R2* values after the contrast injection in the 2 groups. In the DCA cohort, the R2* values were significantly higher by 17.4–28.9% compared to baseline values at 1–2 days after the contrast injection in the renal CO (p = 0.01 and 0.029, respectively). In the renal OM, the R2* increased by 24.2% by the end of the study period (day 4, p = 0.021). In the NCA group, the mean R2* values in the OM were 836. Table 2. Mean Values of R2* (s-1) Recorded after Injection of Contrast Agent for Two Groups Groups. DCA. NCA. Time Points Baseline 1 hour 1 day 2 days 3 days 4 days Baseline 1 hour 1 day 2 days 3 days 4 days. Renal CO R2* 24.19 ± 2.29 26.06 ± 2.68 31.17 ± 2.67* 28.40 ± 2.10* 26.89 ± 1.97 24.95 ± 1.62 22.90 ± 2.39 25.89 ± 2.95 26.70 ± 2.30 25.92 ± 2.58 24.73 ± 2.74 23.84 ± 1.20. OM R2* 30.66 ± 3.20 33.37 ± 2.54 42.36 ± 3.30* 41.49 ± 1.64* 40.04 ± 2.02* 38.07 ± 1.74* 25.74 ± 2.89 26.96 ± 3.13 32.90 ± 2.00 29.78 ± 3.05 28.22 ± 3.27 27.17 ± 2.04. *p < 0.05 vs. baseline. R2* = apparent transverse relaxation rate. higher by 15.7–27.8% compared to baseline values on days 1 and 2 after the iohexol injection; however, no significant changes were observed in the 2 renal regions at any of the later time points. Histological Analysis The cortical and medullary regions of the kidneys of the two groups are shown in Figure 5. At 1 hour, the proximal and distal convoluted tubular epithelial cells were enlarged, and vacuolization was observed in the renal CO while proteinaceous casts were observed in the renal OM. In addition to vacuolization, small numbers of inflammatory cells, tubular collapse, and extensive nuclear necrosis were observed on day 1. On day 4, vacuolation and significantly increased extracellular matrix deposition were observed in both the glomerulus and tubule regions (Fig. 6). As shown in Figure 7, a marked nuclear accumulation of HIF-1α were detectable in the renal CO and OM after day 1. Following this, HIF-1α expression levels declined over time; however, they were still detectable after day 4 in the diabetic group. In contrast, HIF-1α staining denoting hypoxia was not detected in the healthy rabbits after day 1. As with HIF-1α, the VEGF staining was observed in regions of extreme tissue hypoxia. However, they were no longer detectable after day 4 in the DCA group and after day 2 in the NCA group (Fig. 8). Correlation between fMRI Parameters and Renal Injury and HIF-1α Expression Scores and Cr Levels As shown in Figure 9A, C, and D, renal injury scores in https://doi.org/10.3348/kjr.2018.0757. kjronline.org.
(8) IVIM, BOLD, CI-AKI, and Diabetes Mellitus. the OM correlated well with the D values (r = -0.740, p < 0.001), f values (r = -0.754, p < 0.001), and R2* values (r = 0.759, p < 0.001). However, only a modest correlation was 1h. 1d. 4d. DCA CO. Baseline. observed between the renal injury scores and the D* values (r = -0.406, p = 0.0013) (Fig. 9B). In addition, very good correlations were observed between the expression scores. DCA OM. A. NCA CO. B. NCA OM. C. D DCA 5 4. *. *. 3. CO OM. *. 3 *. * *. Scores. Scores. NCA 4. CO OM. 2. *. * *. 2. 1. 1 0. 0 Baseline. E. 1h. 1d Time (day). 4d. Baseline. 1h. F. 1d. 4d. Time (day). Fig. 5. Representative micrographs of hematoxylin and eosin staining of kidney in two groups.. (A, B) DCA group, (C, D) NCA group (original magnification, x 400), (E, F) severity of histopathological injury. *p < 0.05 (compared with baseline values).. kjronline.org. https://doi.org/10.3348/kjr.2018.0757. 837.
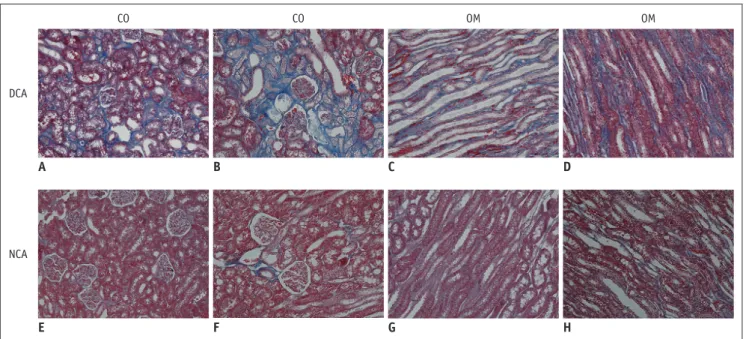
(9) Wang et al.. CO. CO. OM. OM. DCA. A. B. C. D. E. F. G. H. NCA. Fig. 6. Representative micrographs of kidney with Masson’s trichrome staining.. (A, C) diabetic rabbits, (B, D) DCA post day 4, (E, G) healthy rabbits, and (F, H) NCA post day 4 (original magnification x 200). In DCA group, Masson’s trichrome staining showed gradual increase in percentage of interstitial fibrosis, while in NCA group, small amount of interstitial fibrosis was observed after day 4.. of HIF-1α and the D, D*, f, and R2* values (r = -0.857, p < 0.001; r = -0.716, p < 0.001; r = -0.781, p < 0.001; and r = 0.863, p < 0.001, respectively) (Fig. 9E-H). A modest correlation was observed between Cr levels and the D, D*, and f values (r = -0.609, p < 0.001; r = -0.519, p < 0.001; and r = -0.563, p < 0.001, respectively) (Fig. 9I-K), whereas the Cr correlated well with the R2* values (r = 0.752, p < 0.001) (Fig. 9L). The correlations of fMRI parameters with histological injury, HIF-1α expression, and Cr in the renal CO are presented in Supplementary Figure 2 (in the onlineonly Data Supplement).. DISCUSSION The diabetic cohort displayed prolonged changes in the parameters measured in this study compared to the healthy cohort. The D and D* values in the diabetic cohort gradually decreased from 1 hour to 2 days from the baseline levels while the f values also gradually decreased during the first 3 days after the iohexol injection. It should be noted that an earlier significant decrease in the D* values was observed at 1 hour. The peak changes in the R2* were observed on day 1, and the R2* was correlated with HIF-1α and Cr measurements. However, pronounced changes in the IVIM parameters and R2* values in the NCA group were observed on day 1 after the iohexol injection. These findings support the feasibility of using IVIM and BOLD imaging to study CI838. AKI in diabetic patients. The decrease in the D values indicated that iohexol induced a progressive reduction in intrarenal diffusion in the diabetic rabbits. This result can be attributed to several conditions. First, this reduction may be associated with renal tissue edema and inflammatory cell infiltration, which could be detected by the results from H&E staining. Ries et al. (32) also found a reduction in the apparent diffusion coefficient in diabetic rabbits and in case of edematous cellular damage. In addition, a decrease in the D values is followed by a subsequent development of interstitial renal fibrosis and glomerular atrophy. Observing the area affected by fibrosis using Masson’s staining supports this hypothesis. An association between decreased water diffusion and tissue fibrosis has already been shown in a rat model of liver fibrosis (33). Lastly, a CA disrupts the renal pathology by necrosis of the renal tubular epithelial cells, proteinaceous casts in renal tubules, and medullary congestion, which negatively correlates with the successive aggravation of diffusion deficiency (34). Significant decreases in the D* and f values were observed in the diabetic rabbits, suggesting a reduction in blood flow. This may be due to vasculopathy in the pathogenesis of diabetic nephropathy (35). The elevated levels of VEGF also suggest impaired renal endothelial function, as has been reported in several previous studies (19, 36). After iohexol administration, the decreased https://doi.org/10.3348/kjr.2018.0757. kjronline.org.
(10) IVIM, BOLD, CI-AKI, and Diabetes Mellitus. medullary blood flow could aggravate and be prolonged. The early D* and f response to iohexol was primarily due to sustained vasoconstriction (within the first hour), which 1h. 1d. 4d. DCA CO. Baseline. was demonstrated previously by Rauch et al. (37). The renal vascular dysfunction in diabetic rabbits may be caused by an increased sensitivity to renal vasoconstriction and. DCA OM. A. NCA CO. B. NCA OM. C. D DCA. 30. CO OM. *. 40. * *. 20. HIF-1α area (%). HIF-1α area (%). 60. 0. CO OM. *. 20 *. 10. 0 Baseline. E. NCA. 1h. 1d Time (day). 4d. Baseline. F. 1h. 1d. 4d. Time (day). Fig. 7. Time course of HIF-1α expression after iohexol injection in each group.. (A, B) DCA group, (C, D) NCA group (original magnification x 400). (E, F) Nuclear staining score for HIF-1α in two groups. Expression of HIF-1α slightly increased after 1 hour in all anatomical layers and was significantly higher after day 1 compared to baseline in 2 groups. *p < 0.05 vs. baseline values. HIF-1α = hypoxia-inducible transcription factor-1α. kjronline.org. https://doi.org/10.3348/kjr.2018.0757. 839.
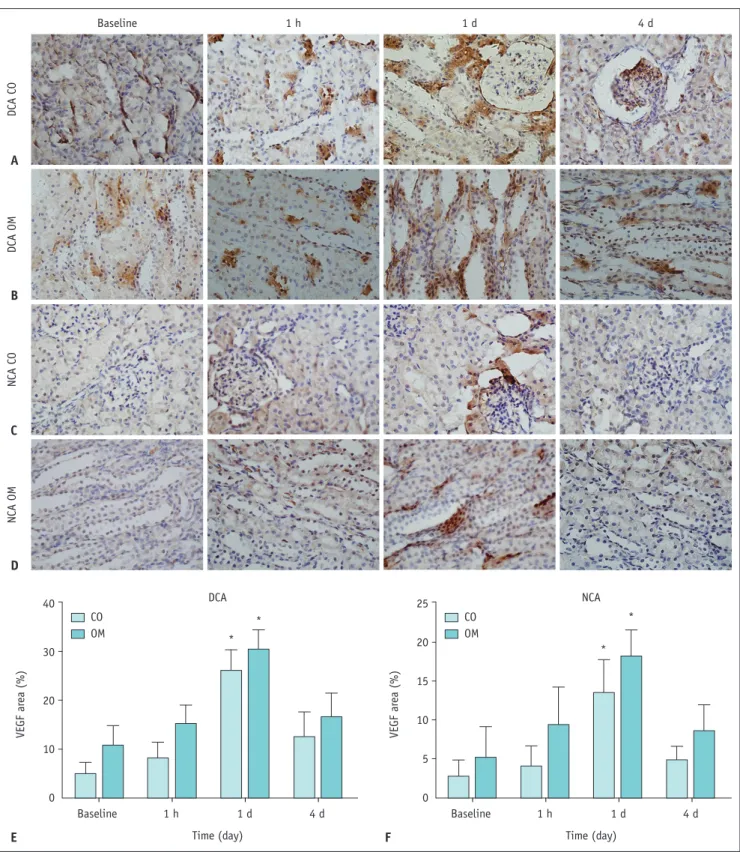
(11) Wang et al.. ischemia due to the increased generation of reactive oxygen species (38) and a decrease in nitric oxide-dependent vasodilation (3). Similarly, complete renal ischemia in 1h. 1d. 4d. DCA CO. Baseline. diabetic rats caused accelerated renal injury with lesions (39). With respect to contrast-induced kidney damage, we. DCA OM. A. NCA CO. B. NCA OM. C. D 40. DCA CO OM. * *. 20 VEGF area (%). 30 VEGF area (%). 25. 20. 10. * *. 15 10 5. 0. 0 Baseline. E. NCA CO OM. 1h. 1d Time (day). 4d. Baseline. F. 1h. 1d. 4d. Time (day). Fig. 8. Representative photomicrographs for VEGF expression in each group.. (A, B) DCA group, (C, D) NCA group (original magnification x 400), (E, F) VEGF scores for two groups. *p < 0.05 vs. baseline values. VEGF = vascular endothelial growth factor. 840. https://doi.org/10.3348/kjr.2018.0757. kjronline.org.
(12) IVIM, BOLD, CI-AKI, and Diabetes Mellitus. OM 0.011. 0.0003 0.0002. r = -0.7398 p < 0.0001. 0.0001 0.0000. 0. 1. 2 3 Histological score. 0.009 0.008 0.007. 4. A. 0.010. 0. 1. 2 3 Histological score. B. 40. -0.7535 rr==-0.4061 0.0001 pp<<0.0013 34 1 1 2 2 3 Histologicalscore score Histological. 30 20. 0. 54. OM 0.010. 0.40. 40. 0. 20 40 HIF-1α expression. 0.007 0.006. 60. f (%). 0.008. 0. 20. 40. 0.25. OM. OM. 0.0002 r = -0.6090 p < 0.0001 100 Cr (umol/L). 150. 40. 100 50. r = 0.8626 p < 0.0001. 60. 0. 20. r = -0.5193 p < 0.0001. 0 0.006 0.007 0.008 0.009 0.010 0.011 Cr (umol/L). 40. 60. HIF-1α expression. OM. f (%). 0.0003. D* (mm2/s). 0.0004. 50. 20. 0. H. 150. 0. 0. 20 10. r = -0.7810 p < 0.0001. G. 0.0005. 5. 30. HIF-1α expression. F. 0.0000. 0.30. r = -0.7163 p < 0.0001 60. HIF-1α expression. E. 0.0001. 0.35. OM. 0.45. 50. 0.40. 40. R2* (s-1). 0.0000. 0.009. R2* (s-1). 0.0004. r = -0.8571 p < 0.0001. 2 3 4 Histological score. OM 50. 0.0001. 1. OM 0.45. 0.0002. 0. D. 0.011. 0.0003. r = 0.7585 p < 0.0001. 10. 0.0005. D* (mm2/s). D (mm2/s). 0.011 0.40 0.010 0.35 0.009 0.30 0.008. C. OM. D (mm2/s). 50. 0.25 0.007 00. 4. OM. 0.012 0.45. R2* (s-1). 0.0004. OM OM r = -0.4061 p = 0.0013. (%)2/s) D* f(mm. 0.012. D* (mm2/s). D (mm2/s). OM 0.0005. 0.35 0.30 0.25. r = -0.5630 p < 0.0001 0. 50. 100 Cr (umol/L). I J K Fig. 9. Correlation between functional MRI parameters and pathological scores in OM.. 30 20 r = 0.7516 p < 0.0001. 10 0. 150. 0. 50. 100 Cr (umol/L). 150. L. Significant correlations of renal histological scores with D, f, and R2* values (A, C, and D) and fair correlations of renal histological scores with D* values (B). Significant correlations of renal HIF-1α scores with D, D*, f, and R2* values (E-H). Significant correlations of Cr with R2* values (L) and moderate correlations of Cr with D, D*, and f values (I-K).. found that the R2* was significantly higher in the diabetic rabbits compared to in the healthy rabbits, and these observations were correlated with HIF-1α levels. The CA administration aggravated physiological medullary hypoxia in an acute-on-diabetes renal failure compared to an acuteon-healthy renal failure (8). Chronic renal disease is a significant risk factor for acute renal dysfunction following renal hypoxia and toxicity (40). We hypothesized that OM microvascular depletion and hypoxia in diabetes predispose individuals to tubular hypoxic damage during acute insults. Furthermore, hyperfiltration, which is a characteristic of the early stages of diabetic nephropathy, likely results in increased sodium load to the tubules, resulting in enhanced oxygen consumption (41). We found that HIF-1α, a member of the ubiquitous master regulators of hypoxic adaptation family, accumulates in the hypoxic regions identified by VEGF expression. In this study, a persistent elevation of R2* values was observed in the DCA group. The hypothesis is that exacerbated hypoxia occurs secondary to CI-AKI and predisposes the kidney to develop chronic renal disease (42, kjronline.org. https://doi.org/10.3348/kjr.2018.0757. 43). CI-AKI does not seem like a secondary result, since exacerbated medullary hypoxia may trigger and aggravate the development of chronic disease (42, 44). Regarding renal safety, when a CA is administered to patients with a predilection to develop chronic renal failure, they should have follow-up fMRI monitoring while in hospital and 1–4 days after being discharged. This study had a few limitations. Quantitative comparisons were performed using the mean values of manually drawn ROIs, which made the analysis prone to error. For the diabetic cohort, several of the fMRI parameters failed to recover to the baseline levels even after 4 days. Hence, additional studies should be performed for a longer period to measure these parameters. In summary, when there is an increase in the expression of AKI markers, the impaired kidney is in a critical condition due to the onset of CI-AKI, leading to a lower renal tolerance to iohexol. Therefore, a combination of BOLD-fMRI and IVIM-fMRI can detect the structural and functional damage to the kidneys before the established clinical markers for kidney disease become apparent. 841.
(13) Wang et al.. Supplementary Materials The online-only Data Supplement is available with this article at https://doi.org/10.3348/kjr.2018.0757. Conflicts of Interest The authors have no potential conflicts of interest to disclose. Acknowledgments The authors thank GuiboYu for technical assistance (Key Laboratory of Imaging Diagnosis and Interventional Radiology of Liaoning Province, Shenyang, Liaoning, China). ORCID iDs Ke Ren https://orcid.org/0000-0002-5735-055X Yongfang Wang https://orcid.org/0000-0002-4804-3566 Xin Zhang https://orcid.org/0000-0003-1862-3495 Bin Wang https://orcid.org/0000-0002-7767-4930 Yang Xie https://orcid.org/0000-0002-2892-0613 Yi Wang https://orcid.org/0000-0002-1832-0876 Xuan Jiang https://orcid.org/0000-0002-3950-9504 Rongjia Wang https://orcid.org/0000-0002-9457-4093. REFERENCES 1. McCullough PA. Contrast-induced acute kidney injury. J Am Coll Cardiol 2008;51:1419-1428 2. Li LP, Lu J, Zhou Y, Papadopoulou MV, Franklin T, Bokhary U, et al. Evaluation of intrarenal oxygenation in iodinated contrast-induced acute kidney injury-susceptible rats by blood oxygen level-dependent magnetic resonance imaging. Invest Radiol 2014;49:403-410 3. Calvin AD, Misra S, Pflueger A. Contrast-induced acute kidney injury and diabetic nephropathy. Nat Rev Nephrol 2010;6:679688 4. Stacul F, van der Molen AJ, Reimer P, Webb JA, Thomsen HS, Morcos SK, et al.; Contrast Media Safety Committee of European Society of Urogenital Radiology (ESUR). Contrast induced nephropathy: updated ESUR Contrast Media Safety Committee guidelines. Eur Radiol 2011;21:2527-2541. 842. 5. Chalikias G, Drosos I, Tziakas DN. Contrast-induced acute kidney injury: an update. Cardiovasc Drugs Ther 2016;30:215228 6. Kurnik BR, Allgren RL, Genter FC, Solomon RJ, Bates ER, Weisberg LS. Prospective study of atrial natriuretic peptide for the prevention of radiocontrast-induced nephropathy. Am J Kidney Dis 1998;31:674-680 7. Su J, Zou W, Cai W, Chen X, Wang F, Li S, et al. Atorvastatin ameliorates contrast medium-induced renal tubular cell apoptosis in diabetic rats via suppression of rho-kinase pathway. Eur J Pharmacol 2014;723:15-22 8. Li LP, Lu J, Franklin T, Zhou Y, Solomon R, Prasad PV. Effect of iodinated contrast medium in diabetic rat kidneys as evaluated by blood-oxygenation-level-dependent magnetic resonance imaging and urinary neutrophil gelatinaseassociated lipocalin. Invest Radiol 2015;50:392-396 9. Inoue T, Kozawa E, Okada H, Inukai K, Watanabe S, Kikuta T, et al. Noninvasive evaluation of kidney hypoxia and fibrosis using magnetic resonance imaging. J Am Soc Nephrol 2011;22:1429-1434 10. dos Santos EA, Li LP, Ji L, Prasad PV. Early changes with diabetes in renal medullary hemodynamics as evaluated by fiberoptic probes and BOLD magnetic resonance imaging. Invest Radiol 2007;42:157-162 11. Hueper K, Hartung D, Gutberlet M, Gueler F, Sann H, Husen B, et al. Assessment of impaired vascular reactivity in a rat model of diabetic nephropathy: effect of nitric oxide synthesis inhibition on intrarenal diffusion and oxygenation measured by magnetic resonance imaging. Am J Physiol Renal Physiol 2013;305:F1428-F1435 12. Liang L, Chen WB, Chan KW, Li YG, Zhang B, Liang CH, et al. Using intravoxel incoherent motion MR imaging to study the renal pathophysiological process of contrast-induced acute kidney injury in rats: comparison with conventional DWI and arterial spin labelling. Eur Radiol 2016;26:1597-1605 13. Cai XR, Yu J, Zhou QC, Du B, Feng YZ, Liu XL. Use of intravoxel incoherent motion MRI to assess renal fibrosis in a rat model of unilateral ureteral obstruction. J Magn Reson Imaging 2016;44:698-706 14. Ichikawa S, Motosugi U, Ichikawa T, Sano K, Morisaka H, Araki T. Intravoxel incoherent motion imaging of the kidney: alterations in diffusion and perfusion in patients with renal dysfunction. Magn Reson Imaging 2013;31:414-417 15. Ding Y, Zeng M, Rao S, Chen C, Fu C, Zhou J. Comparison of biexponential and monoexponential model of diffusionweighted imaging for distinguishing between common renal cell carcinoma and fat poor angiomyolipoma. Korean J Radiol 2016;17:853-863 16. Wang Y, Ren K, Liu Y, Sun WG, Wang JH, Zhang X, et al. Application of BOLD MRI and DTI for the evaluation of renal effect related to viscosity of iodinated contrast agent in a rat model. J Magn Reson Imaging 2017;46:1320-1331 17. Heyman SN, Rosen S, Rosenberger C. Renal parenchymal hypoxia, hypoxia adaptation, and the pathogenesis of. https://doi.org/10.3348/kjr.2018.0757. kjronline.org.
(14) IVIM, BOLD, CI-AKI, and Diabetes Mellitus. radiocontrast nephropathy. Clin J Am Soc Nephrol 2008;3:288296 18. Rosenberger C, Heyman SN, Rosen S, Shina A, Goldfarb M, Griethe W, et al. Up-regulation of HIF in experimental acute renal failure: evidence for a protective transcriptional response to hypoxia. Kidney Int 2005;67:531-542 19. Shukla R, Pandey N, Banerjee S, Tripathi YB. Effect of extract of Pueraria tuberosa on expression of hypoxia inducible factor-1α and vascular endothelial growth factor in kidney of diabetic rats. Biomed Pharmacother 2017;93:276-285 20. Manotham K, Tanaka T, Ohse T, Kojima I, Miyata T, Inagi R, et al. A biologic role of HIF-1 in the renal medulla. Kidney Int 2005;67:1428-1439 21. Rosenberger C, Griethe W, Gruber G, Wiesener M, Frei U, Bachmann S, et al. Cellular responses to hypoxia after renal segmental infarction. Kidney Int 2003;64:874-886 22. Zhao Q, Li J, Yan J, Liu S, Guo Y, Chen D, et al. Lycium barbarum polysaccharides ameliorates renal injury and inflammatory reaction in alloxan-induced diabetic nephropathy rabbits. Life Sci 2016;157:82-90 23. Papadimitriou A, Silva KC, Peixoto EB, Borges CM, Lopes de Faria JM, Lopes de Faria JB. Theobromine increases NAD+/Sirt1 activity and protects the kidney under diabetic conditions. Am J Physiol Renal Physiol 2015;308:F209-F225 24. Pettersson G, Towart R, Grant D, Thyberg K, Golman K. The rabbit renal toxicity test: a sensitive in vivo test for the nephrotoxicity of contrast agents. Acad Radiol 2002;9 Suppl 1:S62-S64 25. Lauver DA, Carey EG, Bergin IL, Lucchesi BR, Gurm HS. Sildenafil citrate for prophylaxis of nephropathy in an animal model of contrast-induced acute kidney injury. PLoS One 2014;9:e113598 26. Wang JH, Ren K, Sun WG, Zhao L, Zhong HS, Xu K. Effects of iodinated contrast agents on renal oxygenation level determined by blood oxygenation level dependent magnetic resonance imaging in rabbit models of type 1 and type 2 diabetic nephropathy. BMC Nephrol 2014;15:140 27. Vivier PH, Storey P, Chandarana H, Yamamoto A, Tantillo K, Khan U, et al. Renal blood oxygenation level–dependent imaging contribution of R2 to R2* values. Invest Radiol 2013;48:501–508 28. Le Bihan D, Breton E, Lallemand D, Aubin ML, Vignaud J, Laval-Jeantet M. Separation of diffusion and perfusion in intravoxel incoherent motion MR imaging. Radiology 1988;168:497-505 29. Tsamouri MM, Rapti M, Kouka P, Nepka C, Tsarouhas K, Soumelidis A, et al. Histopathological evaluation and redox assessment in blood and kidney tissues in a rabbit contrastinduced nephrotoxicity model. Food Chem Toxicol 2017;108(Pt A):186-193 30. Ari E, Kedrah AE, Alahdab Y, Bulut G, Eren Z, Baytekin O, et al. Antioxidant and renoprotective effects of paricalcitol on. kjronline.org. https://doi.org/10.3348/kjr.2018.0757. experimental contrast-induced nephropathy model. Br J Radiol 2012;85:1038-1043 31. Wang Y, Ren K, Xie L, Sun W, Liu Y, Li S. Effect of repeated injection of iodixanol on renal function in healthy Wistar rats using functional MRI. Biomed Res Int 2018;2018:7272485 32. Ries M, Basseau F, Tyndal B, Jones R, Deminière C, Catargi B, et al. Renal diffusion and BOLD MRI in experimental diabetic nephropathy. Blood oxygen level-dependent. J Magn Reson Imaging 2003;17:104-113 33. Cheung JS, Fan SJ, Gao DS, Chow AM, Man K, Wu EX. Diffusion tensor imaging of liver fibrosis in an experimental model. J Magn Reson Imaging 2010;32:1141-1148 34. Wang J, Zhang Y, Yang X, Wang X, Zhang J, Fang J, et al. Time course study on the effects of iodinated contrast medium on intrarenal water transport function using diffusion-weighted MRI. J Magn Reson Imaging 2012;35:1139-1144 35. Yan YY, Hartono S, Hennedige T, Koh TS, Chan CM, Zhou L, et al. Intravoxel incoherent motion and diffusion tensor imaging of early renal fibrosis induced in a murine model of streptozotocin induced diabetes. Magn Reson Imaging 2017;38:71-76 36. Nakagawa T, Sato W, Kosugi T, Johnson RJ. Uncoupling of VEGF with endothelial NO as a potential mechanism for abnormal angiogenesis in the diabetic nephropathy. J Diabetes Res 2013;2013:184539 37. Rauch D, Drescher P, Pereira FJ, Knes JM, Will JA, Madsen PO. Comparison of iodinated contrast media-induced renal vasoconstriction in human, rabbit, dog, and pig arteries. Invest Radiol 1997;32:315-319 38. Heyman SN, Rosenberger C, Rosen S, Khamaisi M. Why is diabetes mellitus a risk factor for contrast-induced nephropathy? Biomed Res Int 2013;2013:123589 39. Melin J, Hellberg O, Akyürek LM, Källskog O, Larsson E, Fellström BC. Ischemia causes rapidly progressive nephropathy in the diabetic rat. Kidney Int 1997;52:985-991 40. Goldfarb M, Rosenberger C, Abassi Z, Shina A, Zilbersat F, Eckardt KU, et al. Acute-on-chronic renal failure in the rat: functional compensation and hypoxia tolerance. Am J Nephrol 2006;26:22-33 41. Prasad P, Li LP, Halter S, Cabray J, Ye M, Batlle D. Evaluation of renal hypoxia in diabetic mice by BOLD MRI. Invest Radiol 2010;45:819-822 42. Basile DP, Donohoe DL, Roethe K, Mattson DL. Chronic renal hypoxia after acute ischemic injury: effects of L-arginine on hypoxia and secondary damage. Am J Physiol Renal Physiol 2003;284:F338-F348 43. Coca SG, Singanamala S, Parikh CR. Chronic kidney disease after acute kidney injury: a systematic review and metaanalysis. Kidney Int 2012;81:442-448 44. Fine LG, Orphanides C, Norman JT. Progressive renal disease: the chronic hypoxia hypothesis. Kidney Int Suppl 1998;65:S74-S78. 843.
(15)
수치
+6
관련 문서
Magnetic characteristic of Zr-7Cu-xSn alloys: (a) The magnetization of applied magnetic field for Zr-7Si-xSn and (b) Magnetic susceptibilities of Zr-7Si-xSn and
Absolute and Relative Velocity in Plane Motion Instantaneous Center of Rotation in Plane Motion Absolute and Relative Acceleration in Plane Motion... Analysis of Plane
In the proposed method, the motion of focused object and the background is identified and then the motion vector information is extracted by using the 9
Postoperative Postoperative Postoperative Postoperative Magnetic Magnetic Magnetic Magnetic resonance resonance resonance image resonance image image image shows
Digital incoherent holography enables holograms to be recorded from incoherent light with just a digital camera and spatial light modulator , and three-dimensional properties
Magnetic field.. • Single particle motion of the plasma.
This research is a research to examine change in physical strengh, thickness of subcutaneous fat, and blood lipid after twelve week execution of
This study aimed to evaluate the site and extent of injury, injury mechanism, player position, and the reinjury incidence in the hamstring by using magnetic
