Environmental Science
Vol. 33, No. 1, pp. 39-48, February, 2017 https://doi.org/10.7747/JFES.2017.33.1.39
Relationship between Tree Species Diversity and Carbon Stock Density in Moist Deciduous Forest of Western Himalayas, India
Mohommad Shahid* and Shambhu Prasad Joshi
Ecology Research Laboratory, Department of Botany, DAV (PG) College, Dehradun, Uttarakhand 248001, India
Abstract
With the growing global concern about climate change, relationship between carbon stock density and tree species has become important for international climate change mitigation programmes. In this study, 150 Quadrats were laid down to assess the diversity, biomass and carbon stocks in each of the forest ranges (Barkot Range, Lachchiwala Range and Thano Range) of Dehra Dun Forest Division in Doon Valley, Western Himalaya, India. Community level carbon stock density was analyzed using Two Way Indicator Species Analysis. Species Richness and Shannon Weiner index was correlated with the carbon stocks of Doon Valley. Positive and weak relationship was found between the carbon stock density and Shannon Weiner Index, and between carbon stock density and Species Richness.
Key Words: carbon storage, REDD+, climate change, mitigation, diversity, TWINSPAN
Received: July 22, 2016. Revised: September 30, 2016. Accepted: October 3, 2016.
Corresponding author: Mohommad Shahid
Ecology Research Laboratory, Department of Botany, DAV (PG) College, Dehradun, Uttarakhand 248001, India Tel: +911352728786, E-mail: [email protected]
Introduction
Human activities causes the increase in the concentration of the greenhouse gases like carbon dioxide (CO2), meth- ane (CH4), etc. 40% Increase in the concentration of CO2
since pre-industrial times is due to fossil fuel emissions and land use change emissions (IPCC 2013a). The world’s for- ests are able to store carbon and work as natural brake of cli- mate change. Sustainable management of forest, enhance- ment of carbon stocks through afforestation, assisted natu- ral regeneration can play vital role in sequestering the car- bon from the atmosphere. Quantifying the availability of carbon stocks and sequestration potential of forest has be- come important to assess the role of forests in mitigating cli- mate change (FAO 2010).
Biological diversity encompasses the variety of existing
life forms, the ecological roles they perform and the genetic diversity they contain (FAO 1989). Environmental factors like climate, soil, topography, anthropogenic pressure spa- tially affects the distribution of biomass and biodiversity (Thompson et al. 2012). The relationship of biodiversity and carbon cycle has become important factor for the miti- gation of climate change through REDD+ programmes (Midgley et al. 2010).
Forests are considered important for the biodiversity and ecosystem service (Paquette and Messier 2010; Messier et al. 2013). Carbon sequestration service offered by the for- ests is of prime importance for climate regulation (Rhemtulla et al. 2009; Carlson et al. 2010; McKinley et al. 2011).
In the context of international climate change mitigation and biodiversity conservation programmes, the relationship between tree species diversity and carbon stock density has
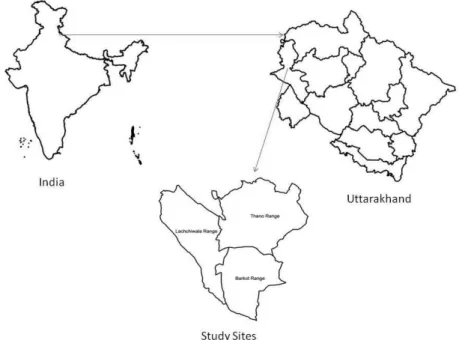
Fig. 1. Location of study sites.
become more important. Stand structural diversity can be an indicator of overall biodiversity (Staudhammer and LeMay 2001) and is commonly used in the character- ization of biophysical parameters (McElhinny et al. 2005).
Several studies are conducted to ascertain the relation- ship between species diversity and productivity in forest ecosystem (Lei et al. 2009; Paquette and Messier 2011).
Negative relationship was reported from Central Europe between aboveground biomass and tree species diversity (Szwagrzyk and Gazda 2007). Jonsson and Wardle (2009) reported that plant diversity has a weak effect on below- ground C storage in boreal forest ecosystems. Structural di- versity and forest growth has positive relationship in spruce-dominated forests (Lei et al. 2009). Negative corre- lation exists between stand composition and canopy vertical structure in aspen (Populus tremuloides Michx.) forest stands (Edgar and Burk 2001).
Relationship between tree diversity and carbon stocks in the forests of Doon Valley has not been studied. Knowledge about the correlation between tree species and carbon stocks is of very significance on a local and regional level to design the policies for biodiversity conservation, carbon stock enhancement and sustainable management of forests.
The research objectives was to assess the carbon stock and biodiversity and to test the hypothesis that whether there ex-
ist any relationship between carbon stock and biodiversity in the forests of Doon Valley. The purpose of the study was also to analyze the carbon stock variation with the species specific composition groups. Understanding of the rela- tionship will help in improvement of forest carbon measure- ment and provide an opportunity to select the species for the afforestation and reforestation under climate change mitigation REDD+ programmes.
Materials and Methods
Study site
The study was conducted in the three ranges (Barkot Range, Lachchiwala Range and Thano Range) of Dehra Dun Forest Division located in Doon Valley in the Sou- thwestern part of the state of Uttarakhand, India. The Doon valley is located in the Western Himalayas, lying be- tween latitudes 29o55’and 30o30’ N and longitudes 77o35’
and 78o24’ E. It is about 20 km wide and 80 km long sau- cer-shaped valley with a geographical area of ca. 2,100 km2 (Fig. 1). The area is bounded by the river Ganga in the east and river Yamuna in the West. The northern boundary is formed by Mussoorie hills whereas the Shiwalik Moun- tains form the southern boundary of the valley. Annual tem- perature ranges from 1.8oC (in January) to 40.0oC (in June).
The area received an average annual rainfall of 2,025.43 mm.
The region receives most of the annual rainfall during June to September, the maximum rainfall occurring in July and August.
Data collection
A total 150 quadrats of 10×10 m were laid down ran- domly in all range of the entire study area after thorough survey of the study for its topography, microclimate and bi- otic stress conditions. Phytosociological studies of the se- lected sites were conducted during the year 2010-11. The vegetation was analysed by means of random sampling to give most representative composition of vegetation. The height and diameter at breast height (1.37 m above the ground) of all the trees within the sampling quadrat were measured. The volume of the individual trees was estimated using the species specific volume equations (FSI 1996).
The estimated volume of each tree was multiplied by its specific gravity (Rajput et al. 1996) to derive the bole bio- mass. Later, the bole biomass was multiplied by the biomass expansion factor (Haripriya 2000) to derive individual tree aboveground biomass. Aboveground biomass was used to calculate the Belowground biomass by multiplying the val- ue of aboveground biomass with the constant factor 0.26 (IPCC 2006). Aboveground biomass and belowground bi- omass were added to get the individual tree total biomass.
The carbon contents was calculated by the multiplying the individual tree total biomass with the conversion factor 0.5 (IPCC 2006). The individual tree total biomass and carbon contents in a quadrat were summed to obtain total biomass and carbon storage in sampling quadrat. The mean total bi- omass and carbon were calculated by averaging the total bi- omass and carbon values in all sampling quadrats.
Diversity indices
The Shannon-Wiener diversity index (H’) (Shannon and Wiener 1963) was calculated from the Importance Value Index (IVI) values using the formula as given in Magurran (1988):
where,
′ ∑ s=the number of species
=the proportion of individuals or abundance of the ith species expressed as a proportion of total cover
ln=log base n
Importance value index (IVI)
Importance Value Index was evaluated according to Misra (1968) and Curtis and McIntosh (1951).
Two way indicator species analysis (TWINSPAN) species classification
TWINSPAN is a program for classifying species and samples, producing an ordered two-way table of their occurrence. The process of classification is hierarchical;
samples are successively divided into categories, and species are then divided into categories on the basis of the sample classification.
The TWINSPAN method is one of the more popular classification programs used in plant community ecology (Hill et al. 1975; Hill 1979b). The results of TWISNPAN analysis were considered community groups and used to es- timate the carbon stock availability in different community groups having specific species according to TWINSPAN classification. Windows based version of Twinspan Win- TWINS 2.3 was used to perform two way indicator species analysis (Hill and Smilauer 2005).
Species richness
Species richness is a simple and easily interpretable in- dicator of biological diversity (Peet 1974). Species richness appropriately measured as the number of species in a sam- ple of standard size (Whittaker 1972).
Relationship between carbon and phytodiversity
Relationship between carbon stock density and species richness as well as carbon stock density and Shannon Weiner Index was analyzed using regression analysis.
Results
Dominance (importance value index) of trees spe- cies in study area
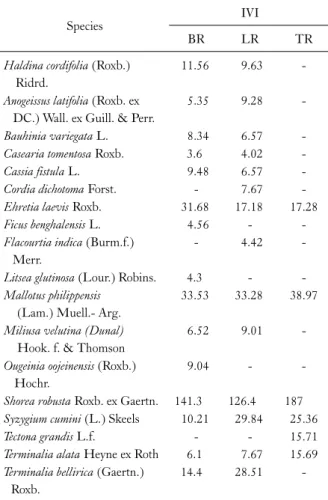
15 tree species were recorded from the Barkot Range.
Shorea robusta was the dominant species in the Barkot Range with the IVI value 141.32. The co-dominant species are Mallotus philippensis and Ehretia laevis with IVI value 33.53 and 31.68 respectively. The minimum IVI value
Table 1. Importance value index of the tree species in study area
Species IVI
BR LR TR
Haldina cordifolia (Roxb.) Ridrd.
11.56 9.63 -
Anogeissus latifolia (Roxb. ex DC.) Wall. ex Guill. & Perr.
5.35 9.28 -
Bauhinia variegata L. 8.34 6.57 -
Casearia tomentosa Roxb. 3.6 4.02 -
Cassia fistula L. 9.48 6.57 -
Cordia dichotoma Forst. - 7.67 -
Ehretia laevis Roxb. 31.68 17.18 17.28
Ficus benghalensis L. 4.56 - -
Flacourtia indica (Burm.f.) Merr.
- 4.42 -
Litsea glutinosa (Lour.) Robins. 4.3 - -
Mallotus philippensis (Lam.) Muell.- Arg.
33.53 33.28 38.97
Miliusa velutina (Dunal) Hook. f. & Thomson
6.52 9.01 -
Ougeinia oojeinensis (Roxb.) Hochr.
9.04 - -
Shorea robusta Roxb. ex Gaertn. 141.3 126.4 187 Syzygium cumini (L.) Skeels 10.21 29.84 25.36
Tectona grandis L.f. - - 15.71
Terminalia alata Heyne ex Roth 6.1 7.67 15.69 Terminalia bellirica (Gaertn.)
Roxb.
14.4 28.51 -
BR, Barkot Range; LR, Lachchiwala Range; TR, Thano Range.
Table 2. Diversity index of trees at various study sites
INDICES Barkot
Range
Lachchiwala Range
Thano Range
Richness 15 14 06
Shannon Weiner Index (H’) 1.67 2.023 1.242 (3.60) was reported for the Casearia tomentosa. Shorea ro-
busta had the 47% share in the forest of the Barkot Range.
14 species are reported from Lachchiwala Range. The max- imum IVI (126.36) was for the Shorea robusta in Lachchi- wala Range. Mallotus philippensis and Syzygium cumini had the IVI value of 33.28 and 29.84 respectively in Lach- chiwala Range. The minimum IVI Value (4.02) was recor- ded for the Caseaseria tomentosa. The Shorea robusta had the maximum IVI (187) in the Thano Range. The Mallotus philippensis and Syzygium cumini had the IVI value 38.97 and 25.36 respectively in Thano Range. A total of six spe- cies were recorded in the Thano Range. The minimum IVI Value (15.69) was recorded for the Terminalia alata (Table 1).
Diversity measurement
Species Richness was the maximum 15 from the Barkot
Range. Lachchiwala Range and Thano had reported the species richness of 14 and 06 respectively. The highest Shannon Weiner index (H’) (2.023) was recorded in the Lachchiwala Range while the lowest H’ (1.242) was re- corded in Thano Range (Table 2).
Carbon assessment in barkot, lachchiwala and thano range
Barkot range
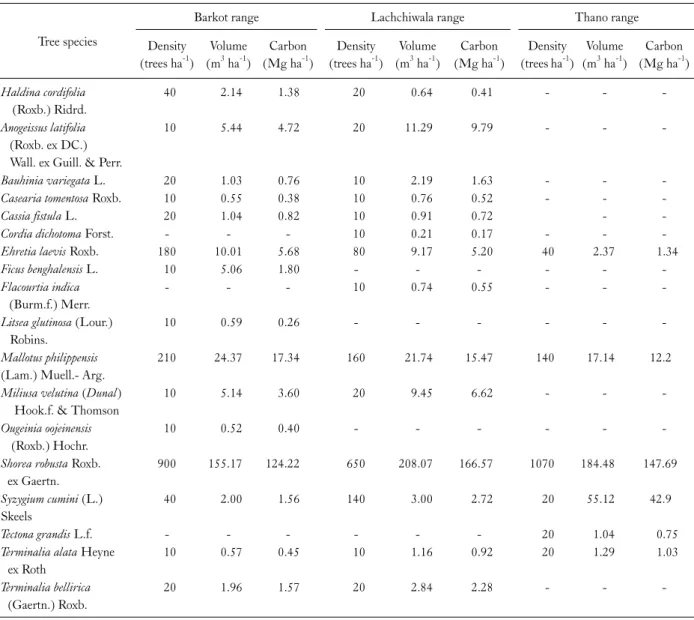
A total of 215.59 m3 ha-1 mean volume has been re- corded from the Barkot Range. Shorea robusta has the ma- ximum contribution of volume (155.17 m3 ha-1) being the most dominant tree species in the forest. It was followed by Mallotus philippensis with the mean volume of 24.37 m3 ha-1. The minimum volume (0.52 m3 ha-1) was reported by the Ougeinia oojeinensis. A total of 1500 tree ha-1 trees were reported from the Moist Deciduous Forest in Barkot Range. The maximum (900 tree ha-1) contribution was by the Shorea robusta followed by Mallotus philippensis and Ehretia laevis with the density of 210 tree ha-1 and 180 tree ha-1 respectively. A total of 164.94 Mg ha-1 carbon stock was re- corded in the Moist Deciduous Forest of Barkot Range (Table 3).
Lachchiwala range
A total of 272.17 m3 ha-1 mean volume was recorded in the Moist Deciduous Forest of Lachchiwala Range with the maximum (208.07 m3 ha-1) contribution by Shorea robusta. Total Density of 1170 tree ha-1 was recorded in the Moist Deciduous Forest of Lachchiwala Range. Shorea ro- busta had the contribution of 650 tree ha-1. 213.57 Mg ha-1 carbon stock was reported from the Moist Deciduous Forest of Lachchiwala Range (Table 3).
Thano range
Mean volume in the Moist Deciduous Forest of Thano Range was 261.44 m3 ha-1. The mean volume (184.48 m3 ha-1)
Table 3. Density, volume, and carbon stock density in various study sites
Tree species
Barkot range Lachchiwala range Thano range
Density (trees ha-1)
Volume (m3 ha-1)
Carbon (Mg ha-1)
Density (trees ha-1)
Volume (m3 ha-1)
Carbon (Mg ha-1)
Density (trees ha-1)
Volume (m3 ha-1)
Carbon (Mg ha-1) Haldina cordifolia
(Roxb.) Ridrd.
40 2.14 1.38 20 0.64 0.41 - - -
Anogeissus latifolia (Roxb. ex DC.) Wall. ex Guill. & Perr.
10 5.44 4.72 20 11.29 9.79 - - -
Bauhinia variegata L. 20 1.03 0.76 10 2.19 1.63 - - -
Casearia tomentosa Roxb. 10 0.55 0.38 10 0.76 0.52 - - -
Cassia fistula L. 20 1.04 0.82 10 0.91 0.72 - -
Cordia dichotoma Forst. - - - 10 0.21 0.17 - - -
Ehretia laevis Roxb. 180 10.01 5.68 80 9.17 5.20 40 2.37 1.34
Ficus benghalensis L. 10 5.06 1.80 - - - - - -
Flacourtia indica (Burm.f.) Merr.
- - - 10 0.74 0.55 - - -
Litsea glutinosa (Lour.) Robins.
10 0.59 0.26 - - - - - -
Mallotus philippensis (Lam.) Muell.- Arg.
210 24.37 17.34 160 21.74 15.47 140 17.14 12.2
Miliusa velutina (Dunal) Hook.f. & Thomson
10 5.14 3.60 20 9.45 6.62 - - -
Ougeinia oojeinensis (Roxb.) Hochr.
10 0.52 0.40 - - - - - -
Shorea robusta Roxb.
ex Gaertn.
900 155.17 124.22 650 208.07 166.57 1070 184.48 147.69
Syzygium cumini (L.) Skeels
40 2.00 1.56 140 3.00 2.72 20 55.12 42.9
Tectona grandis L.f. - - - - - - 20 1.04 0.75
Terminalia alata Heyne ex Roth
10 0.57 0.45 10 1.16 0.92 20 1.29 1.03
Terminalia bellirica (Gaertn.) Roxb.
20 1.96 1.57 20 2.84 2.28 - - -
of the Shorea robusta was followed by 55.12 m3 ha-1 of Syzy- gium cumini. Mallotus philippensis has the contribution of 17.14 m3 ha-1 while the Ehretia laevis shared the con- tribution of 2.37 m3 ha-1. Total Density of 1,310 tree ha-1 was recorded in the Moist Deciduous Forest of Thano Range.
The Shorea robusta had the density of 1070 tree ha-1. Total Carbon estimated in the Moist Deciduous Forest of Thano Range was 205.91Mg ha-1 (Table 3).
Two way indicator species analysis (TWINSPAN) spe- cies classification
A total of 18 tree species were analysed with TWIN-
SPAN. Division number 1 classified the 18 species with the Eigen Value 0.364 into 12 species in the Left Hand side and 06 species in the Right Hand Side (RHS). 12 species are further classified with Eigen Value 0.247 into 3 species in the LHS and 09 species in the RHS. Three species forms the group I while 09 species are further clustered into 08 and 01 species. 06 species obtained after the I Division, are classified into 05 species in the LHS and 01 species in the RHS. 01 species at this stage forms the group VIII. 08 species are further classified into 06 and 02 in the LHS and RHS respectively at the Division number 10. 02 species form the group IV and are not further classified. 06 species
Fig. 2. Classification of Tree Species on the basis of TWINSPAN.
Table 4. Clustering of tree species at various study sites Group No. of species Name of species I 03 Ficus benghalensis, Litsea glutinosa,
Ougeinia oojeinensis
II 01 Haldina cordifolia
III 05 Anogeissus latifolia, Bauhinia
variegata, Caseaseria tomentosa, Cassia fistula, Miliusa velutina
IV 02 Cordia dichotoma, Flacourtia indica
V 01 Terminalia alata
VI 04 Ehretia laevis, Mallotus philippensis, Shorea robusta, Syzygium cumini
VII 01 Terminalia bellirica
VIII 01 Tectona grandis
with Eigen value (0.104) are further classified into 01 and 05 and both forms the groups II and III respectively. 05 species obtained after the Division number 06 are further classified with Eigen Value (0.071) into 04 and 01 species which forms the groups VI and VII respectively (Fig. 2).
A total of eight groups are formed after the classification of tree on the basis of TWINSPAN. Group III was the largest groups with five tree species Anogeissus latifolia, Bauhinia variegata, Caseaseria tomentosa, Cassia fistula, Miliusa velutina. One species each was present in the four
groups (Group II, V, VII and VIII). Group I have the three species namely Ficus benghalensis, Litsea glutinosa, Oug- einia oojeinensis. Shorea robusta alongwith Ehretia laevis, Mallotus philippensis and Syzygium cumini forms the group VI. Two species Cordia dichotoma, Flacourtia indica are present in the Group IV (Table 4).
Relationship between TWINSPAN classified groups and Carbon Stocks
Group VI with the tree species Ehretia laevis, Mallotus philippensis, Shorea robusta, Syzygium cumini is the most dominant group with 542.89 Mg ha-1 Carbon storage.
Shorea robusta and Mallotus philippensis had the max- imum carbon storage (483.49 Mg ha-1) in all the three ranges. Syzygium cumini replaced the Mallotus philip- pensis in terms of Carbon storage and become the co-domi- nant in Thano Range. Group III with largest number of tree species (5) Anogeissus latifolia, Bauhinia variegata, Caseaseria tomentosa, Cassia fistula, Miliusa velutina had the contribution of only 21.40 Mg ha-1 Carbon in all the studied three ranges.
Relationship between species richness and carbon stock The results showed that there was positive but weak rela- tionship between species richness and carbon stock in the
Fig. 3. Relationship between Species Richness and Carbon Stock in differ- ent ranges of Doon Valley, India. (A) Barkot, (B) Lachchiwala, (C) Thano.
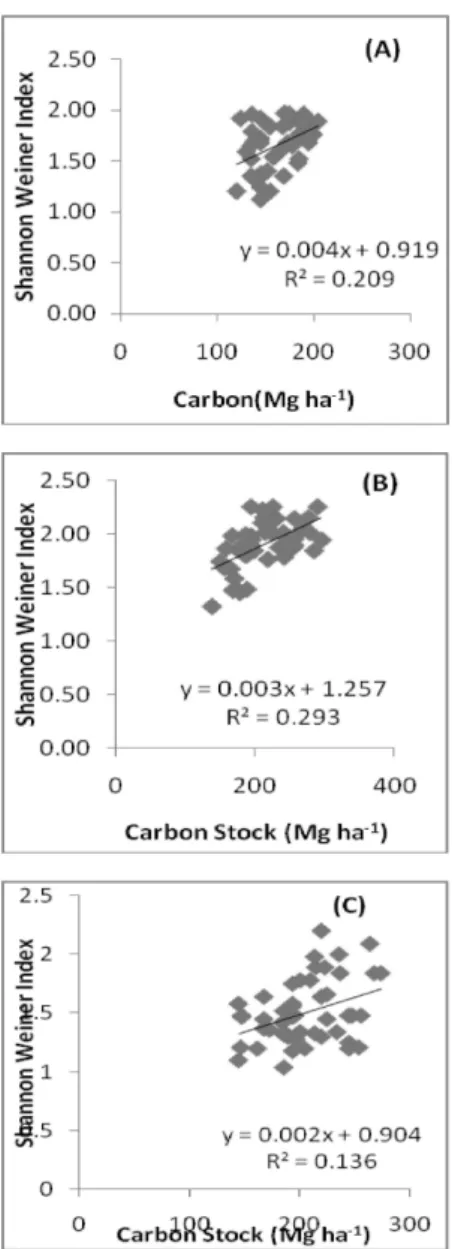
Fig. 4. Relationship between Shannon Weiner Index and Carbon Stock in different ranges of Doon Valley,India. (A) Barkot, (B) Lachchiwala, (C) Thano.
moist deciduous forest of Doon Valley. The value of R2 of linear regression was 0.259, 0.220 and 0.203 in Barkot, Lachchiwala and Thano Range respectively (Fig. 3). The same findings have been reported by Mandal et al. 2013.
Relationship between shannon weiner index and carbon stock
The positive and weak relationship was obtained between Shannon Weiner Index and carbon stock. The value of R2 was 0.209, 0.293 and 0.136 in Barkot, Lachchiwala and
Thano Range respectively (Fig. 4).
Discussion
Forest ecosystems have structure, composition and func- tion as the important attributes. Variations in these attrib- utes are observed due to climate, topography, soil and an- thropogenic factors. These factors along with forest succes- sion causes local and landscape level variations in forest at- tributes and produce spatial heterogeneity (Timilsina et al.
2007).
Shorea robusta (Sal) Forests of Doon Valley are charac- teristically homogenous in distribution due to various silvi- cultural operations carried out in the past (Bisht and Sharma 1987; Rawat and Bhainsora 1999; Pande 1999; Chauhan et al. 2001). The reason for this may be various disturbances prevailing in these forests viz. fuelwood and fodder collec- tion, livestock grazing, illegal timber collection, medicinal plant collection. These anthropogenic pressures have the effected the forest structure.
Importance value of Sal ranged between 123.36 and 187.00, which is well within the limits of earlier studies of Bisht and Sharma (1987); Rawat and Bhainsora (1999);
Pande (1999); Agni et al. (2000); Chauhan et al. (2001).
Dominance of Sal depends upon the age, available re- sources, associate species, disturbance regime and succes- sional changes. The Site (Thano Range) in which the IVI exceeds more than 150.00 can be predicted that the Sal Forest is progressing towards the climax stage, where as in other two sites (Barkot Range and Lachchiwala Range), having IVI values are ranging between 100.00 and 150.00 denotes that these sites were under heavy disturbances.
Carbon in Deciduous Forest of Eastern Ghats was 125.826 Mg ha-1 while in the Secondary Deciduous Forest was 120.886 Mg ha-1 (Ramachandaran et al. 2007). In the present study, 164.94 to 213.57 Mg ha-1 Carbon is reported from the Moist Deciduous Forest of Doon Valley. The present study is also comparable with the results of Haripriya (2000) and Sharma et al. (2010). The low value of Carbon in Barkot Range is may be due to the prevailing disturbances like heavy dependence of the local people and being adjacent to National Highway while in Lachchiwala Range and Thano Range, high amount of carbon stock in- dicates that the disturbance are less as compared to other sites. Studies on diversity and functional relationship have very recently started (Scherer-Lorenzen et al. 2005). Different studies have produced different outputs. Productivity and diversity have positive relationship (Caspersen and Pacala 2001). No relationship was recorded between diversity and productivity (Enquist and Niklas 2001). Frivold and Frank (2002) described that there may be positive or negative re- lationship between species in a mixed species stand. In the present study, positive and weak relationship was found be- tween Species Richness and Carbon Stock. The positive
and weak relationship was also obtained between Shannon Weiner Index and Carbon Stock. A positive relationship between carbon stock density and species diversity is im- portant for the implementation of climate change mitigation programme like reducing emissions from deforestation and forest degradation (REDD+) which can provide multiple benefits for conservation of biodiversity.
Conclusion
Study provides relevant information on the relationship between tree species diversity and carbon stocks. The re- sults are of great significance to understand the hetero- geneity of carbon storage in moist deciduous forests and significance of tree species in carbon storage. Results will also help the policy-makers to find the solutions to prob- lems that are threatening the forest ecosystem. Tree Species diversity play very important role in forest resilience and structure. International programme with the objective to protect the biodiversity alongwith the increase in the carbon storage potential of the tree species are effectively im- plemented after making the observation on relationship be- tween carbon stocks and tree species diversity. It is more necessary to find the accurate and precise biomass estima- tion for Doon Valley forests to improve understanding of the role played by Doon Valley forests in the global carbon cycle. However, we found that the relationship between car- bon stocks and diversity was positive. Further work is re- quired to establish whether biodiversity is important for carbon storage.
Acknowledgements
Authors are thankful to Principal and Head, Department of Botany, DAV (PG) College, Dehradun for providing necessary facilities to conduct the study.
References
Agni T, Pandit A, Pant K, Tewari A. 2000. Analysis of tree vegeta- tion in the Tarai-Bhabhar Tract of Kumaun Central Himalaya.
Ind J For 23: 252-261.
Bisht APS, Sharma SC. 1987. Disturbance regimes in Sal (Shorea robusta) forests of Dehra Dun Forest Division. Int J Ecol Environ Sci 13: 87-94.
Carlson M, et al. 2010. Maintaining the role of Canada’s forests and peatlands in climate regulation. For Chro 86: 434-443.
Caspersen JP, Pacala SW. 2001. Successional diversity and forest ecosystem function. Ecol Res 16: 895-903.
Chauhan PS, Manhas RK, Negi JDS. 2001. Demographic and di- versity analysis of tree species in Sal (Shorea robusta Gaertn.f.) Forests of Doon Valley. Ann For 9(2): 188-198.
Curtis JT, McIntosh RP. 1951. An Upland Forest Continuum in the Prairie Forest Border Region of Wisconsin. Ecology 32:
476-496.
Edgar CB, Burk TE. 2001. Productivity of aspen forests in north- eastern Minnesota, USA, as related to stand composition and canopy structure. Can J For Res 31: 1019-1029.
Enquist BJ, Niklas KJ. 2001. Invariant scaling relations across tree dominated communities. Nature 410: 655-660.
FAO. 1989. Plant genetic resources: their conservation in situ for human use. Document prepared in collaboration with UNESCO, UNEP and IUCN. FAO, Rome.
FAO. 2010. Global Forest Resources Assessment 2010. Food and Agriculture Organization of the United Nations FAO Papers 163, Rome, Italy.
Frivold LH, Frank J. 2002. Growth of Mixed Birch-Coniferous Stands in Relation to Pure Coniferous Stands at Similar Sites in South-eastern Norway. Scan J For Res 17: 139-149.
FSI (Forest Survey of India). 1996. Volume Equations for Forests of India, Nepal and Bhutan. Forest survey of India, Ministry of Environment and Forests, Dehradun, India.
Haripriya GS. 2000. Estimates of biomass in Indian forests. Bio Bio 19: 245-258.
Hill MO, Bunce RGH, Shaw MW. 1975. Indicator Species Analysis, A Divisive Polythetic Method of Classification, and its Application to a Survey of Native Pinewoods in Scotland. J Ecol 63: 597-613.
Hill MO, Smilauer P. 2005. TWINSPAN for Windows version 2.3. Centre for Ecology and Hydrology & University of South Bohemia, Huntingdon & Ceske Budejovice.
Hill MO. 1979b. TWINSPAN - a FORTRAN program for ar- ranging multivariate data in an ordered two-way table by classi- fication of the individuals and attributes. Cornell University, Ithaca, New York.
IPCC. 2006. 2006 IPCC Guidelines for National Greenhouse Gas Inventories. Prepared by the National Greenhouse Gas Inventories Programme. In: Institute for Global Environmental Strategies (IGES) (Eggleston HS, Buendia L, Miwa K, Ngara T, Tanabe K, eds). Japan.
IPCC. 2013a. Summary for Policymakers. In: Climate Change 2013: The Physical Science Basis. Contribution of Working Group I to the Fifth Assessment Report of the Intergovernmen- tal Panel on Climate Change (Stocker TF, Qin D, Plattner GK, Tignor M, Allen SK, Boschung J, Nauels A, Xia Y, Bex V, Midgley PM, eds). Cambridge University Press, Cambridge, United Kingdom and New York, NY, USA.
Jonsson M, Wardle DA. 2009. Structural equation modelling re- veals plant-community drivers of carbon storage in boreal forest ecosystems. Biol Lett 6: 116-119.
Lei X, Wang W, Peng C. 2009. Relationships between stand growth and structural diversity in spruce-dominated forests in New Brunswick, Canada. Can J For Res 39: 1835-1847.
Magurran AE. 1988. Ecological diversity and its measurement.
Springer, Netherlands.
Mandal RA, Dutta IC, Jha PK, Karmacharya S. 2013.
Relationship between Carbon Stock and Plant Biodiversity in Collaborative Forests in Terai, Nepal. International Scholarly Research Notices Botany 13: 1-7.
McElhinny C, Gibbons P, Brack C, Bauhus J. 2005. Forest and woodland stand structural complexity: Its definition and measurement. For Ecol Manage 218: 1-24.
McKinley DC, et al. 2011. A synthesis of current knowledge on forests and carbon storage in the United States. Ecol Appl 21:
1902-1924.
Messier CC, et al. 2013. Managing forests as complex adaptive systems: building resilience to the challenge of global change.
Routledge, Oxon, UK.
Midgley GF, Bond WJ, Kapos V, Ravilious C, Scharlemann JPW, Woodward FI. 2010. Terrestrial carbon stocks and biodiversity:
key knowledge gaps and some policy implications. Current Opinion in Environmental Sustainability 2: 264-270.
Misra R. 1968. Ecology Workbook. Oxford and IBH, Kolkata.
Pande PK. 1999. Comparative vegetation analysis of Sal (Shorea robusta) regeneration in relation to their disturbance magnitude in some Sal forests. Trop Ecol 40: 51-61.
Paquette A, Messier C. 2010. The role of plantations in managing the world’s forests in the Anthropocene. Fron in Ecol Envir 8:
27-34.
Paquette A, Messier C. 2011. The effect of biodiversity on tree pro- ductivity: from temperate to boreal forests. Glob Ecol Biog 20:
170-180.
Peet RK. 1974. The Measurement of Species Diversity. Annu Rev Ecol Syst 5: 285-307.
Rajput SS, Shukla NK, Gupta VK, Jain JD. 1996. Timber me- chanics: strength, classification and grading of timber. Indian Council of Forestry Research and Education, Dehradun.
Ramachandran A, Jayakumar S, Haroon RM, Bhaskaran A, Arockiasamy DI. 2007. Carbon sequestration: estimation of car- bon stock in natural forests using geospatial technology in the Eastern Ghats of Tamil Nadu, India. Current Science 92:
323-331.
Rawat GS, Bhainsora NS. 1999. Woody vegetation of Shivaliks and outer Himalayas in Northern-Western India. Trop Ecol 40:
119-128.
Rhemtulla JM, Mladenoff DJ, Clayton MK. 2009. Historical for- est baselines reveal potential for continued carbon sequestration.
Proceedings of the National Academy of Sciences of the United States of America 106: 6082-6087.
Scherer-Lorenzen M, et al. 2005. The design of experimental tree plantations for functional biodiversity research. In: Forest Diversity and Function: Temperate and Boreal Systems.
(Schere-Lorenzen M, et al. eds). Vol 176. Ecological Studies.
Springer, Berlin, Heidelberg, New York.
Shannon CE, Wiener W. 1963. The mathematical theory of communities. University of Illionis Press, Urbana.
Sharma CM, Baduni NP, Gairola S, Ghilidiyal SK, Suyal S. 2010.
Tree diversity and carbon stocks of some major forest types of Garhwal Himalaya, India. Forest Ecology and Management 260: 2170-2179.
Staudhammer CL, Lemay VM. 2001. Introduction and evaluation of possible indices of stand structural diversity. Can J For Res 31: 1105-1115.
Szwagrzyk J, Gazda A. 2007. Above-ground standing biomass and
tree species diversity in natural stands of Central Europe. J Veg Sci 18: 555-562.
Thompson ID, et al. 2012. Forest biodiversity, carbon and other ecosystem service: relationships and impacts of deforestation and forest degradation. In: Understanding Relationships Between Biodiversity, Carbon, Forests and People: The Key to Achieving REDD+ Objectives (Parrotta JA, Wildburger C, Mansourian S, eds). International Union of Forest Research Organizations World Series Volume 31. Vienna, Austria, pp 21-52.
Timilsina N, Ross MS, Heinen JT. 2007. A community analysis of sal (Shorea robusta) forests in the western Terai of Nepal. For Ecol Manage 241: 223-234.
Whittaker RH. 1972. Evolution and Measurement of Species Diversity. Taxon 21: 213-251.