한국정보통신학회논문지 Vol. 24, No. 2: 219~224, Feb. 2020
이진 분류를 위하여 거리계산을 이용한 특징 변환 기반의 가중된 최소 자승법
장세인1·박충식2*
Weighted Least Squares Based on Feature Transformation using Distance Computation for Binary Classification
Se-In Jang1 · Choong-Shik Park2*
1Full-Time Researcher, Department of Statistics and Applied Probability, National University of Singapore, 117546 Singapore
2*Professor, Department of Smart IT, U1 University, Asan-si, Chungcheongbuk-do, 31415 Korea
요 약
이진 분류(binary classification)는 머신러닝(machine learning) 분야에서 많이 다루어진 주제이다. 게다가 이진 분 류는 다중 분류로 쉽게 발전될 수 있는 중요한 분야이다. 머신러닝 방법들을 적용할 때에 전처리(preprocessing)이나 특징 추출(feature extraction)과 같은 작업이 필수적이다. 이는 분류기 성능을 향상시키기 위한 중요한 작업이다. 본 논문에서는 가중된 최소 자승법을 기반으로 새로운 머신러닝 방법을 제안한다. 또한, 특징 변환시킬 수 있는 새로운 가중치 계산 방법을 제안한다. 이를 통해 특징 변환과 동시에 학습을 진행할 수 있는 방법을 제안한다. 본 제안을 다 섯 개의 머신러닝 데이터베이스에서 실험을 진행하였으며 이 데이터베이스에서 우수한 성능을 얻을 수 있었다.
ABSTRACT
Binary classification has been broadly investigated in machine learning. In addition, binary classification can be easily extended to multi class problems. To successfully utilize machine learning methods for classification tasks, preprocessing and feature extraction steps are essential. These are important steps to improve their classification performances. In this paper, we propose a new learning method based on weighted least squares. In the weighted least squares, designing weights has a significant role. Due to this necessity, we also propose a new technique to obtain weights that can achieve feature transformation. Based on this weighting technique, we also propose a method to combine the learning and feature extraction processes together to perform both processes simultaneously in one step. The proposed method shows the promising performance on five UCI machine learning data sets.
키워드 : 이진 분류, 거리계산, 특징 변환, 가중된 최소 자승법
Keywords : Binary Classification, Distance Computation, Feature Transformation, Weighted Least Squares
Received 25 November 2019, Revised 3 December 2019, Accepted 12 December 2019
* Corresponding Author Choong-Shik Park (E-mail:[email protected], Tel:+82-41-536-5723) Professor, Department of Smart IT, U1 University, Asan-si, Chungcheongbuk-do, 31415 Korea
Open Access http://doi.org/10.6109/jkiice.2020.24.2.219 print ISSN: 2234-4772 online ISSN: 2288-4165
Ⅰ. 서 론
머신러닝이 빠르게 발전함에 따라 영상, 텍스트 등 다 양한 분야에 적용되고 있다 [1, 2, 3, 4, 5, 6]. 최소 자승 법(Least Squares, LS) 방법은 회귀 문제(regression problem)에 자주 사용되는 방법 중 하나이다 [7]. 이 LS 방법은 회기 문제뿐만 아니라, 분류 문제(classification problem)에서도 우수한 성능을 가진다. 하지만 이 LS 방 법은 모든 학습 데이터(training data)가 믿을 만하다는 가정하에 만들어진 방법이다. 이러한 가정하에 실세계 데이터에 적용된다면 잘못된 솔루션이 도출될 수 있다.
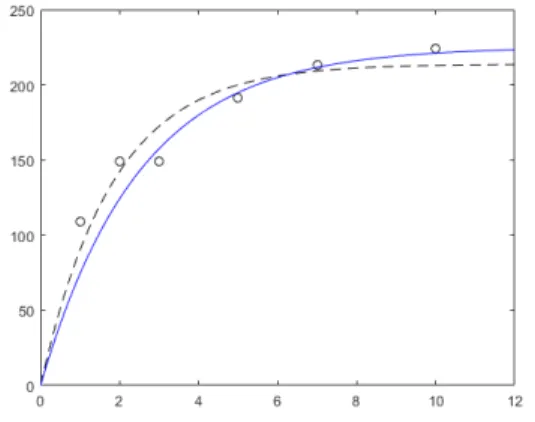
위와 같은 단점을 극복하기 위해 가중된 최소 자승법 (Weighted Least Sqaures, WLS) 방법론이 개발되었다 [8]. 이 WLS 방법은 LS 방법에 망각 인자(forgetting factor)를 적용하여 신뢰할 수 있는 데이터에는 높은 가 중치를 주고, 신뢰할 수 없는 데이터에는 낮은 가중치를 준다는 아이디어로부터 시작되었다. 그림 1에 가중되지 않은(non-weighted) 방법과 가중된(weighted) 최소 자승 법의 간단한 예를 나타내었다. 이 간단한 회귀분석 예제 에서 가중된 방법이 더 나은 결과를 나타내는 것을 볼 수 있다. 또한, 이 WLS 방법은 발전되어 망각 인자 뿐만 아니라 다양한 가중치를 이용하여 각 목적에 맞는 솔루 션을 얻을 수 있는 장점이 있다.
본래 데이터에는 노이즈가 있다는 가정하에 노이즈 제거 방법(noise reduction)이나 특징 추출(feature extraction)과 같은 방법이 학습 전에 적용되곤 한다. 또 한 특징 추출은 각 데이터 차원에 맞는 특징 추출 방법 들이 있다. 예를들어 1차원이나 2차원에만 적용되는 특 징 추출 방법들(Histogram of Oriented Gradients, Local Binary Patterns)이 있다.
본 논문에서는 가중치를 이용하여 특징 변환(feature transformation)을 달성할 수 있는 방법을 제안한다. 또 한, 이 가중치 기반의 특징 변환과 동시에 학습을 할 수 있는 방법인 가중된 최소 자승법을 이용하여 달성한다.
본 논문은 다음과 같이 구성되어 있다: 2장에서는 본 논 문에서 사용될 최소 자승법과 가중된 최소 자승법을 간 단히 소개한다. 3장에서는 거리계산을 기반의 가중치를 이용하여 특징 변환을 달성할 수 있는 방법을 제안하고
Fig. 1 Comparison of non-weighted and weighted regression: circle, 'o', indicates each of data samples, dashed lines, ‘:’ indicate non-weighted regression, and solid lines '|' indicates weighted regression.
Ⅱ. 관련연구
2.1. 최소 자승법(Least Squares)
최소 자승법(Least Squares, LS)은 회귀 분석(regression analysis)에 가장 많이 사용되는 방법들 중 하나이다 [6].
이 방법은 실제 값과 관측된 값의 차이를 최소화 하는 방법으로 식 1과 같이 나타낼 수 있다:
(1)
는 데이터를 가진 행렬이고 는 실제 값인 레이블 값이다. 는 정규화(regularization)을 위한 값이고 는 단위 행렬(identity matrix)이다.
2.2. 가중된 최소 자승법(Weighted Least Squares) 위에 소개된 최소 자승법은 모든 데이터가 신뢰할 수 있다는 가정하에 얻어진 솔루션이다. 하지만 실제 데이 터에서는 노이즈나 신뢰할 수 없는 데이터가 얻어질 수 있다. 이러한 데이터에 대하여 가중치를 줄 수 있는 가 중된 최소 자승법(Weighted Least Squares, WLS)은 식 2 와 같이 나타낸다[7]:
(2)
Ⅲ. 거리계산을 이용한 특징 변환 기반의 가중된 최소 자승법
3.1. 거리계산 기반의 가중치 계산(distance based weight computation)
본 섹션에서는 어떻게 거리계산을 이용하여 가중치 를 얻어내는 가에 대한 것을 설명할 것이다. 먼저 데이 터 그룹 1, 과 데이터 그룹 2, 이 있다고 가정하자.
1) 데이터 그룹 1과 데이터 그룹 2의 평균을 다음과 같이 계산한다:
(3)
(4) 2) 데이터 그룹 1과 데이터 그룹 2에서 평균을 이용하여
각 그룹들의 평균 값과의 거리를 다음과 같이 계산한다:
(5)
(6) 3) 각 데이터에 벡터 노름을 적용하고, 가중치를 0과 1 사이로 만들어 주기 위해 최소-최대 표준화(min-max normalization)를 다음과 같이 적용한다:
(7)
(8) 4) 평균 값과 가까운 데이터에게는 1에 가까운 값을, 먼
데이터에게는 0에 가까운 값을 주기 위해 표준화된 값에 1을 다음과 같이 빼준다:
(9)
(10)
수식 (10)과 (11)이후에도 1만을 이용하여 계산하였 으므로 가중치 값들은 아직도 0과 1사이의 값으로 표현 되고 있다.
3.2. 거리계산 가중치를 이용한 가중된 최소 자승법 위에서 구성된 가중치, 과 를 이용하여 최종 가중치를 다음과 같이 계산한다:
(11)
여기서 얻어진 를 수식 (2)에 이용하면 본 논문에 서 제안하는 거리계산을 이용한 특징 변환 기반의 가중 된 최소 자승법 솔루션을 얻을 수 있다.
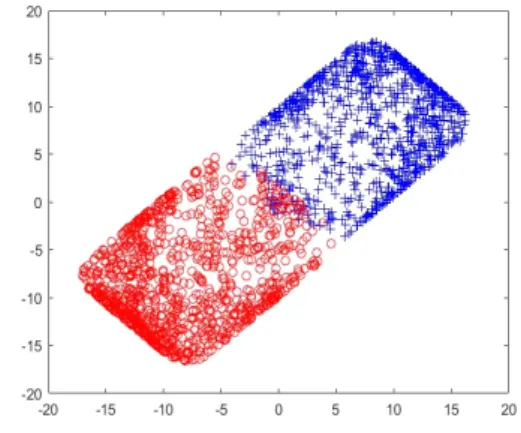
Fig. 2 Gaussian distributed original training data: The data samples, 'o'(red), indicate class 1, and the data samples, '+'(blue), indicate class 2 for the binary classification problem.
Fig. 3 Transformed training data (l1-norm): The data samples, 'o'(red), indicate class 1, and the data samples, '+'(blue), indicate class 2 for the binary classification problem.
Fig. 4 Transformed training data (l2-norm): The data samples, 'o'(red), indicate class 1, and the data samples, '+'(blue), indicate class 2 for the binary classification problem.
Fig. 5 Transformed training data (l∞-norm): The data samples, 'o'(red), indicate class 1, and the data samples, '+'(blue), indicate class 2 for the binary classification problem.
3.3. 사례 연구(a case study)
본 섹션에서는 제안한 알고리즘이 어떻게 동작하는 지 관찰하기 위해 이진 분류(binary classification)을 가 정한 2개의 가우시안 분포를 가진 2차원 데이터를 생성 하였다. 제안하는 방법이 이 생성된 데이터에 적용되었 을 때 어떻게 변환되는지 살펴본다.
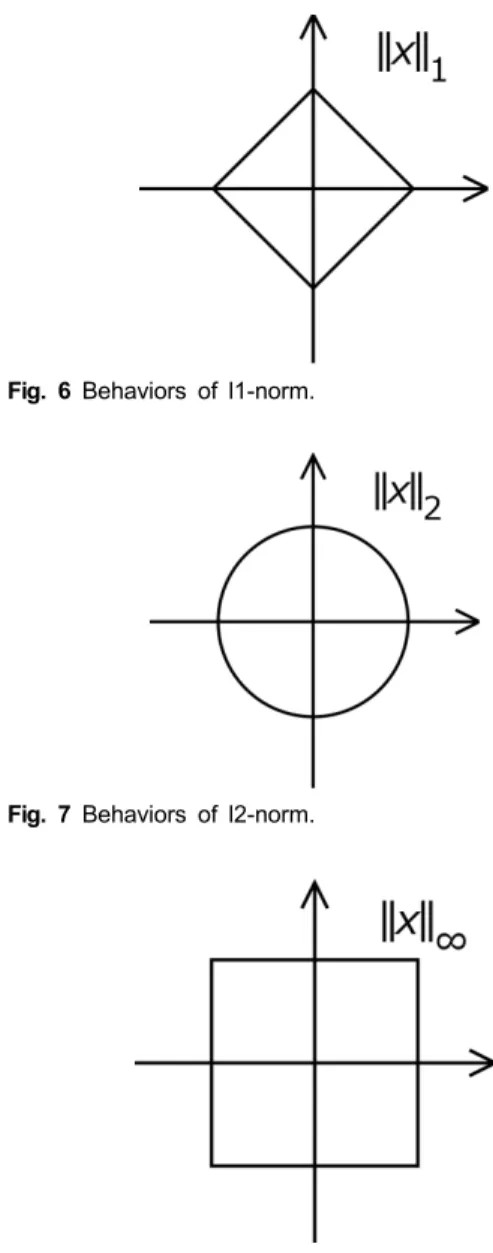
그림 2에서는 다른 평균 값을 가진 두 개의 다른 가우 시안 분포가 그려져있다. 이 분포를 제안하는 가중치 계 산에 적용하면 그림 3, 그림 4, 그림 5와 같은 데이터 변 환이 이루어진다. 이와 같은 데이터 변환의 모양은 벡터 노름 계산으로부터 오는 것으로 분석된다. 그림 6, 그림
Fig. 6 Behaviors of l1-norm.
Fig. 7 Behaviors of l2-norm.
Fig. 8 Behaviors of l∞-norm.
Ⅳ. 실 험
4.1. 실험 설정
본 논문에서는 실험을 위해 머신러닝에서 자주 사용 되는 5개의 공개된 UCI 데이터베이스를 이용하였다
또한 모든 데이터베이스는 이진 분류 문제에 맞는 데이 터베이스를 선택하였다.
는 정규화를 위한 값으로 0.0001로 설정되었다. 는 긍정적 클래스를 나타내는 과 부정적 클래스를 나 타내는 값을 가지도록 설정하였다. 또한 벡터 노름 을 적용할 때에는 노름 2를 적용하였다.
Table. 1 Properties of UCI data sets Data Sets Number of
Samples
Number of Features
Wpbc 194 33
Sonar 208 60
Spectf-Heart 267 44
Australian 690 14
Mammogramphic 830 5
Table. 2 Accuracy Comparison on UCI data sets
Data Sets LS Proposed
Wpbc 53.50 56.60
Sonar 66.95 64.70
Spectf-Heart 77.75 81.25
Australian 81.00 83.00
Mammogramphic 67.50 80.95
Average 69.34 73.30
4.2. 결과
본 논문에서는 실험을 위해 5개의 공개된 UCI 데이 터베이스를 이용하였다. 성능을 계산하기 위해 각 데이 터를 2개의 부분인 학습 부분과 테스트 부분으로 나누 어 총 10번의 반복을 통해 평균 정확도를 구하였다. 각 데이터베이스에 해당하는 평균 값은 표 2에 나열하였 다. 정확도 측면에서 총 5개의 데이터베이스 중에 4개의 데이터베이스에서 제안하는 방법이 LS방법보다 더 좋 은 성능을 얻을 수 있었다. 평균 값을 비교하였을 때 LS 방법은 69.34%의 정확도를 얻었으며, 제안된 방법론은 73.3%의 정확도를 얻었다. 제안된 방법론이 3.96% 더 높은 정확도를 얻었다.
Ⅴ. 결 론
본 논문에서는 거리계산을 이용한 특징 변환 기반의
가중된 최소 자승법 방법이 제안되었다. 이 제안된 방법 은 다섯 개의 UCI 데이터베이스에서 최소 자승법 방법 과 함께 평가되고 비교되었다. 이를 통해 제안 방법이 최소 자승법 방법보다 우수한 결과를 얻을 수 있음을 보 였다. 제안된 방법은 오프라인 학습 기반으로 개발되었 기 때문에 실시간 환경에 적용되기 어렵다는 단점이 있 다. 이 방법을 실시간 환경에 적용할 수 있도록 온라인 학습 기반으로 개발할 것이며 이를 위해 새로운 수식을 도출할 것이다.
ACKNOWLEDGEMENT
This work was supported by the Ministry of Education of the Republic of Korea and the National Research Foundation of Korea (NRF- 2017S1A6A3A01078538)
REFERENCES
[ 1 ] G.-Y. Lim, and Y.-B. Cho, “The Sentence Similarity Measure Using Deep-Learning and Char2Vec,” Journal of the Korea Institute of Information and Communication Engineering, vol. 22, no. 10, pp. 1300-1306, Oct. 2018.
[ 2 ] S. I. Hassan, D. L. Minh, S. Im, K. Min, Ju. Nam, and H.
Moon, “Damage Detection and Classification System for Sewer Inspection using Convolutional Neural Networks based on Deep Learning,” Journal of the Korea Institute of Information and Communication Engineering, vol. 22, no.
3, pp. 451-457, Mar. 2018.
[ 3 ] W. Lee, S. H. Kim, J. Ryu, and T.-W. Ban, “Fast Detection of Disease in Livestock based on Deep Learning,” Journal of the Korea Institute of Information and Communication Engineering, vol. 21, no. 5, pp. 1009-1015, May. 2017.
[ 4 ] C.-W. Son, and S.-B. Lee, “Realization of home appliance classification system using deep learning,” Journal of the Korea Institute of Information and Communication Engineering, vol. 21, no. 9, pp. 1718-1724, Sep. 2017.
[ 5 ] W. Lee, T.-W. Ban, S. H. Kim, and J. Ryu, “Neighbor Discovery for Mobile Systems based on Deep Learning,”
Journal of the Korea Institute of Information and Communication Engineering, vol. 22, no. 3, pp. 527-533, Mar. 2018.
[ 6 ] V. Srinidhi, “Classification of User Behaviour in Mobile Internet,” Asia-pacific Journal of Convergent Research Interchange, HSST, ISSN : 2508-9080, vol. 2, no. 2, pp.
9-18, Jun. 2016.
[ 7 ] A. M. Legendre, Nouvelles methodes pour la determination des orbites des cometes. F. Didot, 1805.
[ 8 ] A. C. Aitken, “IV. On least squares and linear combination of observations,” Proceedings of the Royal Society of Edinburgh, vol. 55, pp.42-48, 1936.
[ 9 ] M. Lichman. UCI machine learning repository, 2013.
[Internet]. Available: http://archive.ics.uci.edu/ml.
장세인(Se-In Jang)
연세대학교 대학원 전기전자공학과 공학박사 싱가폴국립대학 연구원 (현재)
※관심분야 : 인공지능, 머신러닝, 온라인 학습
박충식(Choong-Shik Park)
연세대학교 대학원 전자공학과 공학박사