Received: March 21, 2018 Revised: July 6, 2018 Accepted:July 19, 2018
OPEN ACCESS
HORTICULTURAL SCIENCE and TECHNOLOGY 36(6):820-830, 2018
URL: http://www.kjhst.org pISSN : 1226-8763 eISSN : 2465-8588
This is an Open Access article distributed under the terms of the Creative Commons Attribution Non-Commercial License which permits unrestricted non-commercial use, distribution, and reproduction in any medium, provided the original work is properly cited.
Copyrightⓒ2018 Korean Society for Horticultural Science.
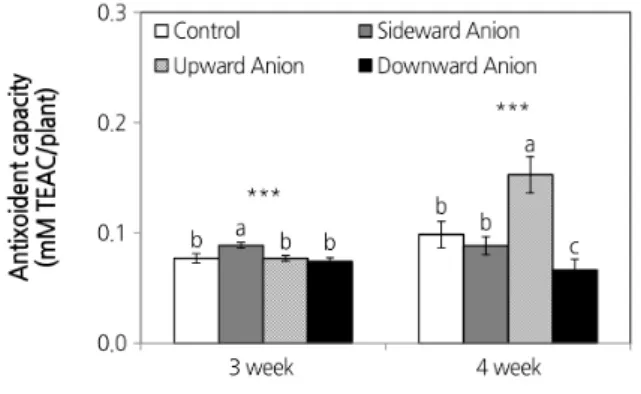
Growth Characteristics, Antixoident Capacity and Total Phenolic Content of Lettuce According to Generation Position of Air Anion in a Closed-type Plant Factory
Jin-Ho Won 1† , Jung Hyun Lee 3† , Byeong Hyo Cho 3 , Chung-Su Han 1 , and Tae Hwan Kang 2*
1
Department of Biosystems Engineering, Chungbuk National University, 1 Chungdae-ro, Seowon-gu, Cheongju, Chungbuk 28644, Korea
2
Major in Bio-Industry Mechanical Engineering, Kongju National University, 54 Daehak-ro,Yesan-eup, Yesan-gun, Chungnam 32439, Korea
3
Laboratory of Agricultural and Food Process Engineering, Hokkaido University, 8 Kita, 5 Nishi, Kita-ku, Sapporo, Hokkaido 060-0808, Japan
*Corresponding author: [email protected]
†