Characteristics of Accelerations in Turbulent Channel Flow
Kyongmin Yeo and Changhoon Lee
난류 채널 유동에서의 가속도 특성
여 경 민† · 이 창 훈*
Key Words : Acceleration, Turbulent channel flow, Skewness, Intermittency Abstract
The intermittent characteristics of fluid particle accelerations near the wall are investigated with the higher-order statistics and the probability density functions (PDF) by using a direct numerical simulation of turbulent channel flow. Also, the behaviors of acceleration associated with the coherent structures are discussed. The flatness factor of wall-normal acceleration is extremely high near the wall and it exceeds the previously reported value obtained in isotropic turbulence. The presence of the wall seems to make the accelerations more intermittent and the associated mechanism is explained with the PDFs. The skewness factor of wall-normal acceleration indicates that accelerations are associated with the streamwise vortices.
Notation u
i: velocity vector
a
i: acceleration vector x : streamwise direction y : wall-normal direction z : spanwise direction p : pressure
u
τ: shear velocity t : time
δ : channel half-width
Re
τ: Reynolds number based on u
τand δ Re
λ: Taylor-scale Reynolds number
+
: non-dimensionalized variable by wall variables
1. Introduction
A acceleration in turbulent flow is a natural property, which arises from the motion of a fluid particle, and
plays an important role in the study of turbulent mixing and dispersion. Particularly, it is related to the generation of Reynolds stress (Bernard and Handler, 1990), process of collision-coalescence of cloud droplets (Shaw and Oncley, 2001), pollutant transport (Yeung, 1997), and construction of a stochastic model (Yeung, 1997;
Sawford and Yeung, 2000; Reynolds, 2003). Due to the difficulties in measurements (La Porta et al., 2001), the characteristics of acceleration are not studied so much relative to its importance. Most previous studies were concentrated on the development of a stochastic model and the scaling of the acceleration in isotropic turbulence.
The physics of the acceleration is not well understood so far.
Recently, Vedula and Yeung (1999) argued that the pressure gradient fluctuations might be characterized as intensely intermittent and the deviation of pressure gradient statistics from classical Kolmogorov scaling seemes to be caused by the intermittency. But they could not show any physical mechanisms. La Porta et al.
(2001) succeeded in measuring the acceleration in isotropic turbulence. They showed that the acceleration is a highly intermittent variable and extremely large accelerations often arise during a helical motion. Also, they discussed that the coherent structures seems to be associated with the large acceleration events. In turbulent
†
Yonsei University, Dept. of Mechanical Eng.
E-mail : [email protected] TEL : (02)2123-2846
*
Yonsei University, Dept. of Mechanical Eng.
E-mail : [email protected]
(a)
<a >
-15 -10 -5 0 5 10
Eul. ax Eul. ay Eul. az Lag. ax Lag. ay Lag. az
(b)
y/ δ
<a
2 i>
1/20 0.25 0.5 0.75 1
0 5 10 15 20 25
Fig. 1 Comparisons between eulerian and lagrangian accelerations. (a) mean accelerations; (b) r.m.s.
accelerations.
channel flow, the presence of the wall makes turbulent field inhomogeneous, which it is easy to find the coherent structures. Our goal is to show the intermittent characteristics of the acceleration in turbulent channel flow, which is expected to be different from the one in isotropic turbulence, and find the relation between the coherent structures and the accelerations. For our goal, we obtained the eulerian acceleration field by using direct numerical simulation.
2. Numerical Method
Direct numerical simulation of turbulent channel flow was performed to evaluate accelerations. Navier-Stokes equation was solved by a spectral method. A dealiased Fourier method was used in the horizontal plane and the Chebyshev-Tau method in the wall-normal direction. The time advancement was carried out by a semi-implicit scheme using the Crank-Nicholson and an explicit third order Runge-Kutta methods for viscous and nonlinear terms, respectively. All results presented in section 3 are obtained for the case of Re
τ= 180. A computational domain was 4
πδ× 2
δ× 4
πδ/ 3 in streamwise, wall- normal, and spanwise directions with the half gap of the channel, δ. And a resolution of 128 × 129 × 128 was used.
The acceleration fields are calculated by an eulerian
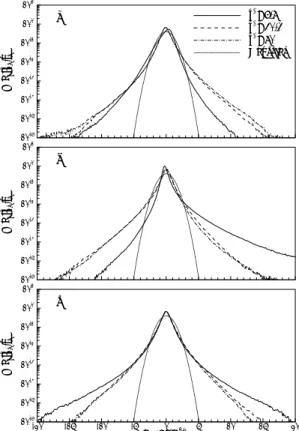
ai/ <a2i>1/2 P(az;yo,to)
-20 -15 -10 -5 0 5 10 15 20
10-6 10-5 10-4 10-3 10-2 10-1 100 101
(c) P(ay;yo,to)
10-6 10-5 10-4 10-3 10-2 10-1 100 101
(b) P(ax;yo,to)
10-6 10-5 10-4 10-3 10-2 10-1 100 101
y+=7.8 y+=30.3 y+=80 Gaussian (a)
Fig. 2 PDFs of accelerations at different wall distances.
(a) x components; (b) y components; (c) z components
manner. From the Navier-Stokes equation,
j j
i i
i i
x x
u x
p Dt
a Du
∂
∂ + ∂
∂
− ∂
=
≡ 2
Re
1
. (1)
Hereafter, all variables are non-dimensionalized by the shear velocity u
τand δ. The acceleration was calculated by the sum of the pressure gradient and the viscous force.
To certify the results, the acceleration fields obtained by equation (1) were compared to the one by lagrangian manner. Figure 1 represents the statistics obtained by two different methods for the case of Re
τ= 200. The mean accelerations are almost identical, and the root mean square values of accelerations show a little difference.
The difference seems to be caused by the errors originated from the interpolation scheme and the time derivative of the lagrangian velocity needed to obtain acceleration.
3. Results and Discussion
3.1 Acceleration intermittency
The PDFs of acceleration at different wall coordinates
are presented in Fig. 2. The PDFs have long tails relative
arms
0 5 10 15 20 25
(a)
S(ai)
-5 0 5 10
(b)
y+ F(ai)
0 50 100 150
0 25 50 75 100 125 150
(c)
Fig. 3 Higher-order statistics of accelerations: ─, x components; ---, y components;
……, z components. (a) r.m.s. accelerations, (b) skewness factors, (c) flatness factors. Solid and hollow symbols in (a) denote the pressure gradient and viscous force terms, respectively:
●○
, x-components;
▲ △, y-components;
▼ ▽, z- components.
to Gaussian distribution as reported by Voth et al. (2002).
The PDFs of the spanwise component of accelerations appear almost symmetric regardless of the wall distance and the PDFs of streamwise and wall-normal components change shapes with the wall coordinates.
The PDF of streamwise component at y
+= 7.8 is negatively skewed whereas the normal acceleration is positively skewed. This tendency becomes opposite as the wall coordinate increases.
For the wall-normal acceleration, an extreme event in which the fluctuation is about 50 times larger than the r.m.s occurs by the probability of about 10
-7. It exceeds an extreme events observed in isotropic turbulence. The maximum flatness factor observed around y
+≈ 5 in Fig.
3(c) is about 120 and it also supprasses the result obtained in isotropic case, about 80 at Re
λ≈ 690 (La Porta et al., 2001).
The acceleration can be decomposed into the pressure
y/δ
0 0.1 0.2 0.3 0.4
0.5 ωx
100 60 20 -20 -60 -100
(a) v=2
z/δ
y/δ
0.7 0.9 1.1 1.3 1.5
0 0.1 0.2 0.3 0.4
0.5 |a|
100 80 60 40 20 0 a=100
(b)
Fig. 4 Acceleration fields around a vortex in y-z plane.
(a) a single vortex structure, (b) acceleration fields converged into the center of a vortex.
gradient, which is irrotational, and the viscous force, which is solenoidal for incompressible flow (Vedula and Yeung, 1999). The viscous force is negligible compared to the pressure gradient in isotropic turbulence at high Reynolds number. Thus, the pressure gradient seems to be the main source of intermittency appeared in isotropic turbulence. As shown in Fig. 3(a), viscous force terms of spanwise and normal components are comparable to the pressure gradients very near the wall and decreases rapidly, while the streamwise component is larger till y
+≈ 20. At y
+≈ 7, the r.m.s of streamwise component reaches a maximum value and the viscous force is the main contributor to the acceleration. The flatness at this layer is small and the PDF also shows shorter tail compared to the spanwise and the normal components.
Thus, the viscous force is less intermittent than the pressure gradient and the intermittency of the acceleration mainly comes from the pressure gradient like the case of isotropic turbulence.
3.2 Behaviors of Accelerations
Fig. 4 displays instantaneous fields of velocities and accelerations near the wall in y-z plane. It is obvious that the accelerations are converged to the center of the vortex core. The fact that the skewness factor of normal acceleration becomes zero at y
+≈ 20 is a strong evidence that above mentioned tendency is not a special case. The center of the streamwise vortex, which is a common structure in turbulent channel flow, is located at y
+≈ 20 with radius r
+≈ 15 on average (Kim et al., 1987). Thus, the skewness factor of normal component is positive below the center of the streamwise vortex and vice versa.
The long positive tail of the normal acceleration at y
+≈ 7.8, also, can be understood with the streamwise vortex.
The accelerations around a vortex is almost the same, but
x/δ
z/δ
5 5.2 5.4 5.6
0.8
1.0
1.2
1.4
1.6
λ2 0 -0.02 -0.04 -0.06 -0.08 -0.1 a = 100
-5
-4 x/δ
1
z/δ 1.5
ωx
150 100 50 0 -50 -100 Meanflow
Fig. 5 A hairpin vortex and associated acceleration field in x-z plane.
the r.m.s of normal acceleration at y
+≈ 7.8 is about the half of the maximum value at y
+≈ 30. The PDF at this layer shows a maximum value of 35 r.m.s relative to the maximum value of 16 r.m.s at y
+≈ 30. From the lagrangian point of view, the wall-normal motion induced by the near-wall structures is greatly suppressed by the wall, specially motion toward the wall, causing large positive normal acceleration and it seems the main source of the large flatness factor.
The pressure tends to have a local minimum in a vortex (Jeong and Hussain, 1995). Hence, It is reasonable that the directions of spanwise and normal accelerations mainly governed by pressure gradients are toward the center of a vortex. For the case of the streamwise acceleration, the viscous force is larger than the pressure gradient near the wall, and it is not negligible till y
+reaches 30. Due to the viscous force, the streamwise acceleration shows different behavior relative to the other two components. The peak of the r.m.s.
appears at y
+≈ 7, which is due to the viscous force, and the pressure gradient has a peak at y
+≈ 40. The peak of acceleration seems associated with the high-speed streak while the peak of the pressure gradient is linked to the coherent structures. The coherent structures in turbulent channel flow are thought as highly elongated quasi- streamwise structures (Jeong et al., 1997). The streamwise pressure gradients in this kind of structures are not so large compared to the other two components.
Thus, the r.m.s. of streamwise pressure gradient is relati- vely small inside the structures. The main contributor of the pressure gradient at y
+≈ 40 seems a hairpin vortex.
Fig. 5 represents a hairpin vortex and the corresponding acceleration field at y
+≈ 40. The vortex structure is educed by using the definition proposed by Jeong et al.
(1995). Along the right tail, the streamwise accelerations are not so large as the spanwise accelerations. But on the top of the hairpin, strong streamwise accelerations can be observed, which seem to contribute to the peak of the
pressure gradient. Near the center of the channel, the r.m.s and the flatness factors of each components are almost the same, indicating that turbulent field is nearly isotropic.
4. Conclusions
A direct numerical simulation of turbulent channel flow at Re
τ= 180 was performed to investigate the characteristics of accelerations. A spectral method and a semi-implicit time advancement scheme are used for the spatial and temporal discretisation, respectively. The Eulerian acceleration fields are calculated by summing up the pressure gradient and the viscous force.
The highly intermittent characteristic of the accelera- tion is investigated by PDF analysis. The accelerations in turbulent channel flow show an extreme event, which has not been observed in previous studies performed in isotropic turbulence. The intermittent characteristics of the acceleration mainly come from the pressure gradient, which is irrotational.
From the instantaneous fields, it is observed that the spanwise and the normal accelerations are converged to the center of a vortex. It seems due to the pressure local minimum appeared in the streamwise vortex. The skewness factor of normal acceleration, which crosses zero at the center of the streamwise vortex, presents strong evidence supporting this tendency. The stream- wise acceleration, which the viscous part is relatively large near the wall, shows somewhat different behavior.
The peak of the streamwise pressure gradient comes from a hairpin vortex. And it is obvious that the accelerations are associated with the coherent structures as depicted by Voth et al. (2002). Far from the wall, the flatness factors show nearly homogeneous behavior.
References