S. Y. Lee ( ) ・ B. H. Han ・ A. Y. Cho
(National Institute of Horticultural & Herbal Science, Rural Development Administration, Suwon 441-310, Korea) e-mail: [email protected]
Inheritance and expression of transgene in SOD2-Transgenic petunia descendants and their morphological traits
Su Young Lee ・ Bong Hee Han ・ A Young Cho
Received: 9 September 2009 / Accepted: 19 September 2009
ⓒKorean Society for Plant Biotechnology
Abstract This study was conducted to determine the inher- itance and expression of transgene in descendants (T
1to T
2generation) of SOD2-transgenic petunia by PCR and RT-PCR analysis. The trangene was segregated as Mendelian inheritance pattern (3:1 or 1:0) in most of T
1and T
2generation lines.
Transgenic homozygous lines were obtained in T
2generation.
It was identified that the transgene expressed stably in ex- amined all plants of 6 T
2lines. The representative mor- phological traits (plant height, flower diameter, and flower color) of T
2plants were compared with those of non-trans- genic plants.
Keywords PCR, RT-PCR, Mendelian, Segregation, Pattern
Introduction
Current global climate change urges us to develop cultivars resistant to environmental stress (or abiotic stress) in many crops. However, it is not easy to develop new cultivars resistant to the abiotic stress through conventional breeding technique. So, many researchers have studied to develop plants resistant to abiotic stresses through transfer of super- oxide dismutase (SOD) or ascorbate peroxidase (APX) or NDP kinase (NDPK) genes in many crops (Fang et al. 2002;
Moon et al. 2003; Tang et al. 2004a; Tang et al. 2004b; Kim et al. 2005; Tang et al. 2007). Bhatnagar-Mathur et al. (2008) reported a review paper on transgenic approaches for abiotic stress tolerance in plants. One of characteristics, which should be improved in petunia, is resistance to abiotic stresses such as rainfall, humidity, and air pollution. In our previous study, we
got T
1seeds and proved their resistance to abiotic stress (Lee et al. 2009) after we tried the transfer of MnSOD (SOD2) gene into purebred lines of petunia. Meanwhile, the success of plant genetic transformation needs to be followed by the stable inheritance and expression of a transgene in descendants (Zhang et al. 2005). Hence, this study examined whether the transgene transmits to T
1or not, and we let T
1plants, which were identified as transmitter of the transgene, self-pollinated to get T
2generation. It was also investigated whether the transgene transmitted to and expressed in T
2plants or other- wise. Furthermore, it was investigated whether their mor- phological traits changed in comparison with non-transgenic plants or not.
Materials and Methods Plant materials
T
1four lines (A2-36-1-1-2, A2-36-2-1-1, A2-19-3-1, and A2-19-4-1) and T
2six lines (A2-36-1-1-2-5, A2-36-2-1-1-35, A2-19-3-1-8, A2-19-3-1-37, A2-19-4-1-15, and A2-19-4-1-43) were used as plant materials. T
1generation was obtained by selfing SOD-transgenic primary plants, in which introduction of only one copy of transgene had been identified by Southern analysis in our previous study (Lee et al. 2009). T
2generation was obtained by selfing of each T
1line.
Analysis of inheritance and expression of transgene in pro- genies
Inheritance of transgene in T
1and T
2generations was
examined depending on PCR analysis, and its expression in
T
2generation was investigated by RT-PCR analysis. Both
DNA and RNA used for PCR and RT-PCR analysis were
Research Article
Table 1 Segregation ratio of transgene in SOD2-transgenic (T1) petunias
Genotype No. of analyzed plants No. of plants with SOD2 gene Expected ratio X2*
A2-19-3-1 50 33 3:1 2.160
A2-19-4-1 49 37 3:1 0.006
A2-36-1-1-2 34 25 3:1 0.039
A2-36-2-1-1 41 23 3:1 7.813
* X2 0.05= 3.841(d.f.=1)
Table 2 Segregation ratio of transgene in SOD2-transgenic (T2) petunias
Genotype No. of analyzed plants No. of plants with SOD2 gene Expected ratio X2*
A2-19-3-1-8 84 84 1:0 0.000
A2-19-3-1-37 56 56 1:0 0.000
A2-19-4-1-15 88 58 3:1 3.878
A2-19-4-1-43 51 51 1:0 0.000
A2-36-1-1-2-5 83 66 3:1 0.903
A2-36-2-1-1-35 73 73 1:0 0.000
* X2 0.05=3.841(d.f.=1)
extracted from leaves of the transgenic plants grown for three months after having been sown in the greenhouse. PCR and RT-PCR analysis were conducted as described by Lee et al. (2009).
Examination of morphological traits in progenies
Data for two morphological characters (plant height and flower diameter) in transgenic (T
2) lines was recorded on the basis of the survey standard in agricultural experiment and research (Rural Development Administration, 1995) and in application and evaluation of petunia new varieties (Na- tional Seed Management Office, 1997), when transformants bloomed.
Results and discussion
With successful development of transgenic plants, many researchers have been reported on inheritance pattern of transgene in descendants by PCR analysis (Chareonporn- wattana et al. 1999; Zhang et al. 2005; Sriskandarajah et al.
2007). In this study, segregation pattern of transgene was also analyzed in the process of obtaining progenies (T
2to T
3), which will exhibit and express transgene, from SOD2- transgenic (T
1) petunias as obtained in our previous study.
Results are shown in Table 1~2. One hundred eighteen out of 174 plants of T
14 lines (33 out of 50 A2-19-3-1, 37 out of 49 A2-19-4-1, 25 out of 34 A2-36-1-1-2, and 23 out of 41 A2-
36-2-1-1) exhibited the transgene. By chi-square analysis, segregation pattern of transgene in 3 out of T
14 lines except of A2-36-2-1-1 was not significant at the 5% level, but it coincided with the expected ratio of Mendelian inheritance pattern (3:1) (Table 1). This finding was in contrast with Deroles and Gardner (1988) who reported that approximately half of the transgenic T
1petunia plants showed normal Medelian inheritance in resistance to kanamycin. Mean- while, all T
2lines obtained by selfing each T1 line exhibited segregation ratio (3:1 or 1:0) suitable for the expected ratio of Mendelian inheritance. There was no plant which did not have transgene in T
24 lines (A2-19-3-1-8, A2-19-3-1-37, A2-19-4-1-43, and A2-36-2-1-1-35). In other words, in this study to develop SOD2 transgenic plant, transgenic homo- zygous lines were obtained in T
2generation. On the other hand, by chi-square analysis on the segregation pattern of the transgene in T
2two lines (A2-19-4-1-15 and A2-36-1-1-2-5) where the transgene segregated, A2-19-4-1-15 (where 58 out of 88 plants exhibited the transgene) was not segregated significantly at the 5% level, whereas A2-36-1-1-2-5 (where 66 out of 83 plants had the transgene) was segregated signif- icantly (Table 2).
To succeed plant genetic transformation, it is necessary to
produce descendants where transgene must be not only trans-
mitted but also expressed stably (Zhang et al., 2005). Six
plants per T
2line were selected to examine whether the
transgene were stably expressed or not. Of course, 12 plants
from 2 lines (A2-19-4-1-15 and A2-36-1-1-2-5) where trans-
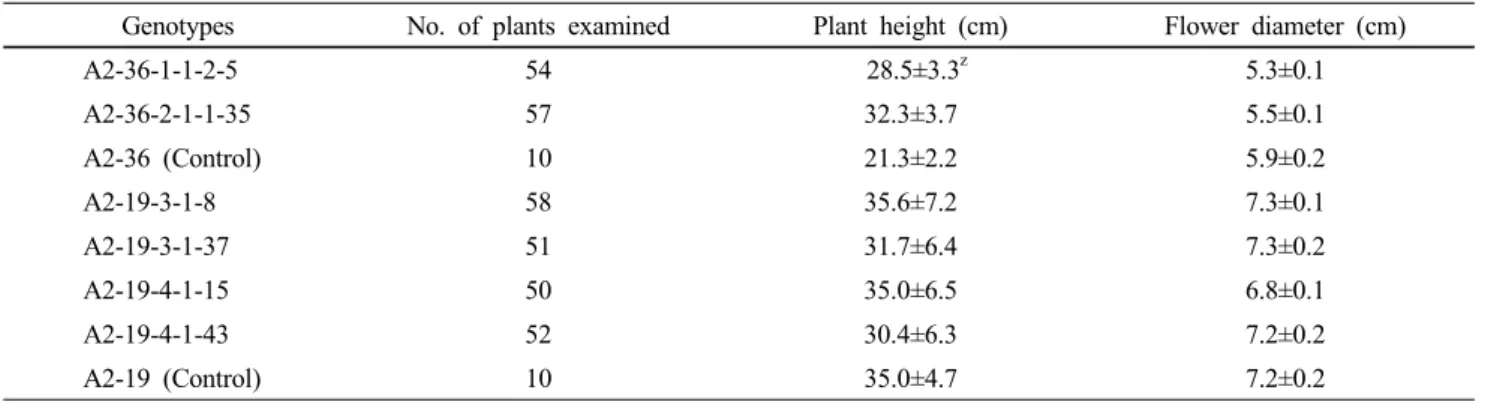
Table 3 Mean for 2 quantitative traits in SOD2-transgenic (T2) petunia plants
Genotypes No. of plants examined Plant height (cm) Flower diameter (cm)
A2-36-1-1-2-5 54 28.5±3.3z 5.3±0.1
A2-36-2-1-1-35 57 32.3±3.7 5.5±0.1
A2-36 (Control) 10 21.3±2.2 5.9±0.2
A2-19-3-1-8 58 35.6±7.2 7.3±0.1
A2-19-3-1-37 51 31.7±6.4 7.3±0.2
A2-19-4-1-15 50 35.0±6.5 6.8±0.1
A2-19-4-1-43 52 30.4±6.3 7.2±0.2
A2-19 (Control) 10 35.0±4.7 7.2±0.2
zMean±Standard deviation
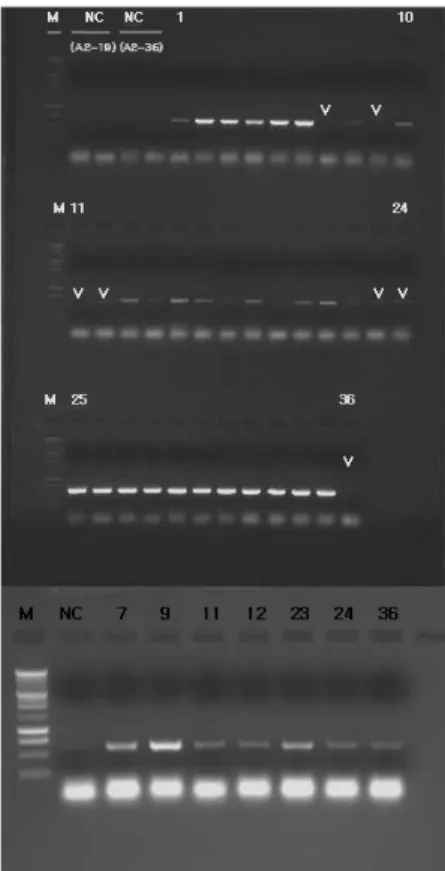
Fig. 2 PCR analysis of SOD2 transgenic T2 (A2-19-3-1-8) 84 plants.
M, molecular marker; NC, negative control; PC, positive control Fig. 1 PCR analysis of SOD2 transgenic T1 (A2-19-3-1) 43 plants
M, molecular marker; NC, negative control
gene was segregated by PCR analysis were selected as what was identified as transmitters of the transgene. By RT-PCR analysis, we confirmed the expression of the transgene at only 29 out of 36 plants of six lines (Fig. 3A). However, at a retrial experiment of RT-PCR analysis where amount of RNA sample was used twice, we confirmed the expression of the transgene in the rest of seven plants where the ex- pression of the transgene was insufficient in the first ex- periment (Fig. 3B). After all, the expression rate of the trans- gene in T
2lines examined in this study was 100% .
Many researchers hoped that only target characters in transformed plant will be changed by the transfer of the gene.
However, there are many reports on the change of morpho- logical trait that is not desirable in transgenic plant (Han et al.
2007; Han et al. 2008). So, we investigated the repre- sentative morphological traits (plant height, flower color, and flower diameter) of T
2lines compared to non- transgenic plants. Flower color of transgenic lines was not different with that of non-transgenic plant except for A2-36- 1-1-2-5
(Fig. 4). Transgenic lines obtained from A2-36 showed a tendency to lengthen in plant height compared to non- trans- genic plants. The plant height of the latter was 21.3±2.2 cm, whereas that of A2-36-1-1-2-5 and A2-36-2-1-1-35 was 28.5±3.3 cm and 32.3±3.7 cm, respectively. On the other hand, their flower size was a little smaller than that of the latter. The flower diameter of the latter was 5.9±0.2, whereas their flower diameter was 5.3±0.1 and 5.5±0.1, respectively.
A2-36-2-1-1-35 was taller in plant height and larger in
flower size than A2-36-1-1-2-5. Meanwhile, transgenic lines
obtained from A2-19 did not show a tendency in plant height
Fig. 3 Expression of transgene in SOD2 transgenic petunia T2 36 plants by RT-PCR analysis. M, molecular marker; NC, negative control; 1-6, A2-36-1-1-2-5; 7-12, A2-19-3-1-37; 13-18, A2-36-2- 1-1-35; 19-24, A2-19-3-1-8; 25-30, A2-19-4-1-43; 31-36, A2-19-4-1-15
Fig. 4 Comparison of flower color between SOD-transgenic lines from A2-36, A2-36-1-1-2-5 (A) and (B) A2-36-2-1-1-35 (C) and non-transgenic plant (B)
or in flower size compared to non-transgenic plants. A2-19 -3-1-8 was taller in plant height as well as larger in flower size than non-transformant. A2-19-3-1-37 and A2-19-4-1-43 were shorter than non-transgenic plants in plant height, whereas they were the same or a little larger than non- transformant in flower size. A2-19-4-1-15 was almost similar to non-trangenic plant in plant height, but it was smaller than control in flower size (Table 3).
In conclusion, in this study, we found that transgene of SOD2- transgenic petunias inherited into their progeny and it ex- pressed well in them based on PCR and RT-PCR analysis.
Until now, there were few papers on the comparison of morphological characters between transgenic and non-trans- genic plant except Lee et al. (2004) who reported on the
distinct modification of morphological characters between transformed and non-transgenic plants of Taraxacum platy- carpum. Therefore, the transgenic petunia progeny (seeds) as well as results obtained in this study will be valuable data and genetic materials for breeding petunia new cultivar resistant to abiotic stress.
Literature cited
Bhatnagar-Mathur P, Vadez V, Sharma KK (2008) Transgenic ap- proaches for abiotic stress tolerance in plants: retrospect and prospects. Plant Cell Rep. 27:411-424
Chandler SF, Lu CY (2005) Biotechnology in ornamental horti- culture. In Vitro Cell. Biol._Plant 41:591-601
Chareonpornwattana S, Thara KV, Wang L, Data SK, Panbangred W, Muthukrishnan S (1999) Inheritance, expression, and silencing of a chitinase transgene in rice. Theor. Appl. Genet.
98:371-378
Deroles SC, Gardner RC (1988) Expression and inheritance of kanamycin resistance in a large number of transgenic petunia generated by Agrobacterium-mediated transformation. Plant Molecular Biology 11:355-364
Fang GC, Hanau RM, Vaillancourt LJ (2002) The SOD2 gene, encoding a manganese-type superoxide dismutase, is up- regulated during conidiogenesis in the plant pathogenic fungus Colletotrichum graminicola. Fungal Genetics, and Biology 36:155-165
Han BH, Lee SY, Hur EJ (2008) Selection of early flowering plants after transformation by a DgLsL anti-sense partial gene in chrysanthemum ‘Zinba’. Kor. J. hort. Sci. Tech. 26 (Supple.
Ⅱ):64-69
Han BH, Suh EJ, Lee SY, Shin HK, Lim YP (2007) Selection of non-branching lines induced by introducing Ls-like cDNA into chrysanthemum (Dendranthema x grandiflorum (Ramat.) Kitamura) ‘Shuho-no-chikara’. Scientia Horticulturae 115:
70-75
Moon H, Lee B, Choi G, Shin D, Prasad DT, Lee O, Kwak SS, Kim DH, Nam J, Bahk J, Hong JC, Lee SY, Cho MJ, Lim CO, Yun DJ (2003) NDP kinase 2 interacts with two oxidative stress- activated MARKs to regulate cellular redox state and enhances multiple stress tolerance in transgenic plants. PNAS. 100:358 -363
Kim JS, Lee BH, Kwon SY, Kim YH, Kim SH, Cho KY (2005) Antioxidative responses of transgenic tobacco plants expressing both superoxide dismutase and ascorbate peroxidase in chl- oroplasts to several herbicides. Kor. J. Plant Biotech. 32:
97-103
Lee, MH, Yoon ES, Jeong JH, Choi, YE (2004) Agrobacterium rhizogenes-mediated transformation of Taraxacum platycarpum and changes of morphological characters. Plant Cell Rep.
22:822-827
Lee SY, Han BH,, Noh EW, Kwak SS (2009) Transfer of SOD2 or NDP kinase 2 genes into purebred lines of petunia. Kor. J.
Plant Biotech. 36:144-148
National Seed Management Office (1997) Standard for survey in application and evaluation of carnation new varieties. p 32-40 (In Korean)
Rural Development Administration (1995) Standard for survey in agricultural experiment & research. p 388-390 (In Korean) Sriskandarajah S, Mibus H, Serek M (2007) Transgenic Campan-
ula carpatica plants with reduced ethylene sensitivity. Plant Cell Rep. 26:805-813
Tang L, Kwon SY, Kim MD, Kim JS, Kwak SS, Lee HS (2007) Enhanced tolerance to oxidative stress of transgenic potato (cv. Superior) plants expressing SOD and APX in chloroplasts.
Kor. J. Plant Biotech. 34:299-305
Tang L, Kwon SY, Yun DJ, Kwak SS, Lee HS (2004a) Selection of transgenic potato plants expressing NDP Kinase 2 gene with enhanced tolerance to oxidative stress. Kor. J. Plant Biotech.
31:19-195
Tang L, Kwon SY, Kwak SS, Sung CK, Lee HS (2004b) Selection of transgenic potato plants expressing both CUZNSOD and APX in chloroplasts with enhanced tolerance to oxidative stress. Kor. J. Plant Biotech. 31:109-113
Zhang Y,Yin X, Yang A, Li G, Zhang J (2005) stability of in- heritance of transgenes in maize (Zea mays L.) lines produced using different transformation methods. Euphytica 144:11-22