서비스업종 사업장의 고용형태 및 직업안전보건활동 특성과 개선방안 연구
이관형 †
산업안전보건연구원 안전연구실
(2016. 1. 6. 접수 / 2016. 2. 10. 수정 / 2016. 3. 15. 채택)
The Study of Preventive Improvement on
Employment Type and Occupational Safety & health Activity in the Very Small Service Industry
Kwan Hyung Yi †
Occupational Safety and Health Research Institute, KOSHA
(Received January 6, 2016 / Revised March 2, 2016 / Accepted March 15, 2016)
Abstract : The labor force has moved to services industry. An industrial accidents of service industry is three people on 10 persons
in 2013. This research conducted questionnaire surveys of 1:1 directly person interviews with a structured questionnaire intended for 150 service workplaces, in order to improve occupational safety and health in very small service workplace with less than 5 employee. The survey contents is employment type, safety and health management system, safety and health training, activities. In the results, working with non-regular(informal) workers is two people on 10 persons 27.1% and female workers is about five people on 10 persons with 58.1%, and that 67.9% of non-regular workers who are mainly engaged in the production line appeared.And the work-related injury and accident experience was 3.3% and the occupational injury rate was 1.02%, especially occupational injury rate of female workers was 0.88%. Workplace risk assessment carried out in response that it was very low as 10.0% of the total. Also the safety & health education and activities was very low. Thus the safety consciousness and education is urgently required in order to prevent the industrial accidents.
Key Words : injury, occupational, non-regular workers, safety and Health, service industry
†
Corresponding Author : Kwan Hyung Yi, Tel : +82-52-7030-851, E-mail : [email protected]
1.
배경 및 목적최근 산업구조의 고도화, 경제 및 생활 향상이 변화 되면서 다양한 서비스업이 등장하고 있다. 다양한 서 비스업의 등장은 산업사회에서 농업이나 제조업 종사 자의 비중은 감소하고, 서비스업으로 노동력이 이동하 는 경향 , 즉 탈공업화 현상이 나타나고 있다 1) . 이러한 현상은 서비스 수요의 소득이 제조업 제품보다 크므로 소득이 향상되면서 서비스수요가 상대적으로 증가하 여 서비스업의 비중이 확대되었고 제조업과 서비스업 과의 생산성 격차에 따른 상대가격의 차이와 국제 무 역으로 기술집약 제품의 생산성이 확대되는 반면, 노 동집약적인 제품의 수입이 확대되어가면서 제조업의
고용이 감소되고 있는 추세이다 2) . 이와 같은 변화로 제 조업의 비중은 감소하고 있으며 서비스업의 비중이 지 속적으로 증가하고 있는 실정이다. 따라서 최근 정부 차원에서 서비스산업 육성을 위해 노력하고 있는 만큼 서비스업종 근로자의 안전과 건강보호를 위한 안전보 건정책 방향과 근본적인 변화가 필요하다 .
우리나라 산업재해율은 1987년 2.66%에서 지속적으
로 감소하여 2013년에는 산업재해율이 0.59%로 낮아
졌다 3) . 하지만 전체 산업재해율은 감소하였으나 2013
년 산업재해현황분석에서 상시근로자를 기준으로 사
업장 규모별로 분석하면 3) , 상시근로자 50인 미만 사업
장 재해율이 50인 이상 사업장 재해율보다 약 4배 정
도 높게 나타났고 , 좀 더 세분화하면 상시근로자 5인
미만 사업장 재해율이 전체 산업재해율 0.59%보다 2.4 배 높은 1.41%로 분석되었다. 그리고 2013년 기준으로 산업재해자 10명 중 3명이 서비스업에서 발생하였다.
산업재해 통계에 따르면 서비스업종 중 전체 산업재 해의 87%를 차지하고 있는 재해다발 7대 업종은 도소 매 및 소비자용품 수리업, 음식 및 숙박업, 사업서비스 업, 건물관리업, 위생 및 유사서비스업, 보건 및 사회복 지사업 , 교육서비스업이다. 7대 업종에서 주로 발생하 는 주요 재해유형은 넘어짐 사고가 가장 많이 발생하 였으며 , 절단⋅베임⋅찔림 사고, 교통사고, 떨어짐 사 고 등의 순으로 많이 발생하였다.
본 조사연구에서는 상시근로자 5인 미만 초소규모 서비스업 사업장을 중심으로 사업장별, 고용형태별 근 로자 분포, 안전보건 경영실태, 산업재해예방을 위한 안전보건교육 실시, 필요성 및 효과 등을 파악하여 향 후 정책적 지원 사항과 예방측면에서 개선사항을 도출 하고자 한다.
2.
대상 및 방법전국지역의 산재보험가입 상시근로자 5인 미만 규 모 사업체 중 서비스업 150개 사업장을 대상으로 조사 방법은 잘 숙련된 면접조사원이 사업장에 직접 방문하 여 구조화된 설문지로부터 안전관리 담당자와 1:1 대 면 면접조사를 실시하였다. 조사기간은 2012년 6월 7 일부터 8월 6일까지 약 2개월에 걸쳐 조사하였다. 그리 고 표본 설계는 서비스업종 특성에 따라 7개 층으로 구분하여 전체 표본 크기를 각 층별로 재해율을 고려 하여 사업장수의 제곱근에 비례하여 배분하였다.
조사된 서비스업종은 7개 업종으로 도소매 및 소비 자용품 (41개소, 27.3%), 음식 및 숙박업(26개소, 17.3%), 보건 및 사회복지사업(23개소, 15.3%), 사업서비스업 (22개소, 14.7%), 건물 등 종합 관리업(17개소, 11.3%), 교육서비스업(14개소, 9.3%), 위생 및 유사서비스업(7 개소, 0.7%)이다.
3.
조사결과3.1 조사대상 일반적 특성 및 고용현황
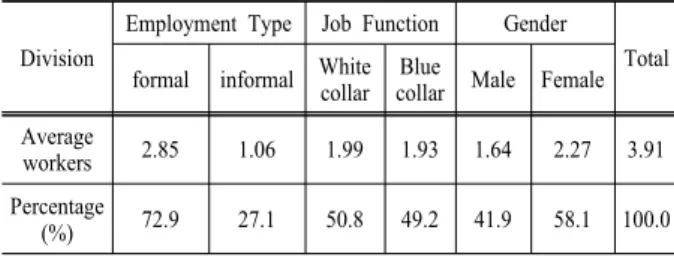
서비스업종의 상시근로자 5인 미만 사업장별 평균 상시근로자 수는 3.91명이며, 비정규직 근로자는 총 근 로자 중 21.7%이며, 비사무직 근로자는 49.2%, 여성근 로자는 58.1%를 차지하는 것으로 나타났다(Table 1).
직무별에서 비정규직의 경우 생산직 평균 근로자 수와 비율은 0.87명(45.0%)를 차지했으며, 또한 성인지적에
Table 1. Average number and percentage of service workers
(Unit : persons, %)Division
Employment Type Job Function Gender
Total formal informal White collar Blue
collar Male Female Average
workers 2.85 1.06 1.99 1.93 1.64 2.27 3.91
Percentage
(%) 72.9 27.1 50.8 49.2 41.9 58.1 100.0
Table 2. Distribution of non-regular(informal) workers
(Unit : Persons, %)Division Job function Gender
Total White collar Blue collar male Female Average
workers 0.19 0.87 0.34 0.72 1.06
Percentage
(%) 17.9 82.1 32.1 67.9 100.0
서는 남성이 0.34명(32.1%)이고 여성은 0.72명(67.9%) 으로 남성보다 여성 평균 근로자가 많은 것으로 나타 났다 (Table 2).
또한 취약계층 종사자인 여성근로자 비율은 58.1%, 고령근로자 15.0%, 외국인근로자는 0.7%를 차지하는 것으로 나타났으며, 1주일 평균 근로시간은 44.8시간으 로, 전체 사업장의 74.0%가 1주일에 40~50시간 근무하 고 있었으며 , 50~60시간 근무하는 곳은 8.7%, 60시간 이상 근무하는 곳은 10.7%인 것으로 나타났다.
조사대상 사업장에서 2011년 1월 1일부터 12월 31일 한 해 동안 해당 사업장의 근로자가 업무수행 중 사고 나 질병을 경험한 적이 있는지 질문에서 조사대상 사 업장의 3.3%가 있었다고 응답했으며, 사고 재해율은 0.68%, 질병 재해율은 0.34%, 사고와 질병을 합한 전체 재해율은 1.02%로 추정된다. 그리고 취약계층 근로자 의 사고나 질병 재해율은 고령근로자와 외국인근로자 는 0.00%, 여성근로자는 0.88%로 나타났다.
3.2 안전보건 투자 및 경영 활동
2011년 한 해 동안 사업장당 평균 안전보건 지출 비 용은 사업장 당 평균 110만원으로 나타났다. 산업재해 예방을 위해 가장 많이 지출 (투자)하고 있는 항목을 보 면, ‘안전시설 및 보호장치 투자비’가 49.1%로 가장 높 게 나타났으며 , 다음으로는 ‘건강진단(관리)비’ 24.5%,
‘인력유지비’ 13.2%, ‘활동비’ 5.7% 등의 순으로 나타 났다 (Table 3).
산재예방을 위해 가장 많이 지출 (투자)해야 한다고
생각하는 항목 역시 ‘안전시설 및 보호장치 투자비’가
Division Very negative+Negative Usually Positive+Very positive Do not know 100 Point
A 7.3 24.7 64.7 3.3 70.7
B 32.0 22.7 40.7 4.7 51.7
C 78.7 2.7 10.0 8.7 20.4
D 23.3 29.3 44.0 3.3 56.7
E 30.7 34.0 29.3 6.0 49.5
F 32.0 26.7 34.7 6.7 49.8
G 28.0 26.7 42.7 2.7 54.5
H 23.3 30.7 42.0 4.0 56.9
I 41.3 27.3 25.3 6.0 41.7
J 19.3 36.0 42.0 2.7 57.0
K 60.0 20.0 16.7 3.3 29.0
A. Employers are aware of the safety and health work as a field of business management B. Employers tend documenting establish a Safety and Health Policy
C. Performed risk factors self-management (risk assessment) D. Review the safety and health laws are applied to the workplace.
E. Goals and plans for improving the safety and health at work constantly tend to establish each year.
F. Stipulates the duties and responsibilities of the safety and health managing director.
G. Workers and training and training to acquire various information related to safety and health.
H. Shared opinions and information with workers about the health and safety problem I. Documented the safety and health management systems
J. Have a risk of imminent disaster or major disaster safety manual.
K. Provides a bonus or incentive for the safety and health activities.
Table 4. Activities and evaluation of the employer's safety and health management
(Unit : Persons, %)
Table 3. Expenditures on Occupational health and safety
(Unit : %) Safety equipment and protective devices 49.1
Health screening and treatment 24.5
Manpower and maintenance 13.2
Activities 5.7
Education 3.8
Working environment measurement 1.9
Do not know 1.9
34.0%로 가장 높게 나타났으며, ‘건강진단(관리)비’
28.0%, ‘인력유지비’ 21.3%, ‘교육비’ 6.0%, ‘작업환경 측정비 ’ 3.3% 순으로 대체로 현재 가장 많이 지출(투 자)하고 있는 항목과 비슷한 경향을 보였다.
사업주의 안전보건 경영활동 평가에 대해서는 ‘사업 주가 안전보건 업무를 경영의 한 분야로 인식하고 있 다’는 사업장이 64.7%로 가장 높았던 반면, ‘유해위험 요인 자기관리를 수행하고 있는’ 사업장은 전체 사업 장 중 10.0%로 나타나, 사업장내 안전보건 예방활동 중 가장 취약하였다 (Table 4).
유해위험요인 자기관리 (위험성평가)를 실시하는 경 우, 유해위험요인자기관리가 사업장의 산업재해 예방 에 얼마나 기여하고 있는지 물어본 결과 , 기여하고 있
Fig. 1. Industrial accident prevention contribution of hazard factors self-management.
다는 응답이 70.0%(매우 기여한다 20.0%+기여하는 편 이다 50.0%)로 실시 사업장의 경우 기여도를 높게 평 가하는 것으로 나타났다(Fig 1).
유해위험요인자기관리를 실시하지 않는 사업장은
미실시 이유로 작업환경이 위험하지 않다 (46.2%)는 이
유를 가장 많이 꼽았으며 , 그 다음으로 필요성을 느끼
지 못한다 (43.1%)는 이유를 꼽았다. 반면, 비용적인 부
분에서 여력이 되지 않는다고 응답한 사업장이 미실시
사업장 (6.9%)를 차지하는 것으로 나타났다(Table 5).
Division Very negative+Negative Usually Positive+Very positive Do not know Do not applicable 100 point
A 4.7 7.3 14.0 2.0 72.0 63.5
B 3.3 5.3 11.3 1.3 78.7 67.5
C 2.0 6.0 10.0 0.7 81.3 68.5
D 2.0 6.0 11.3 1.3 79.3 67.2
E 14.7 18.0 28.7 1.3 37.3 59.2
F 8.7 6.7 10.7 2.0 72.0 51.9
G 4.0 10.7 12.0 2.0 71.3 60.0
A. When handling heavy objects, in order to prevent musculoskeletal disorders and posture tells about is the side
B. About high-temperature failure caused by temperature and humidity, cold disorder, informs about the precautions to prevent moisture damage to health for disability.
C. When fly smoke, fumes, dust and etc, informs about the local exhaust and ventilation
D. When exposed by pathogens, blood borne infection, airborne infection, the insects and zoonotic infections, tells the hazards and precautions to workers.
E. Take precautions for physical fatigue, mental stress and chronic disease management
F. Every three years in order to prevent musculoskeletal disorders, and conduct a hazard investigation.
G. Every three years in order to prevent musculoskeletal disorders, and report a hazard investigation.
Table 7. Workers to communicate and transfer information
(Unit : Persons, %) Division Very negative+Negative Usually Positive+Very positive Do not know Do not applicable 100 point
A 19.3 24.7 24.0 2.0 30.0 54.2
B 4.0 18.0 35.3 0.7 42.0 69.5
C 4.7 13.3 16.7 2.0 63.3 62.0
D 4.0 14.7 25.3 1.3 54.7 67.0
E 2.3 14.7 43.3 0.7 38.0 71.7
F 2.7 13.3 30.0 0.7 53.3 71.7
G 3.3 12.0 30.0 0.7 54.0 69.9
A. Counseling about the health and safety with workers B. Informs the health and medical examination results.
C. Informs the work environment measurement result.
D. If you create a new Safety and Health Administration regulations or changes, and reflects the opinions of workers E. If the workers suggest the opinions on workplace hazards, and actively reflects
F. If the task team leaders or workers suggest the improvement opinions on safety and health actions, and actively accepts
G. If the safety and health managers require the safety and health actions in the workplace, and work team leaders or workers actively support
Table 6. Health care and communication on the workers
(Unit : Persons, %)
Table 5. Why not a hazard and risk assessment?
(Unit : %)
Non-hazardous work environment 46.2
Not feeling the need to 43.1
Lack of time and money 6.9
No know and expertise 3.1
Do not know 0.8
3.3 안전보건교육 실시, 필요성 및 효과
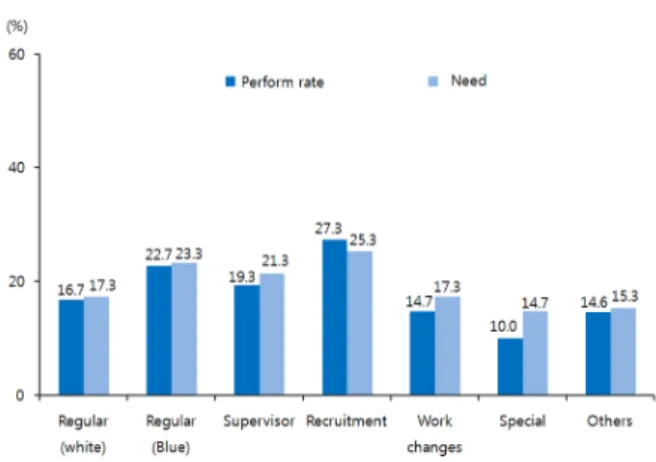
근로자 안전보건교육의 실시율을 교육 종류별로 살 펴보면 , 대체로 교육 실시율이 낮은 것으로 나타났고 그 중 채용시 교육(27.3%), 비사무직의 정기교육(22.7%) 의 교육 실시율이 상대적으로 높게 나타났다 . 그리고 근로자 안전보건교육의 필요성에 대해 살펴보면 실시 율과 마찬가지로 필요성에 대해서도 공감도가 낮은 것 으로 나타났다 . 현재 실시율이 가장 높은 채용시 교육
과 비사무직의 정기교육의 필요성을 상대적으로 높게 평가하는 것으로 나타났다 (Fig 2).
Fig. 2. Perform rate and Needs of the safety and health
training.
Division Very negative+Negative Negative Positive Very positive 100 point
A 4.7 28.0 51.3 16.0 59.6
B 2.0 11.3 62.0 24.7 69.8
C 3.3 13.3 58.7 24.7 68.2
D 8.7 27.3 46.0 18.0 57.8
E 4.0 19.3 54.7 22.0 64.9
F 3.3 16.7 60.7 19.3 65.3
A. New employees receive the training they need to comply with safety regulations first.
B. Regarding to the safety of the workers must observe the principle.
C. Employers and workers in order to create the safest possible working environment Shall cooperate with each other.
D. If you do not follow the workers in the workplace safety regulations, Will receive a warning E. Management Principles from the workplace, the safety of workers has priority
F. If the employee has violated safety regulations, may be reported to superiors freely.
Table 8. The activities of safety climate of the workplaces
(Unit : Persons, %)
3.4 근로자 건강관리와 안전보건관련 정보 고지
근로자 건강관리 현황에 대해 조사한 결과, 건강관 리에 대한 수행율은 화학물질이나 보호구 관리, 위험 기계 및 기구 관리에 비해 상대적으로 낮은 것으로 나 타났다 . 근로자 건강관리 항목 중 근골격계 질환 예방 을 위한 근골격계 부담작업 유해요인 제도의 수행율이 특히 낮은 편이다(Table 6).
근로자에 대한 정보전달 및 의사소통 또한 근로자 건강 관리와 마찬가지로 수행율이 상대적으로 낮은 것 으로 나타났다 . 해당 항목 중 직원들과의 안전보건 상 담 수행율이 특히 낮은 편이다 (Table 7).
3.5 사업장의 안전보건 활동 수준
응답 사업장이 스스로 해당 사업장의 안전보건 활동 수준을 평가하게 한 결과, 전체 사업장의 19.3%가 안전 보건 활동 수준이 ‘높다’(매우 높다 2.7% + 높은 편이다 16.7%)고 응답했다(Fig 3). 동종 업종 대비 해당 사업장 의 위험수준을 평가한 결과 전체 사업장의 9.3%가 해당 사업장의 위험 수준이 타 사업장 대비 ‘높다’(매우 높다 2.0% + 높은 편이다 7.3%)고 평가했다(Fig 4).
Fig. 3. The level of safety and health activities in workplace.
Fig. 4. The perception of the risk level in a homogeneous sector workplace.
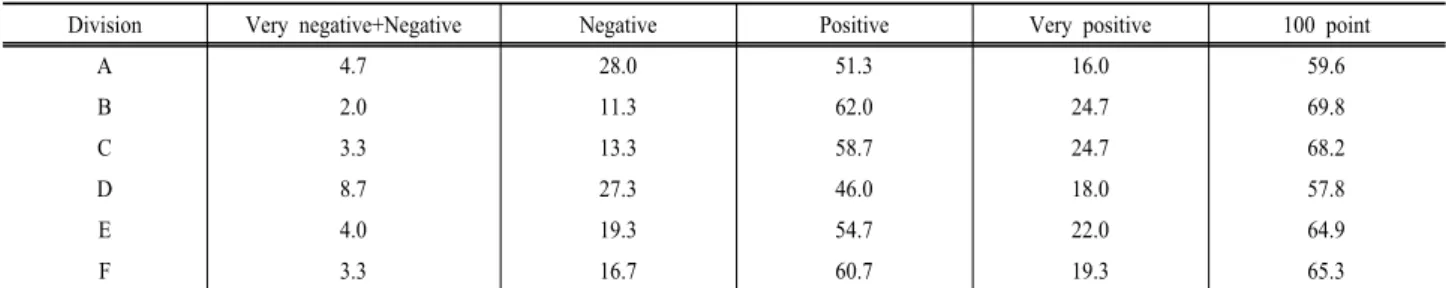
사업장의 안전문화 활동을 반영하는 6개 항목에 대 한 응답을 총점화하여 (24점 만점), 안전문화 수준을 평 가한 결과 , 전체 사업장의 19.3%가 안전문화 활동이
‘좋은’ 것으로 평가되었으며, ‘보통’은 56.7%, ‘나쁜’ 사 업장은 24.0%로 나타났다(Fig 5).
사업장의 안전문화 활동 관련 항목의 백점 환산 점 수는 50~60점대인 것으로 나타났다(Table 8).
Fig. 5. The level of safety climate of the workplace.
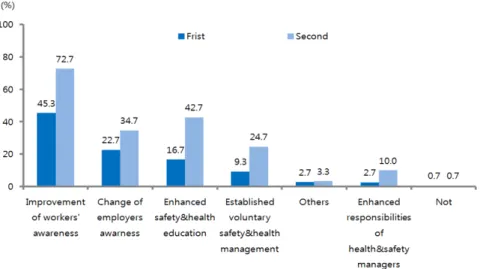
Fig. 6. Contents that should be improved for industrial accident prevention, priority.
3.6 산업재해예방을 위한 개선 사항
산재예방을 위해 가장 시급히 개선되어야 할 사항은 (중복응답), ‘근로자의 의식 향상’(72.7%)이 가장 높게 나타났으며, 다음으로 ‘안전보건교육의 강화’(42.7%),
‘사업주의 의식변화’(34.7%), ‘자율안전보건관리체제 확 립’(24.7%) 등의 순으로 응답되었다(Fig 6).
산업재해 감소를 위해 가장 중요한 사항을 살펴보면, 응답자의 45.3%가 ‘근로자 건강관리 및 건강증진 지 도’(45.3%)를 가장 많이 꼽았으며, 다음으로 정부의 안 전보건 예산증대(25.3%), 산업재해 재발방지를 위한 기 술지도 및 조언(16.0%) 등의 순으로 응답했다(Table 9).
Table 9. Important contents for industrial accident reduction
(Unit : %) Health care and promotion of workers 45.3 Increased founding on government support program 25.3 Technical advice and guidance for occupational injuryrecurrence prevention 16.0
Enhanced responsibility of safety manager 10.0
Law strengthening penalties 2.0
Others 0.7