Print ISSN: 2288-4637 / Online ISSN 2288-4645 doi:10.13106/jafeb.2020.vol7.n10.347
1
First Author. Teacher, Thi Tran High School, Kien Giang, Viet Nam.
Email: [email protected]
2
School of Human Resource, Hanoi University of Home Affairs, Vietnam. Email: [email protected]
3
Corresponding Author. School of Accounting and Auditing, Van Lang University, Ho Chi Minh City, Vietnam [Postal Address: 45 Nguyen Khac Nhu Street, Co Giang Ward, District 1, Ho Chi Minh City, 700000, Vietnam] Email: [email protected];
[email protected]
4
Department of Basis Science, Van Lang University, Ho Chi Minh City, Vietnam. Email: [email protected]
5
Quality Management Division, Department of Education and Training, Hung Yen, Vietnam. Email: [email protected]
© Copyright: The Author(s)
This is an Open Access article distributed under the terms of the Creative Commons Attribution Non-Commercial License (https://creativecommons.org/licenses/by-nc/4.0/) which permits unrestricted non-commercial use, distribution, and reproduction in any medium, provided the original work is properly cited.
Factors Influencing Technology Adoption in Vietnam’s Educational System
Nga TRAN
1, Thanh LE
2, Lan NGUYEN
3, Linh HOANG
4, Thuy NGUYEN
5Received: July 18, 2020 Revised: August 23, 2020 Accepted: August 28, 2020
Abstract
This research aims to shed light on the technology adoption process and its drivers in the Vietnamese educational system. Research data was collected with an online questionnaire from more than 600 teachers in primary schools, secondary schools, high schools, colleges, and universities in Vietnam in 2020. Based on a holistic literature review, we develop a model of two extrinsic factors (global needs and school-infrastructure), and two intrinsic factors (teachers’ technological literacy and their beliefs), which are correlated with the teachers’
technological adoption. We measure the dependent variable by asking the teachers’ ability and their efficacy to implement technology in teaching according to a Likert scale. With the support of SPSS_22 and STATA_2015, we find that over 70% of changes in technology adoption are explained by the changes in four independent variables and three control variables related to age, gender, and teaching- level of the teachers. Furthermore, these independent variables are significantly and positively associated with two dependent variables.
However, a significant difference in technology integration ability can be seen among teachers’ gender, age, and school-level. Specifically, male teachers seem to adopt technology at schools than female teachers better, and university teachers have the lowest level of technology adoption compared to other school-level teachers.
Keywords: Teaching Practices, Vietnamese Teachers, Technology Adoption, Technological Ability, Technological Efficacy JEL Classification Code: M16, M30, M31
remarkable educational changes, and influenced the advanced social orders since the late twentieth century (Kia, Shayan,
& Ghotb, 2000; Marcinkiewicz, 1996; Byun, 2018). ICT is a unique mechanical system for any organization and country to achieve commercial and instructional development before ensuring competitive advantages because it is progressively imperative in our educational framework (Taylor, 2015;
Nguyen & Luu, 2020). Indeed, it is used as an intelligent communicating device, which is sufficiently sensible to capture the dramatic shifts in the educational environment, to deal with practical issues related to learning and teaching methods (Knezek & Christensen, 2008; Muneer, 2020).
Consequently, the necessity of ICT adoption in teaching has been arising due to the high demand for aptitude and knowledge of students in the era of universal integration.
According to Knezek and Christensen (2008), in the fourth industrial revolution, teachers need to equip themselves with essential skills and practical knowledge about ICT implementation to enhance further their teaching techniques as well as the students’ absorption process. This, therefore, raises the question of what is the nature of ICT and its determinants?
1. Introduction
It is no exaggeration to say that the Information
Communication and Technology (ICT) has brought
Over time, many researchers and practitioners have paid attention to ICT adoption; however, its definition is still a topic of discussion. Generally, they define the adoption of technology in various perspectives, which are associated with either educational technology or individual decision of innovation exercise (Ertmer, 1999). They argue that technology adoption describes the process of “acceptance, integration, and use of new technology” in teaching and learning methods (Levin & Wadmany, 2006). This process comprises a set of different steps, which are influenced by two knock-on effects. The first effect is released by external constraints, called first-order barriers, consisting of “hardware and Internet access, software and tool access, training, and support” (Ertmer, Ottenbreit-Leftwich, Sadik, & Sendurur, 2012). The second effect is related to internal factors ranging from teachers’ beliefs and attitudes towards the incorporation of educational technology to their instructive preparations. Indeed, both types of factors are said to have significant impacts on educational changes, so, provided that those factors are profoundly addressed, the extent of the success of technology integration could be improved.
However, the rates of technology integration in impoverished countries are as slow as molasses due to the complexity of ICT in a working environment. Consequently, most researchers and educators have raised concerns about how to gain a degree of technology integration in the classrooms successfully. Compared with developed countries where technology is widely used, developing countries seem to be left behind in the race of technological development.
Indeed, empirical evidence points to the fact that the well- equipped technological infrastructure and human capital support are two main reasons that are responsible for the backwardness of education in developing countries (Zhao, Pugh, Sheldon, & Byers, 2002; Levin & Wadmany, 2006). Aldunate and Nuss (2013) suggest that the national investment on equipment and necessary, updated software are essential stages for schools to maintain an effective teaching environment. In turn, this would allow teachers and students to improve their integrated hands-on lessons via various forms of advancement. Therefore, it can be said that unless developing countries’ educational environments are good enough, teachers from these countries are not bound to be confident to utilize technical tools soon.
Nonetheless, it also is argued that, although the extension of available technical facilities is addressed, this could not necessarily improve the quality of teaching and learning practice (Cuban, 1986). Besides, teachers find it arduous to apply technological applications because of their insufficient skills, experiences, or even lack of basic computer skills.
These problems result in the absence of incorporating technological devices into their daily lessons. Gustafson (1978) claims that a lot of teachers are not sensible enough to
catch up with the changes in technology as well as automation in education. In preparation for fighting for the rational improvement of national education, underdeveloped nations have invested a considerable amount on education to build up the teachers’ ability in technology adoption. This human resource will be devoting time and effort to educational development and stable socio-economic growth. Precisely, in 2013, around 16,5% of governments’ total budget in East Asia and Pacific countries went into education, while the figure for Vietnam’s educational expenditure reached 18.5%, higher than the global average of 14.1% (UNESCO, 2017).
It shows how much the Vietnamese Government’s attention has been paid to education.
Several studies, however, point out that the technical training process plays an important role in teachers’
successful adoption. This is because different relevant technical training courses such as the educational software amendment can further supply teachers with essential skills to enhance their technical knowledge before improving their teaching performance (Zhao, Pugh, Sheldon, & Byers, 2002). Teachers’ priority adoption of technology integration also depends on catering services, namely, the available hardware, software, and time for teachers’ preparations (Bingimlas, 2009; Mumtaz, 2000; Ertmer, 1999). This is because, without an IT service support, teachers are unable to solve some related technical issues timely, so their access to technological advancement, therefore, is hidden. Furthermore, school infrastructure, which includes laboratory, library, and classroom, is another important driver relating to the technology adoption at schools (Wastiau, Blamire, Kearney, & Quittre, 2013). Then again, the more teachers may get access to infrastructure and resources, the more they will frequently be able to update their innovation capabilities.
In summary, although there is much empirical evidence related to the importance of teachers’ technology adoption and its determinants in developed countries, few studies are undertaken in developing countries (Jhurree, 2005). This result is the shortage of literature focusing on developing countries in which the technology, environment, and economy are significantly different from those in developed countries.
It would be inappropriate for the Vietnamese educational system to apply the theoretical concept and empirical models of developed countries in analyzing the technology adoption at school. Thus, in this paper, we will measure the teachers’
technology adoption by their efficacy and ability as two
dependent variables, then evaluate the impact of global needs,
school infrastructure, technological literacy, and beliefs on
these dependent variables. This study aims to carry out a
broader empirical examination, utilizing qualitative methods
to evaluate the teachers’ priority in technology integration
in Vietnam and clarify its main independent variables. The
data of this research were collected via questionnaires from
various subject teachers at schools in Vietnam to ensure representativeness, completeness, and reliability.
2. Literature Review
Currently, technology integration overwhelming every field of life has become an enthralling topic that appeals to educational researchers (Jhurree, 2005; Mikre, 2011).
Aiming to revolutionize education, governments in several countries have taken some measures to implement ICT in their educational systems (Kozma & Vota, 2014). They expect that teachers can adapt the technology as a beneficial apparatus to augment the educational curriculum efficiently.
Gaining teachers’ insight into adopting innovation, therefore, will gradually turn conventional methods or traditional teacher-centered methods into student-centered approaches (Windschitl & Sahl, 2002). Accordingly, recent innovation has the potential to bolster the instruction over the curriculum and the compelling communication (that had not existed before) between teachers and students (Bingimlas, 2009).
Conceptions related to technology adoption were both formed and grouped into different clusters of minds. The first one is aligned with educational technology. However, unlike earlier studies, some definitions of innovation are individual decisions made by teachers to take up technology (Rangaswamy, Arvind; Gupta, Sunil (2000). Another one is synonymous with the choice of a person to form the use of an innovation as the best course of activity accessible (Rogers, 1995). Thus, personal adoption is imperative and influences the process of instructors’ innovation incorporation.
Various empirical studies examining the variables of teachers’ technology adoption are categorized into different elements involving teachers’ innovation adoption divided into two predominant groups: (1) external factors: national infrastructure, time, global need; (2) internal agents:
personal belief, attitude, self-ability, and self-efficacy. In terms of external indicators, there is a high likelihood that teachers’ technology adoption has a close relationship with infrastructure and global needs, which will thrust teachers into consistent practices. School facilities are indispensable for teachers’ determination to select technology since providing teacher-based structures and adequate time (Fullan, 2000) is the first required step preparing teachers to incorporate technology successfully to meet society’s needs.
If teachers stimulate students’ learning activities through software devices to get the learners’ attraction on purpose and cultivate an interpersonal relationship, learners’ academic performances of using technological skills will gradually be improved since students will stand a good chance of imitating teachers’ technology practice as their regular habits. Hence, when teachers are equipped with the technical availability and accessibility, this will results in tremendous outcomes, holding over the educational system in the future.
Internal factors are divided into various aspects:
teachers’ beliefs, their abilities, their attitude, and their motivations (Ertmer, 1999; Chen, 2014; Ertmer, Ottenbreit- Leftwich, Sadik, & Sendurur, 2012), and their technical efficacy (Bandura, 1994; Tschannen-Moran & Johnson, 2010). Accordingly, self-ability exemplifies human ability,
“acquirable skills,” while self-efficacy illustrates how people perceive, deem, and stimulate themselves (Bandura, 1993).
In other words, self-ability is regarded as teachers’ capability of using innovation, one of the most appropriate standards for evaluating teachers’ technology integration. Self-efficacy determinants rely on human motivation with the core beliefs, leading to the direct influential factor of teachers’
innovation adoption. It is believed that teachers with a high level of technical ability and efficacy could control and have a strong impact on students’ accomplishments and enthusiasm (Tschannen-Moran, Hoy, & Hoy, 1998).
Besides, taking advantage of technology in teaching is the most effective way to increase teaching efficiency before enhancing educational processes (Bandura, 1994). In this research, therefore, we will examine the efficacy and ability of teachers to use technology in the classroom based on the cognitive theory of Bandura (1994, 2009). This is because self-ability and self-efficacy are interrelated to the teacher perception process; consequently, they determine the technological implementation of teachers in the classroom.
In Vietnam, very few researchers did investigate the determinants of technology adoption in teaching practices.
This leads educators and educational plan makers to face many difficulties in revolutionizing the education reform.
According to Nguyen and Nguyen (2008), the Vietnamese Government has conducted many educational reforms, from primary school to higher education such as staff qualifications, new curriculums and textbook production, educational makers, and human resources in the 21st century. However, they did not take teachers’ pre-service technology training as well as pre-service teachers’ ICT ability and efficacy into account; therefore, the educational dilemmas remain unchanged. This is because most research findings are conducted in developed countries that have a considerable gap comparing to developing countries, particularly in Vietnam. Therefore, not only does this research aim to confront the issues unlike earlier research, but it also evaluates the determinants of teachers’ technology adoption in different schools in Vietnam.
3. Hypothesis and Research Methodology 3.1. Hypothesis
To assess and evaluate the experimental factors on
teachers’ priority adoption of integrating technology, the
paper focuses on building four research hypotheses below,
corresponding to four independent variables: global needs, national infrastructure, teacher literacy, and teacher beliefs in sequence.
H1: Global needs are positively correlated with teachers’
priority adoption of integrating technology
Albirini (2006) and Jimoyiannis and Komis (2006) point out that the adoption of technology into the educational realm has become a global issue, which is a topic of discussion among many researchers and practitioners. This is because taking advantage of technology in education not only helps to transform the superannuated education system, but also encourage students to generate better outcomes. In response to improving and enhancing Vietnam’s shift to the market economy, educational planners have had to bear in mind strategies for making instructive framework responsive to current and future workforce demand (Duggan, 2001). As a result, in Central Resolution II Session VIII, the Communist Party of Vietnam (1996) determines the strategic direction for the improvement of science and technology and even states that “Innovating methods of education and training imparted to overcome one-sided manner, the routine practice creative thinking of students.” Therefore, teachers could adapt to the technology attainment and apply it in the provision of compulsively electronic lessons to espouse students’ collaboration.
H2: National infrastructures have a positive association with teachers’ priority adoption of technology integration.
In the light of Charles Buabeng-Andoh (2012), the infrastructure and resources comprising of hardware television, motion pictures, audiotapes and discs, textbooks, blackboards, and so on (Engler, 1970) are necessary conditions. They, indeed, have tremendous impacts on teachers’ priority of technology adoption in the classroom.
The teachers themselves can improve their ability to integrate technology at school if and only if they are fully offered technical availability and accessibility. Otherwise, teachers will not have an opportunity to utilize technological services in case they do not get access to technological tools. This would mean that the improvement in teaching infrastructure enables teachers to further develop and enhance their IT skills before amending new technological supports in improving teaching quality. Thereby, it can be said that teachers’ adoption of technological innovation depends on the available and accessible resources such as software, hardware as well as updated application.
H3: Teacher literacy has a positive impact on teachers’
priority adoption of technology integration.
Technology literacy is defined as “the individuals’
abilities to adopt, adapt, invent, and evaluate technology to positively affect his or her life, community, and environment”
(Hansen, 2000). Another definition of innovatively proficient individuals can use innovation as a device for “organization, communication, research and problem-solving” (Eisenberg
& Johnson, 2002). Undeniably, developing teacher literacy of the technology realm is of great significance because teachers are thought at the center of the academic reform efforts, both as active contributors and as leaders of students’
activities. Jimoyiannis and Komis (2006) assert that the understanding of the ICT effect on teachers is consequently crucial. Accordingly, teachers’ technological literacy, which can revolutionize the nature of classroom technology integration, attributes great efforts of enhancing the high educational standard in general and students’ technological skills.
H4: Teachers’ beliefs are positively related to teachers’
priority adoption of technology integration.
Teachers’ pedagogical beliefs are listed as intrinsic factors related to academic convictions and beliefs of how innovation can encourage the methods of putting pedagogical convictions into hones (Chen, 2014). Many empirical pieces of evidence illustrate that these factors are significantly associated with both academic decisions and classroom practices of teachers (Pajares, 1992).
Indeed, teachers are active educators affecting students’
attitudes when conducting computers for instructional purposes. Besides, Bandura (2010) adds teacher’s beliefs as a fundamental element that motivates and enhances environmental learning, then influences the achievement of students’ academic performances. This is because, without strong beliefs of being capable of using technology, teachers can not only collaborate but also facilitate students in the classroom efficiently. This results negatively on the teacher’s willingness to change, a positive indicator determining the integration of technology into the classroom (Aldunate
& Nussbaum, 2013; Mueller, Wood, Wiloughby, Ross,
& Specht, 2008). There is little doubt to say that teachers’
beliefs are of great importance to the process of technology adoption, especially in daily educational practices.
3.2. Empirical Models
In this research, the authors apply both SPSS 22 and STATA 2015 to consider five different variables on teachers’
priority adoption. These independent variables are teachers’
technology adoption, global needs, national infrastructure,
teacher literacy, and teacher beliefs. Since then, we also apply
both qualitative methods within theoretical reviews and
quantitative research into correlation and regression models.
To measure the impact of age, gender, school position on technology adoption among teachers, we add further these demographics indicators as control variables. Two different models, following two different dependent variables, are built as the following:
Model 1: ADO1= α + β1 * GNE + β2 * INF + β3 * TEC + β4 * BEL + β5 AGE + β6 GENDER + β7 SCHOOL + ɛ
Model 1: ADO2 = α + β1 * GNE + β2 * INF + β3 * TEC + β4 * BEL + β5 AGE + β6 GENDER + β7 SCHOOL + ɛ
Where: α, β1, β2, β3, β4, β5, β6, and β7 are coefficients, and ɛ is an error.
Different variables having its meaning and function are as follow:
3.3. Research Method
3.3.1. Selection of the Research Objects and Scopes We have selected some different schools with different levels, including (1) primary schools, (2) secondary schools, (4) high schools, (4) colleges, and (5) universities in the South of Vietnam. At these schools, teachers have focused
on learning how to implement technology in the teaching practice and have encountered numerous problems in the ICT amendment to accelerate the frequency of computer usage. We proceeded to select randomly and conduct interviews with some secondary teachers and college and university lecturers to broaden our understanding. The selected teachers are from different schools, colleges, and universities.
3.3.2. Data Collection and Analyzing Process
We conducted a questionnaire, which is about age, gender, school position, and information technology ability of teachers. Next, through the permission of the principals of these schools, we joined a monthly meeting at some selected schools to collect teachers’ responses. After collecting data from face-to-face interviews and questionnaires, we entered data into Microsoft Excels. We calculated the teachers’
responses based on a Likert scale with a grades score of 1-5.
After this step, the remaining observations for each level of schools are presented in Table 2.
Table 2 shows that most participants are from high schools and senior school. The number of teachers from university and college only accounts for 18% of the total observations. Out of a total of 602 respondents, we have 76 teachers from primary schools, which makes up 13% of the research samples.
Table 1: List of dependents and independent variables of the regression models.
Variable Meaning Determined by Role Model
ADO Teachers’ technology adoption
Self- ability Dependent variable ADO1
Self-efficacy Dependent variable ADO2
GNE Global needs
Demand for highly qualified teachers Independent variable GNE1 Teachers’ technology recognition Independent variable GNE2 Communication technology developments Independent variable GNE3
Social obligation Independent variable GNE4
INF Infrastructure
Catering services Independent variable INF1
Labs and classrooms Independent variable INF2
Software/ hardware Independent variable INF3
TEC Teacher Literacy
Experience and skills Independent variable TEC1
Technical training for teachers. Independent variable TEC2
Teachers’ upgrades Independent variable TEC3
Technology integration Independent variable TEC4
BEL Teachers’ believes
Personal accessibility Independent variable BEL1
Unexpected technical obstacles Independent variable BEL2
Changing willingness Independent variable BEL3
Personal motivation Independent variable BEL4
4. Results
4.1. Descriptive Analysis
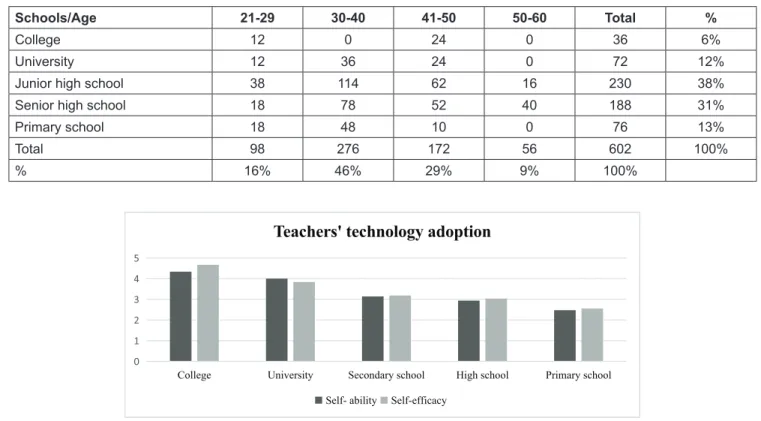
From the data gathered, Figure 1 illustrates two composite indicators, including ADO1 (self-ability), ADO2 (self-efficacy) from the five types of schools (colleges, universities, junior high schools, senior high schools, and primary schools). As can be seen from the chart, generally, teachers at colleges have the highest levels of self-ability and self-efficacy among those schools, with a figure reaching 4,33 and 4,66, respectively. By contrast, teachers at primary schools are on a reverse pattern with the lowest levels of self-ability and self-efficacy to about 2.5. Similarly, the university experienced the second largest number of teachers’ self-ability, and self-efficacy (at about 4 and 3.83, respectively), those of secondary schools came third, high schools came next. To put it another way, college teachers rate their self-efficacy two-fold comparing to teachers at elementary schools. In contrast, secondary and high school teachers’ self–ability and self- efficacy are nearly the same with about 3.13, 3.18, 2.93, and 3.03 in the order given.
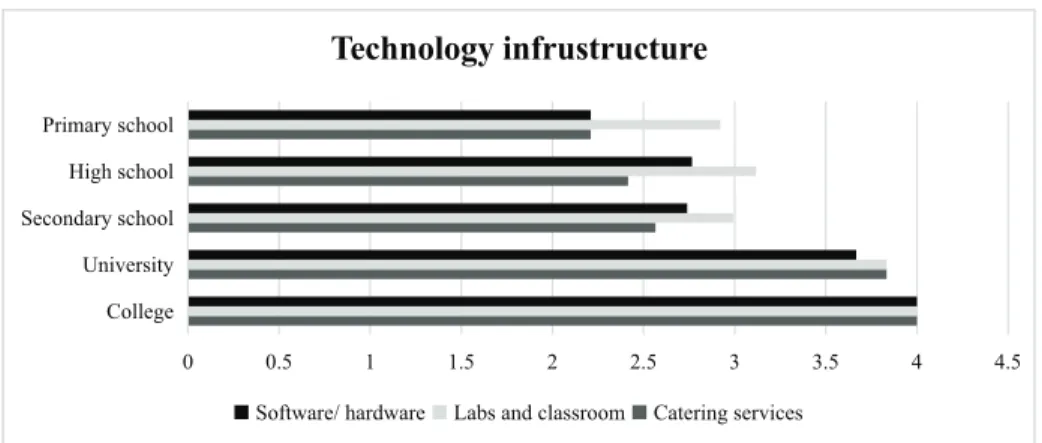
Figure 2 illustrates the comparison of the technology infrastructure teacher’s rank in five different types of schools. Overall, there was the greatest number of software/
hardware, labs, and classrooms, and catering services at colleges, accounting for 4.0, showing a higher figure than the other schools. At the same time, the lowest technology infrastructure belonged to elementary schools with the numbers at 2.21, 2.92, 2.21, respectively, in comparison with that of senior high schools, secondary schools, and universities. In terms of labs and classrooms, they were the highest between the other two categories of schools (primary schools, high schools, and elementary schools), accounting for 2.92, 3.11, 2.99, in that order. Similarly, software/
hardware showed the same trend. In contrast, a low number of the provision of software/hardware and catering service for primary teachers were just above 2.
4.2. Regression Analysis 4.2.1. Measuring Reliability
For STA variables, the test results depict that the observed STA variables have an appropriate total correlation coefficient (≥ 0.3). Cronbach’s alpha coefficient = 0.84
≥ 0.8, so the variables GNE1, GNE2, GNE3, and GNE4 meet the requirements of reliability and are very good measurement scales representing the variable GNE. As for INF, the test results of the observed INF variables indicate an Table 2: Research samples
Schools/Age 21-29 30-40 41-50 50-60 Total %
College 12 0 24 0 36 6%
University 12 36 24 0 72 12%
Junior high school 38 114 62 16 230 38%
Senior high school 18 78 52 40 188 31%
Primary school 18 48 10 0 76 13%
Total 98 276 172 56 602 100%
% 16% 46% 29% 9% 100%
0 1 2 3 4 5
College University Secondary school High school Primary school
Teachers' technology adoption
Self- ability Self-efficacy
Figure 1: Teacher’s technology adoption
appropriate total correlation coefficient (≥ 0.3). Cronbach’s alpha coefficient = 0.89 ≥ 0.8, so the variables INF1, INF2, and INF3 meet the requirements of reliability and are very good measurement scales representing the variable INF.
Speaking of TEC variables, the test results of the observed TEC variables show an appropriate total correlation coefficient (≥ 0.3). Cronbach’s alpha coefficient = 0.92 ≥ 0.9, so the variables TEC1, TEC2, TEC3, and TEC4 meet the requirements of reliability and are very good measurement scales representing the variable TEC. When it comes to TEC variables, the test results indicate the observed BEL variables have an appropriate total correlation coefficient (≥ 0.3). Cronbach’s alpha coefficient = 0.647 ≥ 0.6; thus, the variables BEL1, BEL3, and BEL4 meet the requirements of reliability and are very good measurement scales representing the variable BEL. However, the Cronbach’s alpha of variable BEL2 = -0,047 < 0.6 does not meet the requirement of the reliability; hence, we eliminate this variable to make sure that the others are exactly estimated.
4.2.2. Analysis of EFA
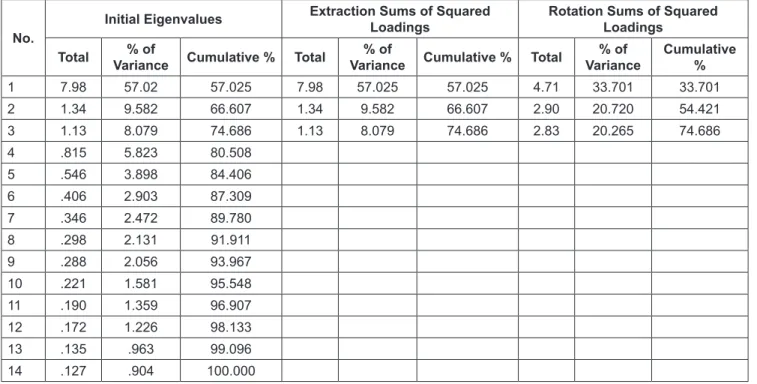
The analysis of the EFA discovering factors shows that, as 0.5< KMO coefficient = 0.909 < 1,000, the analysis of the factor is consistent with the research data set. Also, Bartlett’s test of sphericity has shown that the observed variables in the same factor are correlated with each other owing to Sig (Bartlett’s test) = 0 < 0.05. From the analysis of the independent variables embraced in the model, we find that three factors are extracted at Eigenvalue: 1.131. The Eigenvalue is 0.832< 1 if the model using more factors (the fourth factor). Thus, we stop at the third factor to assure if we depend on Eigenvalues criteria one or more. Furthermore, since total variance explained = 74.686% > 50% shows the EFA model is satisfactory. Hence, the three extracted factors will explain 74.686% of the variability of the observation.
As per the rotated matrix results, variables GNE3, BEL3 will be excluded from the model due to the following reasons:
-The variable BEL3 upload in both component 1 and component 2 that lead to violating the discrimination in the rotation matrix with the difference in a load factor of less than 0.3
-The variable GNE3 uploads in component 1, 2, and 3, violating the discriminatory nature in the rotation matrix with the difference of the load coefficient less than 0.3
After making the reliable measurement of the independent variables using Cronbach’s alpha test and EFA discovery factor analysis, the remaining variables in the models sorted are as follow.
Unlike the hypothetical model, independent variables were formed into three new groups TEC, GNE, and INF instead of four clusters as given. While, along with TEC1, TEC2, TEC3, TEC4, TEC variables included BEL1 and BEL4 after data processed since BEL1 and BEL4 are closely related to TEC. After getting rid of GNE4, GNE variables got three variables (GNE1, GNE2, GNE3). Specifically, INF variables remain the same.
4.2.3. Correlation Analysis
We test the correlation among the variables through SPSS’s results in five different schools involving primary schools, secondary schools, high schools, colleges, and universities in Vietnam in 2020. What stands out from the test is that all dependent determinants and independent variables closely correlate to each other, and independent variables are the same patterns. Therefore, the multi- collinear phenomenon among these variables would not be likely to arise. Moreover, the table shows that there are linear relationships recorded among groups: ADO1, ADO2, TEC, GNE, and INF, so that is to say, ADO1 and ADO2 impacts positively on TEC, GNE, and INF and all independent variables impacts positively on ADO1 and ADO2.
0 0.5 1 1.5 2 2.5 3 3.5 4 4.5
College University Secondary school High school Primary school
Technology infrustructure
Software/ hardware Labs and classroom Catering services