Received: March 4, 2014; Revised: March 20, 2014;
Accepted: March 25, 2014
Corresponding author : Oh, Bong Se
Tel: +82 (54) 782-5497 e-mail: [email protected] 1225-3480/24510
This is an Open Access article distributed under the terms of the Creative Commons Attribution Non-Commercial License with permits unrestricted non-commercial use, distribution, and reproducibility in any medium, provided the original work is properly cited.
A Study on Survival and Growth of Ark shell, Scapharca broughtonii with differential density
during hanging culture
오봉세, 진영국
1, 정춘구
2, 임월애
2, 김숙양
2동해수산연구소,
1남서해수산연구소,
2국립수산과학원
A Study on Survival and Growth of Ark shell, Scapharca broughtonii with differential density on hanging culture
Bong-Se Oh, Young-Guk Jin
1, Choon-Goo Jung
2, Weol-Ae Lim
2and Sook-Yang Kim
2East Sea Fisheries Research Institute, Gangneung 556-000, Korea
1
Southwest Sea Fisheries Research Institute, Yeosu 556-823, Korea
2
National Fisheries Research and Development Institute, Busan 610-900, Korea
ABSTRACT
Ark shell Scapharca broughtonii length and total weight growth by density, which was hanging-cultured near the sea area of Yeosu-city, Hoenggan-island (below is Yeosu), showed inverse correlation with density. As for the average growth of shell length by density, the test area of 10 shells showed the best result as 5.21 mm, and it became lower as density became higher. Also, the increase of total weight by density showed the same result, thus on the whole, the increase of average shell length and total weight of 10-20 shell test area showed the better result than the test area of 30-40 shells. In addition, even if the parashell’s shell length by density and total weight growth in the sea area of Namhae-gun, Mijo-fishing port (below is Namhae) showed inverse correlation with density, it showed the slighter inverse correlation than the sea area of Yeosu. As for the average growth of shell length by density, the test area of 10 shells showed the best result as 4.55mm, but the average growth of shell length by density in the test area of 20-40 shells appeared to be similar as 3.11, 3.36 and 3.27 mm. On the other hand, as for the increase of total weight by density, the test area of 10-20 shells showed the more increase than the test area of 30-40 shells. In conclusion, it is guessed that the culture density of 20 shells/0.12 m
2(166 shells / 1 m
2) would be appropriate when hanging-culturing the shells. At the sea area of A, the survival rate of Scapharca broughtonii parashell was 68-87% by density respectively, and it showed the density-dependent result, while the survival rate of sea area of Namhae, where phytoplankton as prey is abundant, showed the much better result as 91-100%. It is guessed that this may be due to the fact that the quantity of phytoplankton in sea area of Yeosu is just 55.89% of sea area of Namhae. When hanging-culturing the shells, the water temperature by sea area ranged from 16.22 to 25.66℃, salinity 30.07-33.48, pH 8.10-8.45, and DO 4.49-9.65 mg/L.
Keywords: Ark shell, Scapharca broughtonii, Survival and growing rate with density
서 론
피조개 (Scapharca broughtonii) 는 부족강 (이매패강,
BIVALVIA), 익형목 (PTERIOMORPHIA), 꼬막조개과
(Arcidae) 에 속하며 이 과에는 총 10종이 보고되고 있다
(Lee and Min, 2002). 정부에서 발간하는 수산통계연감 자료
에 의하면 피조개 양식 생산량은 1975년에 450톤을 생산한
이후 1986년에 58,393톤으로 가장 많이 생산되어 일본 수출
액이 1억5천만불에 이르러 수산물 단일품종으로는 굴을 능가
Fig. 1. The map showed rearing grounds of Ark shell, Scapharca broughtonii.
Fig. 2. The monthly growth of shell length of Scapharca broughtonii at Yeosu area.
and Park (1978) 등의 연구가 있는데, 본 연구에서는 여름철 의 고수온 및 저비중을 극복하기 위한 수하양성시 적합한 피조 개 사육밀도를 구명하고자 남해안의 여수 및 남해 해역에서 밀 도별 수하양성 피조개의 성장과 생존율 실험을 수행하였다. 한 편, 피조개와 패류의 밀도에 관한 연구는 Song et al., (2002) 의 큰이랑피조개의 양성밀도, Duggan, (1973) 의 해만가리비 의 양성밀도, Parsons and Dadswell (1992) 의 자이언트가 리비의 양성밀도, Oh et al., (2000) 의 해만가리비 수하양성 밀도 연구 등의 결과를 연구에 참고하였다,
재료 및 방법
피조개 수하양성 밀도 실험은 Fig. 1과 같이 2010년 4월부 터 10월까지 여수시 돌산읍 횡간도 어항 부근에 위치한 해역 (이하 여수해역) 과 남해군 미조면 미조항 앞 해상의 우렁쉥이 수하양식장 (이하 남해해역) 에서 표층 (수심 2 m) 에 진주양 성용 채롱(35 cm (W) × 35 cm (B) × 20 cm (H)) 을 설치하 고 각 채롱 당 평균 각장 56.52-58.69 mm, 평균 전중량 53.16-59.65 g의 피조개를 10, 20, 30, 40마리 / 0.12 m
2씩 수용하여 밀도별 반복 시험구 (이하 10마리구, 20마리구, 30 마리구, 40마리구) 를 조성하여 성장 및 생존률을 조사하였다.
성장률 계산식은 아래와 같다.
Daily growth rate = 100 × In (L
1-L
0) / T,
there were L
1; final mean total weight (shell length), L
0; initial mean total weight (shell length), T; rearing days.
양성시험 기간 중 환경조사는 매월 1회 성장 및 생존율조사 와 병행하였다. 수온, DO, pH, 염분은 수질측정기 (모델명:
YSI-1200) 으로 현장에서 바로 측정하였고, 피조개 먹이가 되 는 식물성 플랑크톤의 양과 종류는 월 1회 수하 양성장에서 수 심 2 m층의 해수 1 L를 수직 채수하여 루골액으로 고정하여 실험실로 옮긴 후 여과하여 분류하였다.
결 과
1. 여수 해역의 피조개 밀도별 성장
1) 밀도별 각장 및 전중량
4월 여수해역에 수하양성하여 10월에 조사한 피조개의 밀도
별 평균각장은 10마리구는 57.47 mm에서 62.68 mm로, 20
마리구는 56.52 mm에서 60.78 mm, 30마리구는 58.63 mm
에서 60.00 mm, 40마리구는 58.27 mm에서 60.83 mm로
성장하였다 . 각 밀도별 사육기간 중 평균각장의 증가는 10마리
구 5.21 mm, 20마리구 4.26 mm, 30마리구 1.37 mm, 40마
리구 2.56 mm였다 (Fig. 2). 그리고 사육기간 중 평균각장의
일간성장률을 보면 10마리구 1.83 ± 1.77, 20마리구 1.53 ±
0.98, 30마리구 0.54 ± 0.38, 40마리구 1.04 ± 1.04였다
(Fig. 4).
Fig. 5. The survival rate of Scapharca broughtonii during differential density rearing experiments by areas.
Fig. 3. The monthly growth of total weight of Scapharca broughtonii at Yeosu area.
Fig. 6. The monthly growth of shell length of Scapharca broughtonii at Namhae area.
Fig. 4. Daily growth rates of shell length and total weight of Scapharca broughtonii at Yeosu area.
한편, 평균 전중량은 10마리구는 56.92 g에서 73.27 g으로, 20마리구는 55.59 g에서 72.38 g, 30마리구는 56.70 g에서 69.61 g, 40마리구는 59.65 g에서 65.80 g으로 증가하였다.
각 밀도별 사육기간 중 평균전중량의 증가는 10마리구 16.35 g, 20마리구 16.79 g, 30마리구 12.91 g, 40마리구 6.15 g이 였다 (fig. 3). 그리고 사육기간 중 평균 전중량의 일간성장률 을 보면 10마리구 6.91 ± 5.90, 20마리구 8.01 ± 7.46, 30마 리구 5.99 ± 4.73, 40마리구 2.87 ± 4.45였다 (Fig. 4).
2) 밀도별 생존율
4월부터 수하양성 실험이 종료된 10월까지 밀도별 생존율을 보면 10마리구 76%, 20마리구 76%, 30마리구 87%, 40마리 구 68%의 생존율을 보였다 (Fig. 4).
2. 남해 해역의 피조개 밀도별 성장
1) 밀도별 각장 및 전중량
4월 남해해역에 수하양성하여 10월에 조사한 피조개의 밀도 별 평균각장은 10마리구는 58.43 mm에서 62.98 mm로, 20 마리구는 58.69 mm에서 61.80 mm, 30마리구는 57.60 mm
에서 60.96 mm, 40마리구는 57.76 mm에서 61.03 mm로 성장하였다. 각 밀도별 사육기간 중 평균각장의 증가는 10마리 구 4.55 mm, 20마리구 3.11 mm, 30마리구 3.36 mm, 40마 리구 3.27 mm였다 (Fig. 6). 그리고 사육기간 중 평균각장의 일간성장률을 보면 10마리구 1.80 ± 1.93, 20마리구 1.35 ± 1.88, 30마리구 1.56 ± 1.44, 40마리구 1.50 ± 1.47였다 (Fig. 8).
한편, 평균 전중량은 10마리구는 58.43 g에서 74.98 g으로, 20마리구는 57.87 g에서 75.20 g, 30마리구는 53.16 g에서 68.99 g, 40마리구는 53.47 g에서 68.98 g으로 증가하였다.
각 밀도별 사육기간 중 평균전중량의 증가는 10마리구 16.55 g, 20마리구 17.33 g, 30마리구 15.83 g, 40마리구 15.51 g 이였다 (Fig. 7). 그리고 사육기간 중 평균 전중량의 일간성장 률을 보면 10마리구 7.45 ± 4.75, 20마리구 7.90 ± 5.36, 30 마리구 7.01 ± 4.78, 40마리구 6.80 ± 5.19였다 (Fig. 8).
2) 밀도별 생존율
4월에서 수하양성 실험이 종료된 10월까지 밀도별 생존율을
보면 10마리구는 100%, 20마리구 92%, 30마리구 91%, 40
Fig. 10. Ratio of dominant species over 100 numbers per 1 ml at Yeosu area.
Fig. 9. Number of species of phytoplankton at Yeosu and Namhae areas.
Fig. 7. The monthly growth of total weight of Scapharca broughtonii at Namhae area.
Fig. 8. Daily growth rates of shell length and total weight of Scapharca broughtonii at Namhae area.
마리구 96%의 생존율을 보였다 (Fig. 4)
3. 플랑크톤의 출현량 및 종류
1) 여수해역의 플랑크톤 종류 및 출현량
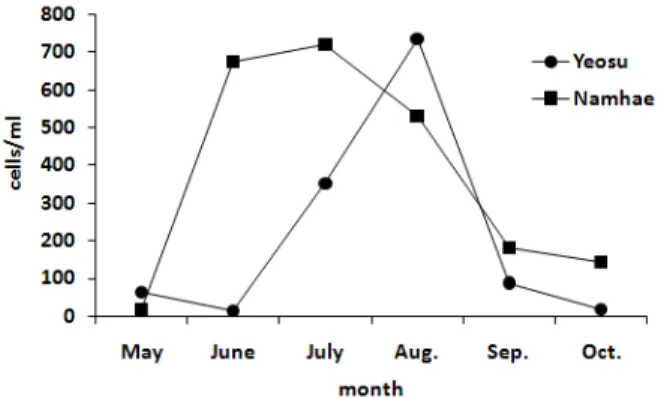
Fig. 9와 Fig. 11과 같이 여수해역에서 5월부터 10월까지 먹이생물인 식물성플랑크톤의 출현종수는 Skeletonema costatum 를 비롯한 총 49종이 출현하였으며 (미동정소형편 모조류 Flagellates와 Ciliates 2종 포함), 출현량은 총 1273.75개체/cc 이었다. 100개체/cc 이상 출현한 식물플랑크 톤 종별 출현율을 보면 Skeletonema costatum 333.5개체/cc (26.18%) 를 점하여 우점종으로 나타났다. 그다음은 Chaetoceros curvisetum 13.68%, Pseudo-nitzschia spp.
12.10%, Chaetoceros spp. 8.32%, Chaetoceros costatus 7.90%의 순이었고 미동정 소형편모조류 2종 8.77%를 포함한 기타 종의 비율은 31.80%였다 (Fig, 10). 월별 출현종수를 보 면 7월에 28종으로 가장 많이 출현했고 그다음은 5월 24종, 8 월 22종, 9월 13종, 10월 12종, 6월 9종의 순이었고, 월별 출
현량은 8월에 735개체로 가장 많았고, 7월 353개체, 10월 88.75개체, 5월 64.5개체, 10월 17.5개체, 6월 15개체로 가장 적게 나타났다 (Fig. 11).
2) 남해해역의 플랑크톤 종류 및 출현량
Fig. 9와 Fig. 11과 같이 남해 미조해역에서 5월부터 10월 까지 먹이생물인 식물성플랑크톤의 출현종수은 (미동정소형편 모조류 Flagellates와 Ciliates 2종 포함) Chaetoceros curvisetum를 포함하여 총 50종이 출현하였으며, 출현량은 총 2,278.75개체/1cc 이었다. 100개체/1cc 이상 출현한 식물 성플랑크톤의 종별 출현율을 보면 Chaetoceros curvisetum 이 596.25개체/1cc (26.16%) 를 점하여 우점종으로 나타났다.
그다음은 Pseudo-nitzschia spp. 17.99%, Chaetoceros spp.
12.17%, Skeletonema costatum 11.79%의 순이었고 미동정 소형편모조류 2종 2.85%를 포함한 기타 종의 비율은 31.88%
였다 (Fig. 12). 월별 출현종수을 보면 7월과 9월에 22종으로
가장 많았고 , 그 다음은 8월 21종, 6월 16종, 10월 12종, 5월
Table 1. The results of water quality during density rearing experiments of Scapharca broughtonii by areas.
Fig. 12. Ratio of dominant species over 100 numbers per 1 ml at Namhae area.
Fig. 11. Total amount of phytoplankton at Yeosu and Namhae areas.
5종이었고, 월별 출현량은 7월에 722.5개체/1cc로 전체의 31.71%를 차지하여 가장 많았고, 6월 29.68%, 8월 23.42%, 9월 8.01%, 10월 6.31%, 6월 0.88%의 순이었다 (Fig. 11).
4. 양성시험 해역별 환경