Hypoglycemic and Antioxidative Effects of Functional Rice Goami and Nokwon in High Fat-Fed Mice
Mi Young Kang*, Jayeon Son*, and Sang Chul Lee**
†*Department of Food Science and Nutrition, Kyungpook National University, Daegu 702-701, Korea
**School of Applied Biosciences, Kyungpook National University, Daegu 702-701, Korea
443
†
Corresponding author: (Phone) +82-53-950-5713 (E-mail) [email protected]
<Received 23 September, 2013; Revised 29 October, 2013; Accepted 30 October, 2013>
한작지(Korean J. Crop Sci.), 58(4): 443~450(2013) DOI : http://dx.doi.org/10.7740/kjcs.2013.58.4.443
ABSTRACT Effects of newly developed functional rice grains Goami (high-amylose rice) and Nokwon (green-kerneled rice) on the glucose metabolism and antioxidative defense system in C57BL/6N mice under high fat diet condition were investigated. Animals were randomly divided into five groups (n = 8) and given experimental diets for eight weeks: normal control diet (NC), high fat diet (HF), and high fat diet sup- plemented with white rice (HF-WR), Goami rice (HF-GR), and Nokwon rice (HF-NR). At the end of the experimental period, the HF group exhibited markedly higher blood glucose level, insulin concentration, plasma lipid peroxidation and lower hepatic glycogen concentration than that exhibited by NC group. However, diet supplementation of Goami and Nokwon suppressed the high fat diet-induced hyperglycemia and oxidative stress through inhibition of the glucose-regulating enzymes and enhancement of the antioxidant enzymes activities.
The results illustrate that the new functional rice Goami and Nokwon may be useful in the development of functional foods with preventive effect against high fat diet-induced hyperglycemia and oxidative stress.
Keywords : functional rice, glucose metabolism, antioxidant defense system, high fat diet, mice
Due to the rising trend in the global incidence of metabolic diseases and the increasing costs of medical service, functional foods have gained public interest in the recent years. Through fortification, enrichment, or genetic manipulation, traditional foods have been modified to contain added nutrients and functional components that provide health beneficial effects (Siro et al. 2008). Such foods lower cholesterol level and blood pressure, reduce the risk of diabetes and cardiovascular diseases, improve weight control, and enhance antioxidant defense status (Siro et al. 2008; Ejtahed et al. 2012; Mermel
2004).
Diabetes mellitus, a metabolic disease characterized by hyperglycemia, is a fast- growing health problem worldwide (Wild et al. 2004). Excessive intake of dietary fat has been associated with the development of glucose metabolism disorder and type 2 diabetes mellitus (Lichtenstein and Schwab 2000).
Progression of hyperglycemia is related to oxidative stress that results from enhanced generation of free radicals and impaired antioxidant defense mechanism (West 2000). Although there are several oral medicines available for the treatment of diabetes, but various adverse side effects have been linked to these anti-diabetic drugs (Inzucchi 2002). Inclusion of functional foods with hypoglycemic activity and strong antioxidative property are therefore greatly needed.
Rice is one of the most important agricultural crops in the world and the staple food in many countries. With the increasing market demand for functional foods, rice scientists and plant breeders are continuously developing rice grains with enhanced functionality. Various functional rice grains, such as colored rice varieties with strong antioxidant activity, high-amylose cultivars that are rich in dietary fiber, beta- carotene-enriched golden rice, and giant embryo rice with high nutritional content, have been developed and produced (Beyer 2010; Min et al. 2012; Seo et al. 2011; Zhu et al.
2012). While a number of studies on the nutritional components
of functional rice have been carried out in the past, knowledge
on the physiological effects of different functional rice varieties,
particularly the newly-developed ones, is still lacking. Thus,
this study was conducted to determine the comparative effects
of the traditional white rice and functional rice cultivars,
such as high-amylose rice and green-kerneled rice, on the
blood glucose level and antioxidant defense system in mice
Table 1. General composition (g/100 g) of the rice samples.
Composition White rice Goami rice Nokwon rice
Carbohydrate 79.76 72.01 69.74
Crude protein 6.11 8.17 6.89
Crude fat 0.33 3.64 2.40
Moisture 12.72 11.65 15.28
Ash 0.39 3.84 0.94
Dietary fiber 0.66 2.93 2.45
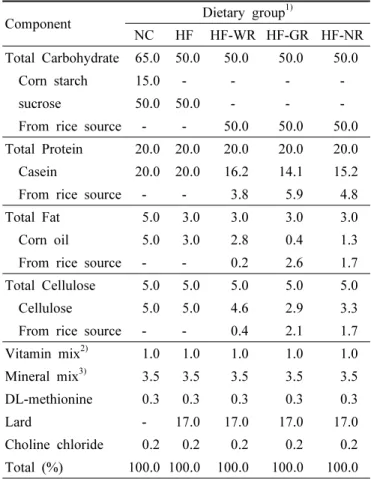
Table 2. Composition of experimental diets (%).
Component Dietary group
1)NC HF HF-WR HF-GR HF-NR
Total Carbohydrate 65.0 50.0 50.0 50.0 50.0
Corn starch 15.0 - - - -
sucrose 50.0 50.0 - - -
From rice source - - 50.0 50.0 50.0 Total Protein 20.0 20.0 20.0 20.0 20.0 Casein 20.0 20.0 16.2 14.1 15.2 From rice source - - 3.8 5.9 4.8 Total Fat 5.0 3.0 3.0 3.0 3.0 Corn oil 5.0 3.0 2.8 0.4 1.3 From rice source - - 0.2 2.6 1.7 Total Cellulose 5.0 5.0 5.0 5.0 5.0 Cellulose 5.0 5.0 4.6 2.9 3.3 From rice source - - 0.4 2.1 1.7 Vitamin mix
2)1.0 1.0 1.0 1.0 1.0 Mineral mix
3)3.5 3.5 3.5 3.5 3.5 DL-methionine 0.3 0.3 0.3 0.3 0.3
Lard - 17.0 17.0 17.0 17.0
Choline chloride 0.2 0.2 0.2 0.2 0.2 Total (%) 100.0 100.0 100.0 100.0 100.0
1)
NC, normal diet; HF, high fat diet; HF-WR, high fat diet + white rice; HF-GR, high fat diet + Goami rice; HF-NR, high fat diet + Nokwon rice.
2)
AIN-76 vitamin mixture.
3)
AIN-76 mineral mixture.
under high fat diet condition. The activities of antioxidant enzymes, as well as enzymes associated with glucose metabolism, were also determined.
MATERIALS AND METHODS Rice cultivars and chemicals
The functional rice cultivars Goami (high-amylose rice) and Nokwon (green-kerneled rice) were provided by the Rural Development Administration (Suwon, Korea). The general white rice was obtained from a local market in Daegu, Korea.
All rice grain samples were ground into powder prior to use and their proximate compositions (Table 1) were analyzed according to the methods of AOAC (AOAC 2003). Chemicals such as ethanol, potassium phosphate buffer, ketamine HCl, trichloroacetic acid, and thiobarbituric acid were obtained from Merck KGaA (Darnstadt, Germany). All other chemicals used were purchased from Sigma-Aldrich, Inc. (Steinhein, Germany).
Animals and diets
Forty 4-week-old male C57BL/6N mice, weighing 12 g, were obtained from Orient Inc. (Seoul, Korea). The animals obtained were individually housed in a stainless steel cage in a room maintained at 25 ℃ with 50% relative humidity and 12/12 h light/dark cycle. They were fed with pelletized chow diet for the first two weeks and then randomly divided into five dietary groups (n = 8). The first and second groups were fed with normal control (NC) and high fat (HF) diets, respectively. The other three groups were fed with a high fat diet supplemented with white rice (HF-WR), Goami rice (HF-GR), or Nokwon rice (HF-NR). The composition of the experimental diet (Table 2) was based on the AIN-76 semisynthetic diet (AIN 1977). The mice were fed for 8 weeks and allowed free access to food and water. At the end of the experimental period, the mice were anaesthetized with ketamine-HCl following a 12-h fast. The blood samples were drawn from the inferior vena cava into a heparin- coated tube and centrifuged at 1,000 rpm for 15 min at 4 ℃ to obtain the plasma and erythrocyte. After centrifugation, the plasma and buffy coat were removed and the erythrocytes were washed with physiological saline, followed by hemolysis with distilled water (McCord and Fridovich 1969). The
hemoglobin concentration was measured using a commercial
assay kit (Asan Pharmaceutical, Seoul, Korea). The liver was
removed, rinsed with physiological saline, weighed, and stored
at -70 ℃ until analysis. The current study protocol was approved
by the Ethics Committee of Kyungpook National University
for animal studies.
Measurement of blood glucose content
The blood glucose concentration was determined using Accu-Chek Active Blood Glucose Test Strips (Roche Diag- nostics GmbH, Germany). Blood samples were drawn from the tail vein of the mice at 2-week intervals for 8 weeks.
Determination of hepatic glycogen and plasma insulin levels
The hepatic glycogen concentration was measured based on the method of Seifter et al. (1950). Briefly, the liver (100 mg) was mixed with 30% KOH and heated at 100 ℃ for 30 min. The mixture was added with 1.5 mL ethanol (95%) and kept overnight at 4 ℃. The pellet was mixed with 4 mL distilled water and the mixture (500 μL) was then added with 0.2% anthrone (in 95% H
2SO
4). The absorbance was measured at 620 nm and the results were calculated based on a standard calibration curve of glucose. The plasma insulin concentration was determined using enzyme-linked immunosorbent assay (ELISA) kits (TMB Mouse Insulin ELISA kit, Sibayagi, Japan).
Lipid peroxidation analysis
The plasma thiobarbituric acid reactive substances (TBARS) were analyzed according to the method of Ohkawa et al.
(1979). A 50 µL of plasma was added with trichloroacetic acid (5%, v/v) and 0.06 M thiobarbituric and incubated at 80 ℃ for 90 min. The mixtures were cooled at room temperature and centrifuged at 2,000 rpm for 25 min. The absorbance of the supernatant was measured at 535 nm. A malondialdehyde (MDA) solution was used as standard and the results were expressed in nmol/mL.
Determination of the activities of hepatic glucose- regulating and antioxidant enzymes
Hepatic enzyme source was prepared following the method Hulcher and Oleson (1973). The liver (0.3 g) was homogenized in buffer solution (0.1 M triethanolamine, 0.2 M EDTA, and 0.002 M dithiothreitol) and centrifuged at 1,000 rpm for 15 min at 4 ℃. The supernatant was further centrifuged at 10,000 rpm for 15 min at 4 ℃ and the resulting precipitate served as the mitochondrial fraction, while the resulting supernatant was centrifuged again at 105,000 rpm for 1 h at 4 ℃. The resulting supernatant and precipitate were the
cytosol and microsome fractions, respectively.
For the analysis of glucose-regulating enzymes, the glucokinase (GK) activity was determined using the method of Davidson and Arion (1987) with slight modifications. The reaction mixture (0.98 mL), which consisted of 50 mM Hepes-NaOH (pH 7.4), 100 mM KCl, 7.5 mM MgCl
2, 2.5 mM dithioe- rythritol, 10 mg/mL albumin, 10 mM glucose, 4 units of glucose-6-phosphate dehydrogenase, 50 mM NAD
+, and 10 μL cytosol, was pre-incubated at 37 ℃ for 10 min. The reaction was initiated with the addition of 10 μL of 5 mM ATP and the mixture was incubated at 37 ℃ for 10 min. The change in absorbance at 340 nm was recorded. The glucose-6- phosphatase (G6pase) activity was determined according to the method of Alegre et al. (1988). The reaction mixture contained 765 μL of 131.58 mM Hepes-NaOH (pH 6.5), 100 μL of 18 mM EDTA (pH 6.5), 100 μL of 265 mM glucose-6-phosphate, 10 μL of 0.2 M NADP
+, 0.6 IU/ml mutarotase, and 0.6 IU/mL glucose dehydrogenase. After pre-incubation at 37 ℃ for 3 min, the mixture was added with 5 μL microsome and incubated at 37℃ for 4 min.
The change in absorbance at 340 nm was measured. The phosphoenolpyruvate carboxykinase (PEPCK) activity was measured following the method of Bentle and Lardy (1976).
The reaction mixture contained 72.92 mM sodium Hepes (pH 7.0), 10 mM dithiothreitol, 500 mM NaHCO
3, 10 mM MnCl
2, 25 mM NADH, 100 mM IDP, 200 mM PEP, 7.2 units of malic dehydrogenase, and 10 μL cytosol. The change in absorbance at 340 nm was recorded.
For the antioxidant enzyme analysis, the superoxide dismutase
(SOD) activity was spectrophotometrically measured using
the method of Marklund and Marklund (1974). The reaction
mixture containing 50 mM Tris-HCl buffer (pH 8.5), 10
mM EDTA, 0.1 mL cytosol or erythrocyte, and 7.2 mM
pyrogallol was incubated at 25 ℃ for 10 min and added
with 50 μL of 1 N HCl. The absorbance was measured at
420 nm and the activity was expressed as unit/mg protein,
wherein one unit represents the amount of enzyme that inhibited
the oxidation of pyrogallol by 50%. The amount of protein
was determined using the Bradford protein assay (Bradford
1976). The glutathione peroxidase (GPx) activity was measured
based on the method of Paglia and Valentine (1967) with
slight modifications. A 0.1 mL of the cytosolic supernatant
or erythrocyte was added to the reaction mixture (6 mM
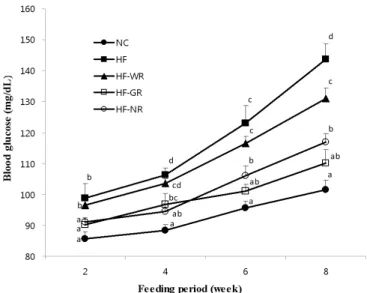
Fig. 1. Effect of diet supplementation of functional rice on the blood glucose level in high fat-fed mice. Means not sharing a common superscript are significantly different at p<0.05 (n = 8). NC, normal control diet; HF, high fat diet; HF-WR, high fat diet + white rice; HF-GR, high fat diet + Goami rice; HF-NR, high fat diet + Nokwon rice.
glutathione, 1.2 mM NADPH, and 1.25 µM H
2O
2in 20 mM Tris-HCl, pH 7.0) that was pre-incubated at 25 ℃ for 5 min. The mixture was further incubated at 25 ℃ for 5 min and its absorbance was measured at 340 nm. A molar extinction coefficient of 6.22/mM/cm was used to calculate the activity, which was expressed as nmol oxidized NADPH /min/mg protein. The catalase (CAT) activity was determined following the method of Aebi (1974). A mixture of 50 mM potassium phosphate buffer (pH 7.4) and 10 μL of mito- chondrial fraction or erythrocyte was pre-incubated at 25 ℃ for 5 min and added with 0.1 mL of 30 mM H
2O
2. The disappearance of hydrogen peroxide was monitored spectro- photometrically at 240 nm for 5 min. A molar extinction coefficient of 0.041/mM/cm was used to calculate the CAT activity, which was expressed as the µmol decreased H
2O
2/min/mg protein. The glutathione reductase (GR) activity was measured according to the method of Mize and Langdon (1952). A 10 μL of cytosol or erythrocyte was added to the reaction mixture (1 mM EDTA and 1 mM GSSG in a 0.1 M potassium phosphate buffer, pH 7.4) and the oxidation of NADPH was monitored at 340 nm. The activity was expressed as nmol oxidized NADPH/min/mg protein. The paraoxonase (PON) activity was determined using the method of Mackness et al. (1991). The microsome or erythrocyte (50 µL) was added to 1 ml Tris/HCl buffer (100 mM, pH 8.0) containing 2 mM CaCl
2and 5.5 mM paraoxon. The absorbance of the mixture was measured at 412 nm at 2 5 ℃ to determine the generation rate of 4-nitrophenol. A molar extinction coefficient of 17100/M/cm was used in calculating the PON activity.
Statistical analysis
All data are presented as the mean ± S.E. The data was evaluated by one-way ANOVA using a Statistical Package for Social Sciences software program (SPSS Inc., Chicago, IL, USA) and the differences between the means were assessed using Duncan’s multiple range test. Statistical significance was considered at p<0.05.
RESULTS
Body weight gain
All animals exhibited similar body weights prior to feeding
with experimental diets. At the end of the experimental period, a marked increase in the final body weight was found in HF mice relative to that of the NC group (data not shown).
On the other hand, the rice-fed groups, particularly HF-GR and HF-NR, showed significantly lower body weight gain and body fat than the HF group, indicating that the functional rice grains were able to suppress the weight gain in mice under high fat diet condition.
Blood glucose level
High fat feeding resulted in a substantial increase in the blood glucose level of mice (Fig. 1). All rice-fed groups showed significantly lower glucose level compared with that of the HF mice on the final day. In particular, the HF-GR mice exhibited a considerable decrease in the glucose level that was comparable with the control group.
Glycogen and insulin levels
The HF and HF-WR groups showed markedly lower glycogen
level than the NC group (Table 3). Moreover, the HF mice
exhibited significantly higher insulin level than the control
group. On the other hand, diet supplementation with Goami
Table 3. Glycogen and insulin concentrations
1)in mice fed with high fat diet supplemented with functional rice.
Dietary group
2)Glycogen (µg/g) Insulin (ng/mL)
NC 101.49 ± 6.44
c4.51 ± 0.07
bHF 31.61 ± 3.77
a5.79 ± 0.03
cHF-WR 33.22 ± 4.93
a4.41 ± 0.04
bHF-GR 70.26 ± 8.56
b4.25 ± 0.07
aHF-NR 88.51 ± 1.77
c4.37 ± 0.04
ab1)
Values are means ± SE (n = 8). Means in the same column not sharing a common superscript are significantly different at P < 0.05.
2)
NC, normal diet; HF, high fat diet; HF-WR, high fat diet + white rice; HF-GR, high fat diet + Goami rice; HF-NR, high fat diet + Nokwon rice.
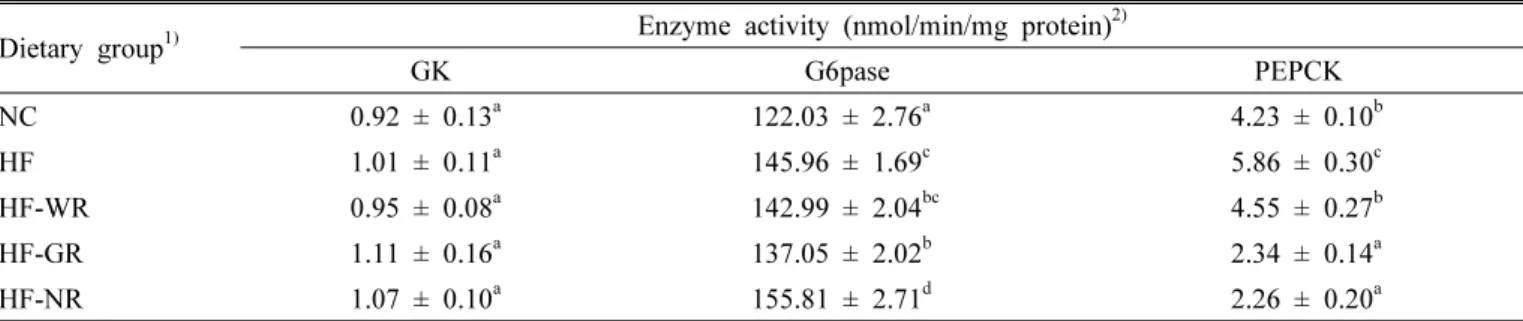
Table 4. Hepatic glucose-regulating enzyme activity in mice fed with high fat diet supplemented with functional rice.
Dietary group
1)Enzyme activity (nmol/min/mg protein)
2)GK G6pase PEPCK
NC 0.92 ± 0.13
a122.03 ± 2.76
a4.23 ± 0.10
bHF 1.01 ± 0.11
a145.96 ± 1.69
c5.86 ± 0.30
cHF-WR 0.95 ± 0.08
a142.99 ± 2.04
bc4.55 ± 0.27
bHF-GR 1.11 ± 0.16
a137.05 ± 2.02
b2.34 ± 0.14
aHF-NR 1.07 ± 0.10
a155.81 ± 2.71
d2.26 ± 0.20
a1)
NC, normal diet; HF, high fat diet; HF-WR, high fat diet + white rice; HF-GR, high fat diet + Goami rice; HF-NR, high fat diet + Nokwon rice.
2)
Values are means ± SE (n = 8). Means in the same column not sharing a common superscript are significantly different at P < 0.05. GK, glucokinase; G6pase, glucse-6-phosphatase; PEPCK, phosphoenolpyruvate carboxykinase.
Table 5. Plasma TBARS level
1)in mice fed with high fat diet supplemented with functional rice.
Dietary group
2)Plasma TBARS (nmol/mL)
NC 7.37 ± 0.84
aHF 12.15 ± 1.16
bHF-WR 7.68 ± 0.95
aHF-GR 6.24 ± 0.31
aHF-NR 7.71 ± 1.04
a1)
Values are means ± SE (n = 8). Means in the same column not sharing a common superscript are significantly different at P < 0.05. TBARS, thiobarbituric acid reactive substances.
2)
NC, normal diet; HF, high fat diet; HF-WR, high fat diet + white rice; HF-GR, high fat diet + Goami rice; HF-NR, high fat diet + Nokwon rice.
rice and Nokwon rice substantially increased and decreased the glycogen and insulin levels, respectively, in mice.
Hepatic glucose-regulating enzyme activities The HF mice exhibited a significant increase in the activities of the G6pase and PECPCK enzymes relative to the control group (Table 4). However, supplementation of Goami rice in the high fat diet considerably reduced the activities of these enzymes. The HF-NR group also showed lower PEPCK activity, but higher G6pase enzyme activity. No significant change was found in the GK activity among the animal groups.
Plasma lipid peroxides
A marked increase in the plasma TBARS level was observed in HF mice relative to that of the NC group, but addition of rice in the diet significantly suppressed the elevation in the TBARS level (Table 5).
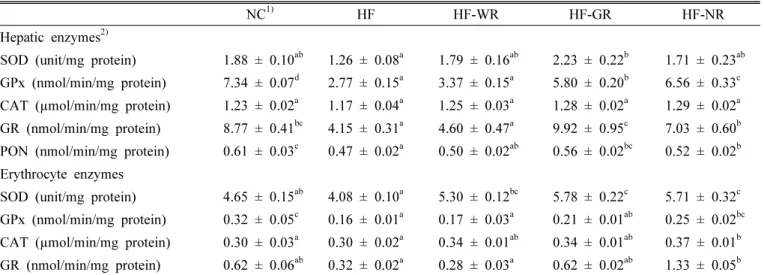
Antioxidant enzyme activities
High fat feeding resulted in a significant decrease in the
activities of GPx and hepatic GR and PON enzymes in mice
(Table 6). However, supplementation of Goami and Nokwon
Table 6. Antioxidant enzyme activity in mice fed with high fat diet supplemented with functional rice.
NC
1)HF HF-WR HF-GR HF-NR
Hepatic enzymes
2)SOD (unit/mg protein) 1.88 ± 0.10
ab1.26 ± 0.08
a1.79 ± 0.16
ab2.23 ± 0.22
b1.71 ± 0.23
abGPx (nmol/min/mg protein) 7.34 ± 0.07
d2.77 ± 0.15
a3.37 ± 0.15
a5.80 ± 0.20
b6.56 ± 0.33
cCAT (µmol/min/mg protein) 1.23 ± 0.02
a1.17 ± 0.04
a1.25 ± 0.03
a1.28 ± 0.02
a1.29 ± 0.02
aGR (nmol/min/mg protein) 8.77 ± 0.41
bc4.15 ± 0.31
a4.60 ± 0.47
a9.92 ± 0.95
c7.03 ± 0.60
bPON (nmol/min/mg protein) 0.61 ± 0.03
c0.47 ± 0.02
a0.50 ± 0.02
ab0.56 ± 0.02
bc0.52 ± 0.02
bErythrocyte enzymes
SOD (unit/mg protein) 4.65 ± 0.15
ab4.08 ± 0.10
a5.30 ± 0.12
bc5.78 ± 0.22
c5.71 ± 0.32
cGPx (nmol/min/mg protein) 0.32 ± 0.05
c0.16 ± 0.01
a0.17 ± 0.03
a0.21 ± 0.01
ab0.25 ± 0.02
bcCAT (µmol/min/mg protein) 0.30 ± 0.03
a0.30 ± 0.02
a0.34 ± 0.01
ab0.34 ± 0.01
ab0.37 ± 0.01
bGR (nmol/min/mg protein) 0.62 ± 0.06
ab0.32 ± 0.02
a0.28 ± 0.03
a0.62 ± 0.02
ab1.33 ± 0.05
b1)
NC, normal diet; HF, high fat diet; HF-WR, high fat diet + white rice; HF-GR, high fat diet + Goami rice; HF-NR, high fat diet + Nokwon rice.
2)