임의효과를 이용한 충남지역 소나무림의 바이오매스 모형 개발
표정기1*⋅손영모2
1한국임업진흥원 산림탄소인증센터, 2국립산림과학원 산림산업연구과
The Development of Biomass Model for Pinus densiflora in Chungnam Region Using Random Effect
Jungkee Pyo1* and Yeong Mo Son2
1Forest Carbon and Certification Center, Korea Forestry Promotion Institute, Seoul 07570, Korea
2Division of Forest Industry Research, National Institute of Forest Science, Seoul 02455, Korea
요 약: 본 연구의 목적은 임의효과(random effect)를 이용하여 충남지역 임령-바이오매스 모형을 개발하고 임의효과의 적 용성을 평가하는데 있다. 충남지역 소나무림의 임령에 따른 바이오매스 모형 개발을 위해 임분 구조를 고려하여 전국의 중 부지방소나무 임분에서 30개소(150그루)를 조사하고 임령과 바이오매스 자료를 수집하였다. 모형 개발에서 중부지방소나 무의 임령-바이오매스 관계는 고정효과(fixed effect)이고 지역간 차이를 임의효과로 설정하였다. 임의효과에 따른 모형의 적합도를 검정하기 위해 아카이케의 정보기준(Akaike Information Criterion, AIC)을 참고하고 지역간 차이에 따른 분산-공 분산 행렬과 오차항을 추정하였다. 추정된 공분산은 –1.0022, 오차항은 0.6240이고 분산-공분산 행렬을 이용한 임의효과 모형의 AIC는 377.7을 나타내어 선행 연구와 이질적인 차이는 없었다. 이러한 결과는 범주형 자료의 임의효과가 모형 개 발에 반영된 결과로 판단된다. 본 연구의 결과는 임의효과를 이용하여 일부지역에 국한되어 개발되었던 바이오매스 모형 연구에 활용이 가능하다.
Abstract: The purpose of this study was to develop age-biomass model in Chungnam region containing random effect. To develop the biomass model by species and tree component, data for Pinus densiflora in central region is collected to 30 plots (150 trees). The mixed model were used to fixed effect in the age-biomass relation for Pinus densiflora, with random effect representing correlation of survey area were obtained. To verify the evaluation of the model for random effect, the akaike information criterion (abbreviated as, AIC) was used to calculate the variance- covariance matrix, and residual of repeated data. The estimated variance-covariance matrix, and residual were –1.0022, 0.6240, respectively. The model with random effect (AIC=377.2) has low AIC value, comparison with other study relating to random effects. It is for this reason that random effect associated with categorical data were used in the data fitting process, the model can be calibrated to fit the Chungnam region by obtaining measurements. Therefore, the results of this study could be useful method for developing biomass model using random effects by region.
Key words: biomass, calibration, Pinus densiflora, random effect, variance-covariance matrix
서 론
1)
산림분야에서 특정 변수간 관계를 설명하는 모형 개발 을 위해 다양한 시점과 지점에서 수집된 자료가 사용된 다(Pyo et al., 2016). 이러한 계층적 구조(hierarchical data)를 내포하는 자료는 특정 범주(category)에 따라 연
* Corresponding author E-mail: [email protected]
관성이 존재하고 특정 시점 혹은 지점에서 자료가 편중 되는 경우 모형은 전체적인 편향성을 나타낸다(Searle, 1982; Choi, 2016). 계층적 구조의 자료를 전통적인 회귀 모형으로 분석하는 경우 상위수준의 자료는 하위수준에 비해 높은 분산을 나타내어 가설검정의 오류는 증가하 게 된다(Jo and Chang, 2013; Ryu and Cho, 2016). 아울 러, 지역단위 자료를 평균하여 국가단위 분석에 활용하 는 경우 집단화 오류가 발생하므로 전통적인 회귀분석 보다 집단간 분산에서 발생하는 오차를 고려하는 방안
JOURNAL OFKOREANFORESTSOCIETY ISSN0445-4650(Print), ISSN2289-0904(Online) http://e-journal.kfs21.or.kr
213
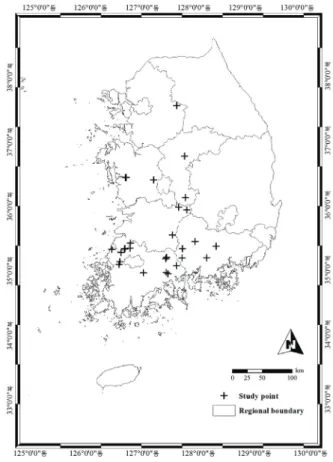
Figure 1. Geographical location of this study for Pinus densiflora.
이 필요하다(Jeong and Shin, 2013). 그러므로, 수집된 자 료의 특성에 근거한 산림분야 모형 개발 연구는 방법론 적인 한계를 내포하고 있다. 이것은 하위수준의 자료 특 성에 따라 변화하는 상위수준의 관계 구명이 어렵기 때 문으로 수집된 자료에 내포된 임의효과(random effect)의 고려가 필요하다(Sharma and Parton, 2007; Vargas-larreta et al., 2009; Lee, 2015). 임의효과를 고려한 모형개발 연 구는 고정효과를 고려하는 모형에 비해 낮은 분산과 높 은 설명력을 나타내는 것으로 보고되고 있다(Lappi and Bailey, 1988; Trincado and Burkhart, 2006; Vanderschaaf, 2008; Budhathoki et al., 2008).
현재 고정효과(fixed effect)에 기반한 모형개발의 방법 론적인 한계를 다양한 통계적, 수리적 기법을 통해 보완 하고 정확도를 향상시키는 연구는 지속적으로 수행되고 있다(Liang and Picard, 2013). 국외에서 임의효과를 고려 하는 모형 연구는 1966년부터 지속적인 증가 추세를 나 타내고 다양한 자료의 변화를 분석하는데 효과적인 방법 으로 보고되고 있다(Zhang and Borders, 2004; Mcculloch et al., 2008). Lynch et al.(2005)과 Trincado et al.(2007)은 수집된 자료의 지역적인 차이를 고려하여 흉고직경과 바 이오매스의 모형을 개발하여 기존 모형에 비해 높은 정확 도를 나타내는 것으로 보고하였다. Vargas-larreta et al.(2009)은 다양한 지역에서 수집된 수종별 흉고직경과 바이오매스 자료를 이용하여 임의효과의 적용성을 검토 하였다. 국내에서 Lee et al.(2009)은 강원지방소나무를 대상으로 임분과 개체목 관계를 파악하고 흉고직경과 바 이오매스 모형을 제시하였다. 국내에서 임의효과를 이용 한 모형 개발 연구는 드문 실정이다. 그러므로, 본 연구 는 고정효과를 이용한 모형 개발의 문제점을 제시하고 임의효과를 고려하여 충남지역 소나무림의 임령에 따 른 바이오매스 모형을 제시하는데 있다.
재료 및 방법
1. 자료수집 및 분석체계
본 연구는 전국에 분포하는 중부지방소나무 임분을 대 상으로 자료를 수집하였다. 연구대상지는 임목 축적, 생육 상태, 임분 구조를 고려하여 충청권역에서 6개소, 전라권 역에서 18개소, 경상남도에서 5개소, 경기도에서 1개소의 조사지를 선정하였다(Figure 1). 조사지에서 20 m × 20 m 방형구를 설치하고 매목조사를 실시하여 5본의 표준목을 벌도하였다. 벌도된 표준목에서 시료를 채취하고 전체 입목의 바이오매스를 추정하였다.
2. 상대생장식을 이용한 고정효과, 임의효과 분석
일반적인 바이오매스 모형연구는 수집된 자료의 생장 정보와 상대생장식을 이용하여 바이오매스(혹은 재적)을 추정하였다. 본 연구는 다양한 연구에서 우수한 적합도 를 나타내는 상대생장식()을 이용하였다. 상대생 장식은 단목의 간재적 및 바이오매스 추정에 널리 사용 되고 다양한 연구를 통해 높은 정확도를 인정받고 있다 (Clutter et al., 1983).
본 연구는 지역별 임령과 바이오매스 차이를 분석하고 임의효과를 적용하여 충청남도 소나무림의 바이오매스 모형을 제시하였다(식 1). 임의효과(random effect)를 포 함하는 모형은 고정효과(fixed effect)의 고정성분과 임의 효과의 확률성분, 오차항으로 구성된다(Searle, 1982;
Sharma and Parton, 2007; Mcculloh et al., 2008). 본 연구 에서 고려된 고정효과는 임령이고 임의효과는 지역간 바 이오매스 차이이다. 고정효과와 임의효과 모형 비교를 위해 식 2의 형태로 변형하였다. 임령과 바이오매스의 관 계를 나타내기 위해 상대생장식의 모수 추정과 적합도 검정은 SAS의 REG procedure를 이용하고 지역적 차이에 따른 변화 행렬과 오차항을 추정은 MIXED procedure를 이용하였다(Kim, 1999; SAS Inc., 2014).
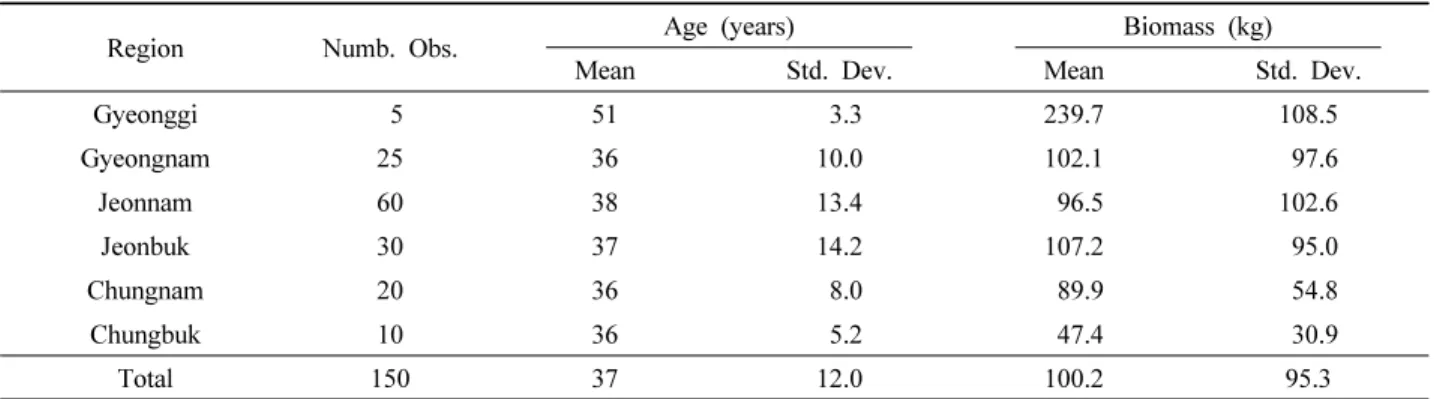
Region Numb. Obs. Age (years) Biomass (kg)
Mean Std. Dev. Mean Std. Dev.
Gyeonggi 5 51 3.3 239.7 108.5
Gyeongnam 25 36 10.0 102.1 97.6
Jeonnam 60 38 13.4 96.5 102.6
Jeonbuk 30 37 14.2 107.2 95.0
Chungnam 20 36 8.0 89.9 54.8
Chungbuk 10 36 5.2 47.4 30.9
Total 150 37 12.0 100.2 95.3
Note: Numb. Obs. (the number of observation), Std. Dev. (the standard of deviation).
Table 1. The summary of observed statistics for survey data.
(1)
ln ln (2)
여기서, 는 j지역 i번째 입목의 바이오매스;
는 j지역 i번째 입목의 임령; , 는 고정효과의 모수; , 는 임의효과에 대한 모수; 는 평균은 0 이고 정규분포를 나타내는 오차항이다.
3. 임의 효과(random effect)의 추정
임의효과는 개체간 변동에 의한 효과로서 식 1에서
부분이고 임의효과 모수(B)는 식 3으로 계산된다 (Robinsson, 1991; Liu et al. 2008). 식 1의 임의효과에 관 한 행렬을 나타내는 식 3은 개체내 분산과 개체간 발생 하는 오차항을 포함한다.
′ ′ ′ (3)
여기서, Z는 임의효과의 계획행렬(design matrix); 는 var(b0j, b1j)=(var(b0j) cov(b0j, b1j), cov(b0j, b1j) var(b1j))의 추정치이고 평균은 0이며 분산은 와 인 정규분포 를 나타내는 변수; 은 추정된 행렬의 오차항이고 오차 항의 분산()은 이다.
4. 적합도 검정
고정효과와 임의효과를 포함하는 모형의 비교를 위 해 각 모형의 우도(likelihood)를 계산하고 AIC를 제시하 여 적합도를 나타내었다(식 4). AIC에 포함되어 있는
× 는 모수 개수에 대한 오차항이고 일반적으로 수가
증가할수록 임의 효과에서 발생하는 오차는 상쇄되므로 AIC는 서로 조화되는 상태에서 최적의 모형을 결정한다 (Mcculloch et al., 2008).
AIC= ln × (4)
여기서, ln은 로그우도함수; 는 분포함수가 가 지는 모수 행렬 의 길이; n은 표본수이다.
결과 및 고찰
1. 자료 수집결과
중부지방소나무의 임령과 바이오매스 자료는 6개 지역 에서 150그루를 수집하였다. 수집된 자료의 임령 범위는 9년에서 70년이고 평균은 37년이다(Table 1). 전체 자료의 분산은 12.0으로 지역별 분산에 비해 높은 수치를 나타 내고 지역간 유의한 차이는 없었다(p-value=0.158). 바이 오매스 자료의 범위는 1.7 kg에서 401.5 kg이고 100.2 kg 의 평균을 나타내었다. 전체 자료의 분산은 지역별 자료 에 비해 낮은 수치를 나타내고 지역간 유의한 차이를 나 타내었다(p-value=0.0120). 수집된 자료는 임령 범위에 비 해 바이오매스 범위에서 넓은 범위를 나타내었다(Figure 2). 이러한 결과는 지역간 환경적, 지리적 차이 때문으로 정도 높은 모형개발을 위해 다양한 임령별 바이오매스 자료 수집이 필요하다.
Figure 2. The box-plot for age, and biomass by region.
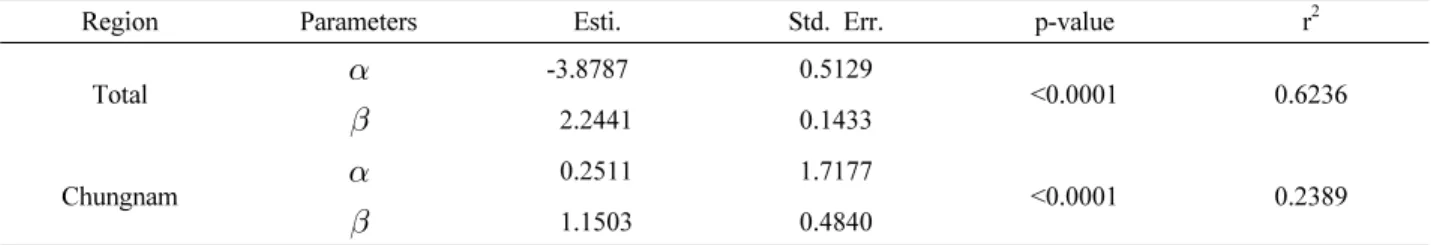
Region Parameters Esti. Std. Err. p-value r2
Total -3.8787 0.5129
<0.0001 0.6236
2.2441 0.1433
Chungnam 0.2511 1.7177
<0.0001 0.2389
1.1503 0.4840
Note: Esti. (the estimation of parameter), Std. Err. (the standard of error).
Table 2. Estimated parameters and fit statistics for the age-biomass relation using fixed effect.
Figure 3. The relation of biomass verse age using fixed effects.
Variance-covariance
2.4203
-1.0022 0.4230
0.6240
AIC 377.7
Note: AIC(akaike information criterion).
Table 3. Variance-covariance matrix for the random-effect, and fit statistics.
2. 고정효과의 모수 결과
임령과 바이오매스 관계를 나타내는 고정효과 모형의 모수는 에서 -3.8787이고 이것은 임령과 바이오매스에 대한 상수이다(Table 2). 는 2.2441이고 이것은 임령에 따라 변하는 상대생장계수이다. 충남지역 자료에서 임령 과 바이오매스 관계를 나타내는 고정효과의 모수(, ) 는 0.2511, 1.1503이다. 고정효과의 모수에 대한 표준오 차는 추정된 값의 0.06% 이하이고 p-값, 결정계수는 통 계적으로 유의한 수치를 나타내었다.
추정된 고정효과 모형을 이용하여 임령에 따른 바이오 매스는 Figure 3과 같다. 수집된 자료범위인 80년까지 바 이오매스 생장을 추정하는 경우 충남지역 바이오매스 모 형은 전체 자료 모형에 비해 초기 생장량은 우수하나 임 령에 따른 바이오매스 증가는 감소하는 경향을 나타내었 다. 이것은 수집된 자료의 범위가 다르고 장령림 바이오 매스 자료가 부족하기 때문이다. 또한, 일반적인 상대생 장식 형태인 지수형이 아닌 선형을 나타내고 있다. 그러 므로, 임의효과를 이용하여 고정효과 모형의 모수에 대 한 보정(calibration)이 필요하다.
3. 분산-공분산 행렬의 추정 결과
식 2에서 임의효과를 고려한 모형의 모수추정을 위해 바이오매스 차이를 고려하는 분산-공분산 행열 계산이
필요하다. 임의효과에 대한 공변량과 오차항을 추정하여 전체 자료의 바이오매스 분산은 2.4203이고 지역별 분산 은 0.4230이다(Table 3). 이러한 결과는 임령, 바이오매스 자료의 분포 범위가 줄었기 때문이다. 지역간 공분산은 – 1.0022로 지역적 차이에 따른 바이오매스 변화 경향은 적고 균일도가 높아지는 경향을 나타내었다. 이것은 지 역적 차이에 따른 공분산은 음의 값(-)을 나타낸다는 Trincado et al.(2006)의 연구 결과와 유사하다. Trincado et al.(2006)은 지역별 리기테다소나무 조림지 자료를 이 용하여 지역별 수고와 흉고직경의 변화량을 공분산 형태 로 제시하였다. 본 연구는 지역별 자료수 차이를 나타내 고 연속적인 자료 수집이 부족하여 장기적인 변화상 파 악에는 한계가 있다. 그러므로, 다양한 임령을 대상으로 바이오매스 자료의 지속적인 수집과 관찰이 필요하다.
혼합모형의 적용을 위해 적용된 AIC는 377.7을 나타내어 임의효과를 고려한 선행연구와 비교하여 이질적인 결과 는 없었다. AIC의 결과는 다수의 모형에서 최적의 모형 을 선택하는 기준으로 본 연구에서 제시된 혼합모형은 기존의 고정효과를 고려한 모형에 비해 높은 정도를 나 타내었다.
4. 임의효과를 포함하는 충남 바이오매스 모형 추정 충남지역 중부지방소나무 임분의 바이오매스 모형 개 발을 위해 충남지역 자료를 추출하여 임의효과 모수를 추정하였다. 지역간 바이오매스 차이에 대한 분산-공분
Figure 4. The relation of biomass versus age for Pinus densiflora in Chungnaml region with random effect.
산 행렬과 오차항을 식 3에 적용하여 임의효과의 계획행 렬(design matrix)을 산정하였다. 충남자료에서 추정된 행 렬(′)은 [-0.0698, 0.0728]이다. 이것을 식 2에 적용하여 임의효과를 포함하는 충남지역 임령에 따른 바이오매스 모형은 ln(Biomassij)=-3.94855+2.3169ln(Ageij)으로 조절 (calibration)이 가능하다. 여기서, 조절(calibration)은 기존 의 고정효과를 고려한 모형에 집단간 발생하는 임의효과 를 적용하여 모수가 변화한다는 의미이다. 임의효과를 적용한 결과에서 모형의 오차는 감소하고 적합도는 증가 하는 것으로 조사되었다.
고정효과를 이용한 전국, 충남지역 바이오매스 모형과 혼합모형을 이용한 충남지역 바이오매스 결과는 Figure 4와 같다. Figure 4에서 모형간 적합도를 비교하였을 때, 임의효과를 고려한 바이오매스 모형이 고정효과를 고려 한 모형에 비해 적합한 것으로 나타났다.
5. 임의효과의 적용성
기존의 임령-바이오매스 모형 개발 연구는 다양한 지 역에서 수집된 자료가 이용되어 특정 자료의 영향을 받 거나 장기적인 예측과정에서 문제가 발생한다. Lappi (1997)와 Lynch et al.(2005)은 범주형 자료에서 발생하는 자료간 차이를 임의효과를 이용하여 모형에 적용하는 방 안을 제시하였다. 본 연구는 지역적 차이를 고려하여 임 령과 바이오매스의 관계식을 제시하였다. 본 연구의 결 과에서 임의효과를 고려한 모형은 지역적 변화량 파악에 적합하고 그것의 효과를 분석하는데 활용이 가능한 것으 로 조사되었다. 그러므로, 다양한 지역에서 수집된 자료 를 이용하여 모형을 개발하는 경우 집단 간 관계를 파악 하고 효과를 분석하여 모형의 개발과정에 적용하는 과정 이 필요하다. 다양한 연구를 통해 모형의 개발과정에서 임의효과 및 조절(calibration)에 대한 필요성은 확인되었
으나 자료가 다양화되고 비선형을 나타내는 모형에 대한 연구는 지속적으로 필요하다.
결 론
본 연구는 지역 구분에 따른 임령과 바이오매스 차이 를 분석하고 충남지역의 임령과 바이오매스 모형식을 개 발하였다. 전국을 대상으로 임령과 바이오매스를 조사하 고 지역간 경향을 파악하여 고정효과와 임의효과를 비교 하였다. 임령과 바이오매스의 관계는 고정효과로 구분하 고 지역적 차이를 임의효과로 나타내었다. 임의효과를 고려한 모형은 AIC를 이용하여 선행연구와 비교하고 적 합성을 판단하였다. 고정효과의 모수는 중부지방소나무 표본을 참고하고 분산-공분산 행열을 추정하여 임의효과 를 제시하였다.
분산-공분산 행렬을 분석하여 지역적 바이오매스 차 이는 2.4203, 0.4230이고 공분산은 –1.0022, 오차항은 0.6240으로 나타났다. 모형의 적합도 검정을 위해 이용 된 AIC는 임의효과를 고려한 모형에서 377.7을 나타내어 기존의 임의효과를 고려한 모형 연구에 비해 이질적인 결과는 없었다. 추정된 분산-공분산 행열을 이용하여 고정효과 모형의 모수를 조절(calibration)하였을 때, 충남지역 중부지방소나무의 임령과 바이오매스 모형은 exp(-3.9485+2.3169ln(age))이고 고정효과 모형에 비해 임 의효과 모형에서 높은 적합도를 나타내었다. 이러한 결 과는 지역적 자료에 포함되어 있는 편향성을 임의효과를 이용하여 바이오매스 모형에 반영한 결과로 판단된다.
본 연구의 결과는 중부지방소나무의 지역별 임령과 바 이오매스 생장 변화량을 파악하여 정도 높은 모형 개발 과 범주형 자료 분석을 위한 임의효과의 적용성 판단에 활용이 가능하다. 본 연구 결과를 통해 기존 산림부문 생 장모형 연구에서 간과되었던 범주형 자료의 분석과 변수 간 관계를 설명하는 통계학 모형 연구의 필요성을 제시 하였다. 향후, 자료의 속성이 다양해지고 복잡화되어 인 자간 관계를 설명하는 모형 연구의 필요성은 증가할 것 이다. 이에 대한 연구 방안으로 임의효과를 이용한 설명 변수간 관계 파악 및 범주형 자료의 비선형 모형 연구가 필요하다.
감사의 글
본 연구는 2012년도 국립산림과학원 리서치 펠로우쉽의 지 원에 의해 이루어진 것임.
References
Budhathoki, C.B., Lynch, T.B. and Guldin, J.M. 2008. A Mixed-effects model for the dbh-height relationship of shortleaf pine(Pinus echinata Mill.). Southern Journal of Applied Forestry 32(1): 5-11.
Clutter, J.L., Fortson, J.C. Pienaar, L.V., Brister, G.H. and Bailey, R.L. 1983. Timber Management - A Quantitative Approach. John Wiley and Sons. pp. 31-58.
Choi, J.S. 2016. Estimable functions of mixed models. The Korean Journal of Applied Statistics 29(2): 291-299.
Jeong, S.O. and Shin, K.I. 2013. Semiparametric and nonparameteric mixed effects models for small area estimation. The Korean Journal of Applied Statistics 26(1): 71-79.
Jo, J.N. and Chang, U.J. 2013. A statistical analysis of the fat mass repeated measures data using mixed model.
Journal of the Korean Data and Information Science Society 24(2): 303-310.
Kim, H. 1999. Review of repeated measures data analysis and PROC MIXED. Journal of the Korean Society of Health Statistics 24(1): 7-15.
Lappi, J. 1997. A longitudinal analysis of height/diameter curves. Forest Science 43(4): 555-570.
Lappi, J. and Bailey, R.L. 1988. A height prediction model with random stand and tree parameter: An alternative to traditional site index methods. Forest Science 34(4):
907-927.
Lee, Y.J., Coble, D.W., Pyo, J.K., Kim, S.H., Lee, W.K.
and Choi, J.K. 2009. A Mixed-effects height-diameter model for Pinus densiflora trees in Gangwon province, Korea. Journal of Korean Forest Society 98(2): 178-182.
Lee, Y.J. 2015. Review of mixed-effects models. The Korean Journal of Applied Statistics 28(2): 123-136.
Liang, J. and Picard, N. 2013. Matrix model of forest dynamics: An overview and outlook. Forest Science 59(3): 359-378.
Liu, X.Q., Rong, J.Y. and Liu, X.Y. 2008. Best linear unbiased prediction for linear combinations in general mixed linear models. Journal of Multivariate Analysis 99: 1503-1517.
Lynch, T.B., Holly, A.G. and Stevenson, D.J. 2005. A random-parameter height-dbh model for Cherrybark oak.
Southern Journal of Applied Forestry 29(1): 22-26.
Mcculloch, C.E., Searle, S.R. and Neuhaus, J.M. 2008.
Generalized, Linear, and Mixed Models. John Wiley and
Sons, Incorporation. pp. 7-10.
Pyo, J.K., Lee, S.T., Seo, K.Y. and Lee, K.J. 2015.
Applicability evaluation of a mixed model for the analysis of repeated inventory data: A case on Quercus variabilis stands in Gangwon region. Journal of Korea Forest Society 104(1): 111-116.
Robinson, G.K. 1991. That BLUP is a good thing: The estimation of random effects. Statistical Science 6(1):
15-51.
Ryu, J.S. and Cho, J.S. 2016. The wage determinants of the vocational high school graduates using mixed effects mode. Journal of the Korean Data and Information Science Society 27(4): 935-946.
SAS Institute, Inc. 2014. SAS/STAT 9.4 User′s Guide. SAS Institute, Incorporation. Cary. North Carolina. pp. 489.
Searle, S.R. 1982. Matrix algebra useful for statistics. John Wiley and Sons, Incorporation. pp. 200-201.
Sharma, M. and Parton, J. 2007. Height-diameter equations for boreal tree species in Ontario using a mixed-effects modeling approach. Forest Ecology and Management 249: 187-198.
Trincado, G. and Burkhart, H.E. 2006. A generalized approach for modeling and localizing stem profile curves.
Forest Science 52: 670-682.
Trincado, G., Vanderschaaf, C.L. and Burkhart, H.E. 2007.
Regional mixed-effects height-diameter models for loblolly pine (Pinus taeda L.) plantations. European Journal of Forest Research 126: 253-262.
Vanderschaaf, C. 2008. Stand level height-diameter mixed effects models: parameters fitted using Loblolly pine but calibrated for sweetgum. Proceeding of the 16th central hardwoods forest conference. pp. 386-393.
Vargas-larreta, B., Castedo-dorado, F., Alvarez-gonzalez, J.G., Barrio-anta, M. and Cruz-cobos, F. 2009. A generalized height-diameter model with random coefficients for uneven-aged stands in El Salto, Durango (Mexico).
Forestry 82(4): 445-462.
Zhang, Y. and Borders, B.E. 2004. Using a system mixed- effects modeling method to estimates tree compartment biomass for intensively managed loblolly pines-an allometric approach. Forest Ecology and Management 194: 145-157.
(Received: October 13, 2016; Accepted: February 9, 2017)