Pituitary Adenylate Cyclase-activating Polypeptide (PACAP) Treatment during Pre-maturation Increases the Maturation of Porcine Oocytes Derived from Small Follicles
Kyu-Mi Park
1,2, Kyoung-Ha So
1,2,†and Sang-Hwan Hyun
1,2,†1
Institute of Stem Cell & Regenerative Medicine, Chungbuk National University, 1 Chungdae-ro, Seowon-gu, Cheongju 28644, Republic of Korea
2
Laboratory of Veterinary Embryology and Biotechnology, Veterinary Medical Center and College of Veterinary Medicine, Chungbuk National University, 1 Chungdae-ro, Seowon-gu, Cheongju 28644, Republic of Korea;
Abstract
Cellular cyclic adenosine-3’ 5’-monophosphate (cAMP) modulator is known as meiotic inhibitor and can delays spontaneous maturation in IVM experiment. Among many cAMP modulators, the role of Pituitary adenylate cyclase activating polypeptide (PACAP) on IVM isn’t known. The purpose of this study is to improve the maturation of oocytes derived from follicles ≤ 3 mm in diameter through PACAP as meiotic inhibitor during pre-in vitro maturation (pre-IVM). First, we checked PACAP and its receptors in cumulus cells and, to establish the optimal phase and concentration of PACAP for pre-IVM, we conducted chromatin configuration assessments. As a result, the rate of GV (Germinal Vesicle) according to duration of pre-IVM was significantly decreased 12 h and 18 h after IVM (87.1 and 84.1%, respectively) compared to 0 h (99.4%). When COC was cultured for 18 h, the GV rate in the 1 µM of PACAP treatment group (82.1%) was significantly higher than any other PACAP treatment groups (60.5, 64.1, 74.4 and 69.9 %, respectively). So, we divided into four groups as follows; MF (the conventional IVM group, obtained from follicle from 3 to 6 mm in diameter), SF (the conventional IVM group, obtained from follicle ≤ 3mm in diameter), Pre-SF(-)PACAP (IVM group including 18 h pre-IVM without 1 µM of PACAP, obtained from follicle ≤ 3mm in diameter) and Pre-SF(+)PACAP (IVM group including 18 h pre-IVM with 1 µM of PACAP, obtained from follicle ≤ 3mm in diameter).
To examine the effect of PACAP during pre-IVM, we investigated analysis of nuclear maturation, intracellular glutathione (GSH) and reactive oxygen species (ROS) levels. In cumulus cells, PACAP receptors, ADCYAP1R1 and VIPR1 were detected but were not detected in oocytes. After IVM, the Pre-SF(+)PACAP had the highest Metaphase II rate (91.7%) among all groups (P<0.05). The GSH levels in the MF and Pre-SF(+)PACAP were significantly higher than in the other groups (P<0.05) and ROS levels was no significant difference among all groups. In conclusion, these results indicated that even though the oocytes were derived from SF, pre-IVM application of PACAP improved meiotic and cytoplasmic maturation by regulating intracellular oxidative stress.
Received :22 December 2017 Revised :14 February 2018
Accepted:14 March 2018 Key Words : Porcine, Oocyte, PACAP, Pre-in vitro maturation
INTRODUCTION
Mammalian oocytes in the ovarian follicle are arrested at the end of prophase I and resume the first meiotic division after exposure of the follicle to LH or their isolation from the follicle. Maturing oocytes progress to the second meiotic division and are interrupted at meiotic metaphase II, which is relieved after fertilization (Findlay. 2012). A conventional in vitro maturation (IVM) system to obtain matured oocytes is only appropriate for oocytes obtained from medium (from 3 to 6 mm in diameter;
MF) or large (≥ 6 mm in diameter) follicles, which have the capacity to resume meiosis and support early embryonic development (Wu et al., 2006). However, follicles in large animals comprise a wide range of follicular diameters, particularly many small follicles (≤ 3 mm in diameter; SF) as early antral follicles. When using a standard IVM system, few oocytes derived from SF were able progress to metaphase stage II and had a developmental competence compared with MF (Marchal et al., 2002). And, the growing oocyte isolated from small follicles is unlikely to respond to the gonadotropin surge and may undergo spontaneous meiotic processes without sufficient cytoplasmic maturation (Edwards. 1965).
Among various methods to increase IVM efficiency, pre-IVM application of meiotic inhibitors, including cellular cyclic adenosine-3’ 5’-monophosphate (cAMP) modulator, could more adequately mimic in vivo oocyte capacitation (Kwak et al., 2012).
As a result, this phase delays spontaneous maturation and stimulates gap-junctional communication between cumulus cells and oocytes (Richani et al., 2014). Nevertheless, the optimal phase of pre-IVM has not been established. When pre-IVM systems during the optimal phase was applied to porcine oocytes, which were derived from small follicles, we proposed that the oocyte synchronizes with nuclear and ooplasmic maturation by inhibition of spontaneous meiotic processes.
Pituitary adenylate cyclase activating polypeptide (PACAP), which increases cellular cyclic adenosine 3’5’-monophosphate (cAMP), is derived from the hypothalamus (Arimura. 2007) and is a member of the vasoactive intestinal peptide (VIP)- secretin-glucagon family. PACAP has not only been detected in the central nervous system but also in many peripheral organs, including reproductive and lymphoid organs (Arimura. 1998). PACAP has receptors such as VIPR1, VIPR2 and PAC1; PAC1 binds PACAP with high affinity and VIPR1 and VIPR2 bind VIP and PACAP with equivalent affinity (Sherwood et al., 2000).
Indeed, several studies of the role of PACAP in the gonads have implicated PACAP in follicular development Latini et al., 2010), antiapoptotic effects (Morelli et al., 2008) and implantation (Isaac et al., 2008). However, the physiological function of PACAP in mammalian oocyte during meiotic maturation remains unknown.
We hypothesized pre-IVM system using the cAMP modulator PACAP as meiotic and apoptosis inhibitor would improve meiotic and cytoplasmic maturation to oocytes isolated from SF. In the present study, first, PACAP and PACAP receptors expression was revealed on cumulus cells and oocytes. Second, we established an optimal pre-IVM phase and concentration of PACAP by evaluating the germinal vesicle stage. Third, the effects of pre-IVM treatment with PACAP on the maturation of oocyte derived from SF through nuclear maturation and intracellular levels of GSH and ROS was examined.
MATERIALS and METHODS
1. Chemicals
All chemicals and reagents were obtained from Sigma-Aldrich Chemical Company (St. Louis, MO, USA).
2. Ovary collection and classification
Ovaries of prepubertal gilts were obtained from a local abattoir and kept in 0.9% (w/v) NaCl solution between 32°C to 35°C.
Cumulus-oocyte complexes (COCs) were aspirated according to their follicle diameter: small (≤ 3 mm) and medium (3-6mm).
The COCs were aspirated using aspiration method. After washing in HEPES-buffered Tyrode’s medium (TLH) containing 0.05%
(w/v) polyvinyl alcohol (TLH-PVA), only compact COCs and homogenous cytoplasm were selected and washed three times in
TLH-PVA.
3. Pre-IVM and Fluorescent staining for assessment of chromatin configuration
The selected COCs were cultured in a four-well dish (Nunc, Roskilde, Denmark) with pre-IVM media containing 500 ml of culture medium (TCM199; Invitrogen Corporation) supplemented with 0.6 mM cysteine, 0.91 mM sodium pyruvate, 10 ng/ml of epidermal growth factor, 75 μg/ml of kanamycin and 1 μg/ml of insulin. The duration of the pre-IVM (0, 6, 12, 18 and 24 h) was commenced after all COCs were freed from the follicle. Following the pre-IVM period or IVM period respectively, all CCs around the oocytes were denuded by gently pipetting with 0.1% of hyaluronidase and washed in TLH-PVA. The denuded oocytes were fixed with 1% of formaldehyde and stained with Hoechst 33342 (10 μg/ml) for 7 minutes. The stained oocytes were evaluated using fluorescence microscope (TE300, Nikon, Japan) and classified as follows: germinal vesicle (GV), germinal vesicle breakdown (GVBD), metaphase I (MI), anaphase-telophase I (AT-I), or metaphase II (MII) according to meiotic maturation stage. The classification standard is according to the degree of chromatin mass condensation within GV based on previous studies (Dieci et al., 2013). To establish optimal concentration of PACAP, the selected COCs were cultured on IVM medium with PACAP (control, 500fM, 100pM, 10nM, and 1μM). Following the concentration of PACAP during the same pre-IVM period respectively, the oocytes were mechanically denuded from cumulus cells by 0.1% of hyaluronidase in TLH-PVA and then followed the same steps as above.
4. In vitro maturation (IVM)
Approximately 50-60 COCs derived from small follicle were transferred into culture medium as mentioned previously. The COCs were cultured in medium without (Pre-SF(-)PACAP group) or with 1 µM PACAP (Pre-SF(+)PACAP group) and placed at 39°C with of 5% CO
2in air for 18 h of the pre-IVM period. Following the pre-IVM period, COCs were washed twice in the conventional IVM medium containing 10% (v:v) porcine follicular fluid in pre-IVM medium. Then, 60 of COCs derived from medium follicle (MF group; control), small follicle (SF group) and Pre-matured groups were cultured with supplement containing 10 IU/ml of eCG and 10 IU/ml of hCG at 39°C and 5% CO
2. The COCs were maturated with or without hormones IVM medium for 20 to 22 hours each.
5. Evaluation of nuclear maturation
For the analyze of nuclear maturation after IVM, metaphase II (M II) stage of oocytes were stained and evaluated almost the same as for the assessment of chromatin configuration. After COCs were denuded by gently pipetting with 0.1% of hyaluronidase, the denuded oocytes washed in TLH-PVA and fixed with 1% of formaldehyde and stained with Hoechst 33342 (10 μg/ml) for 7 minutes. The stained oocytes were evaluated using fluorescence microscope (TE300, Nikon, Japan) and classified as GV, GVBD, MI, AT-I and MII according to meiotic maturation stage.
6. Measurement of intracellular ROS and GSH levels
After IVM of oocytes, intracellular GSH and ROS levels were determined. Glutathione and ROS level assessments were carried out as previously described (Cheng et al., 2004; You et al., 2010). Briefly, 2’,7’-dichlorodihydrofluorescein diacetate (H2DCFDA;
Invitrogen Corporation) and 4-chloromethyl-6.8-difluoro-7-hydroxycoumarin (Cell Tracker Blue; Invitrogen Corporation) were used
to detect intracellular ROS levels as green fluorescence and GSH levels as blue fluorescence, respectively. The matured oocytes
from each group were treated with TLH-PVA and then incubated with 10 μM of H2DCFDA and 10 μM of Cell Tracker Blue
for 30 minutes in the darkroom. After incubation, the oocytes were washed with DPBS containing 0.1% (w/v) PVA and
fluorescence was observed using an epifluorescence microscope (TE300; Nikon, Japan) with UV filters (460 nm and 370 nm for
ROS and GSH respectively). Fluorescent images were saved as graphic files in JEPG format and then the intensity of oocytes
was measured by Adobe Photoshop CS3 software (Version 10.0, San Jose, CA, USA) and normalized to control oocytes. The
experiment was replicated three times.
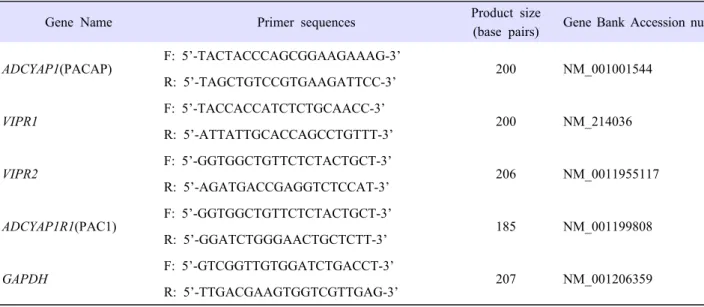
7. Reverse transcription polymerase chain reaction analysis (RT-PCR)
Trizol reagent (Invitrogen, CA, USA) was used for total RNA extraction from matured cumulus cells and oocytes. To produce cDNA, RNA was transcribed by Moloney murine leukemia virus (MMLV) reverse transcriptase with random primer. Each cDNA was used as template and mixed with primers and H
2O that primers information is described at Table 1. Polymerase chain reaction amplification is carried out by 40 cycles of 30 sec at 95°C, 30 sec at 58°C, 30 sec at 72°C. And then, product was confirmed by electrophoresis using 1.5% of agarose gel. As a size maker, DNA molecular weight 100-bp ladder (Mannheim, Germany) was used.
Gene Name Primer sequences Product size
(base pairs) Gene Bank Accession number
ADCYAP1(PACAP) F: 5’-TACTACCCAGCGGAAGAAAG-3’
200 NM_001001544
R: 5’-TAGCTGTCCGTGAAGATTCC-3’
VIPR1 F: 5’-TACCACCATCTCTGCAACC-3’
200 NM_214036
R: 5’-ATTATTGCACCAGCCTGTTT-3’
VIPR2 F: 5’-GGTGGCTGTTCTCTACTGCT-3’
206 NM_0011955117
R: 5’-AGATGACCGAGGTCTCCAT-3’
ADCYAP1R1(PAC1) F: 5’-GGTGGCTGTTCTCTACTGCT-3’
185 NM_001199808
R: 5’-GGATCTGGGAACTGCTCTT-3’
GAPDH F: 5’-GTCGGTTGTGGATCTGACCT-3’
207 NM_001206359
R: 5’-TTGACGAAGTGGTCGTTGAG-3’
Table 1. Primer Sequences for analysis of mRNA gene expression.
8. Experimental design
In experiment 1, the expression of PACAP and its receptors in cumulus cells and oocytes was carried out by RT-PCR. In experiment 2, the effect of treatment with various pre-IVM duration (0, 6, 12, 18 and 24 h) and concentration of PACAP (control, 500fM, 100pM, 10nM, 1μM) on nuclear maturation was examined to identify the optimal concentration and duration for delay of spontaneous meiotic processes. In experiment 3, the effect of pre-IVM with PACAP treatment on nuclear maturation and intracellular levels of GSH and ROS was investigated.
9. Statistical analysis
Statistical analyses were done through SPSS 17.0 (SPSS, Inc., Chicago, IL, USA). A one-way ANOVA with Duncan’s multiple range test was used to assess percentage data of rates of maturation and levels of GSH and ROS. Data are presented as the mean
±SEM. Differences at P<0.05 were considered significant, unless otherwise stated.
RESULTS
1. Expression of PACAP and its receptor into the cumulus cells and oocytes.
Expression of PACAP (ADCYAP1) and its receptors such as ADCYAP1R1(PAC1), VPAC1, and VIPR2 into the cumulus cells
and oocytes was detected by RT-PCR. As shown in Figure 1, ADCYAP1R1(PAC1) and VPAC1 were expressed in cumulus cells
but not in oocytes. GAPDH is used as a control.
Figure 1. Identification of PACAP (ADCYAP1) and its receptors in the cumulus cells and oocytes by reverse transcription polymerase chain reaction (RT-PCR). GAPDH is used as control.
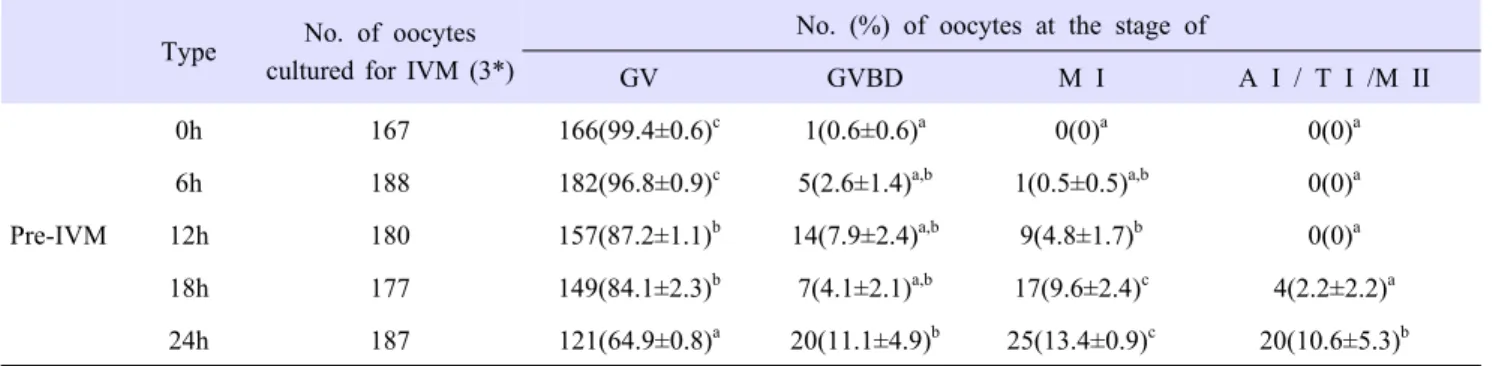
2. Establishment of the optimal pre-IVM duration
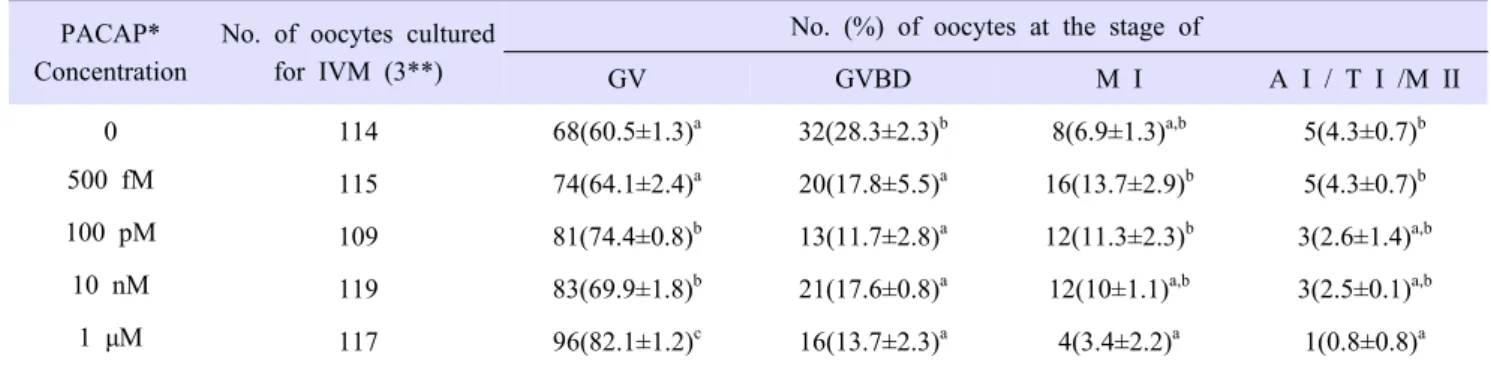
In the first set of experiments, we determined the time and concentration of PACAP that could prevent germinal vesicle breakdown (GVBD) in oocytes. COCs derived from SF were cultured for varying periods (0, 6, 12, 18 and 24 h). We aimed to delay GVBD of oocytes. As shown in Table 2, not only the rate of GVBD in these groups, except the 0 and 24 h groups, but also the rate of germinal vesicle (GV) between the 12 and 18 h groups showed no statistical significance. The GV rate for the 24 h groups rapidly decreased compared with those of the 12 and 18 h groups (P<0.05). Thus, we set the pre-IVM phase at 18 h. COCs derived from SF were cultured in media supplemented with increasing concentrations of PACAP (0, 500 fM, 100 pM, 10 nM and 1 µM) during 18 h. As shown in Table 3, when COC was cultured for 18 h, the GV rate in the 1 µM of PACAP treatment group was higher than the other PACAP treatment groups (P<0.05). Based on these results, 1 µM PACAP was treated at Pre-IVM for 18 h.
Type No. of oocytes cultured for IVM (3*)
No. (%) of oocytes at the stage of
GV GVBD M I A I / T I /M II
Pre-IVM
0h 167 166(99.4±0.6)
c1(0.6±0.6)
a0(0)
a0(0)
a6h 188 182(96.8±0.9)
c5(2.6±1.4)
a,b1(0.5±0.5)
a,b0(0)
a12h 180 157(87.2±1.1)
b14(7.9±2.4)
a,b9(4.8±1.7)
b0(0)
a18h 177 149(84.1±2.3)
b7(4.1±2.1)
a,b17(9.6±2.4)
c4(2.2±2.2)
a24h 187 121(64.9±0.8)
a20(11.1±4.9)
b25(13.4±0.9)
c20(10.6±5.3)
bThe date is mean±SEM
* Replication number
a,b,c
Values with different superscripts with a column were different (p<0.05).
Abbreviation: A I /T I /M II, anaphase I / telophase I / metaphase II; GV, germinal vesicle; GVBD, germinal vesicle breakdown;
M I, metaphase I
Table 2. Nuclear status of porcine oocytes according to time of in vitro maturation.
PACAP*
Concentration
No. of oocytes cultured for IVM (3**)
No. (%) of oocytes at the stage of
GV GVBD M I A I / T I /M II
0 114 68(60.5±1.3)
a32(28.3±2.3)
b8(6.9±1.3)
a,b5(4.3±0.7)
b500 fM 115 74(64.1±2.4)
a20(17.8±5.5)
a16(13.7±2.9)
b5(4.3±0.7)
b100 pM 109 81(74.4±0.8)
b13(11.7±2.8)
a12(11.3±2.3)
b3(2.6±1.4)
a,b10 nM 119 83(69.9±1.8)
b21(17.6±0.8)
a12(10±1.1)
a,b3(2.5±0.1)
a,b1 μM 117 96(82.1±1.2)
c16(13.7±2.3)
a4(3.4±2.2)
a1(0.8±0.8)
aThe date is mean±SEM
* pituitary adenylate cyclase activating polypeptide
** Replication number
a,b,c
Values with different superscripts with a column were different (p<0.05).
Abbreviation: A I /T I /M II, anaphase I / telophase I / metaphase II; GV, germinal vesicle; GVBD, germinal vesicle breakdown;
M I, metaphase I
Table 3. Effect of Pre-IVM with PACAP treatment on nuclear status depending on 18 h.
3. Effect of Pre-IVM with PACAP on nuclear and cytoplasmic maturation during IVM
We evaluated the MII stage to analyse nuclear maturation at the end of the culture periods. As shown in Table 4, the rates of oocytes reaching MII were significantly higher in oocytes from the Pre-SF(+)PACAP group than those from the other groups (P<0.05). The GV rates of the Pre-IVM treatment groups were significantly lower than those of the MF and SF groups (P<0.05).
To assess cytoplasmic maturation, we examined the intracellular GSH and ROS levels in MII oocytes. As shown in Figure 2, the intracellular GSH levels of oocytes were significantly increased (P<0.05) in the Pre-SF(+)PACAP and MF groups compared with the Pre-SF(-)PACAP and SF groups. There were no significant differences in ROS levels.
Table 4. Effect of Pre-IVM with PACAP treatment on nuclear maturation in porcine oocytes.
Type
No. of oocytes cultured for IVM
(3*)
No. (%) of oocytes at the stage of
GV M I A I /T I M II
MF 142 17(12±0.6)
b6(4.2±1.2)
a3(2.2±2.2) 116(81.7±1)
bSF 173 31(17.9±3)
c16(9.2±1.2)
b8(4.6±1.5) 118(68.2±1.9)
aPre-SF(-)PACAP 169 10(5.9±1.2)
a16(9.4±1.1)
b5(3±0.6) 138(81.7±0.5)
bPre-SF(+)PACAP 168 3(1.8±1)
a7(4.2±2.1)
a4(2.3±1.6) 154(91.7±0.4)
cThe data are mean±SEM
* Replication number
a,b,c