J. Fish Pathol., 33(1) : 023~034 http://dx.doi.org/10.7847/jfp.2020.33.1.023
Introduction
Climate change affects marine and inland ecosys- tems with physical-chemical consequences such as hypoxia, stratification and salinity changes (Barange
et al. 2009). Hypoxia has a wide range of effects on behavior, survival rate, and growth performance of fish (e.g., Goldberg, 1995; Diaz and Rosenberg, 2008;
Levin et al., 2009; Somero, 2012). It has been shown that exposure to hypoxia can increase pathogen-re- lated mortality and impair immunity of fish and in- vertebrates (Welker et al., 2007; Breitburg et al., 2015). Hence, low dissolved oxygen (DO) level and
Changes in hematoserological profiles and leukocyte redistribution in rainbow trout (Oncorhynchus mykiss)
under progressive hypoxia
HyeongJin Roh
*, Bo Seong Kim
*, Ahran Kim
*, Nameun Kim
*, Mu Kun Lee
**, Chan-Il Park
***and Do-Hyung Kim
*†*
Department of Aquatic life Medicine, College of Fisheries Science, Pukyong National University, Busan, Republic of Korea
**
Korean Aquatic Organism Disease Inspector Association, Busan, Republic of Korea
***
Department of Marine Biology & Aquaculture, College of Marine Science, Gyeongsang National University, Tongyeong, Republic of Korea
In recent years, global warming is causing dramatic environmental changes and deterioration, such as hypoxia, leading to reduced survival rate and growth performance of farmed aquatic animals. Hence, understanding systemic immuno-physiological changes in fish under environmental stress might be important to maximize aquaculture production. In this study, we investigated physiological changes in rainbow trout exposed to hypoxic stress by monitoring changes in blood chemistry, leukocyte pop- ulation, and expression levels of related cytokine genes. Hematological and serological factors were evaluated in blood obtained from rainbow trout sampled at a dissolved level of 4.6 mg O
2L
-1and 2.1 mg O
2L
-1. Blood and head kidney tissue obtained at each sampling time point were used to determine erythrocyte size, leukocyte population, and cytokine gene expression. The level of LDH and GPT in fish under progressive hypoxia were significantly increased in plasma. Likewise, the (Granulocyte + Macrophage)/lymphocyte ratio (%) of fish exposed to hypoxia was significantly lower than that in fish in the control group. Such changes might be due to the rapid movement of lymphocytes in fish exposed to acute hypoxia. In this study, significant up-regulation in expression levels of IL-1β and IL-6 gene appeared to be involved in the redistribution of leukocytes in rainbow trout. This is the first study to demonstrate the involvement of cytokines in leukocyte trafficking in fish exposed to hypoxia. It will help us understand systemic physiological changes and mechanisms involved in teleost under hypoxic stress.
Key words: Progressive hypoxia; Hematology; Leukocyte redistribution; Rainbow trout
†Corresponding author: Do-Hyung Kim Tel: +82-51-629-5945; Fax: +82-51-629-5945 E-mail: [email protected]
human-induced hypoxia could threaten hypoxia-sen- sitive organisms such as rainbow trout (Oncorhynchus mykiss), grayling (Thymallus thymallus), asp (Aspius aspius), pike (Esox Lucius), flounder (Platichthys fle- sus), and Russian sturgeon (Acipencer gueldenstaedtii) (Lai et al., 2006; Rytkönen et al., 2007). Moreover, most farmed fish are potentially in danger because they have to face progressive hypoxia (continuously decreasing DO level with times) due to oxygen pump failure, electricity dysfunction and influx of oxygen deficient water. Unfortunately, understanding immu- nological influence and hemato/serological changes under progressive hypoxia is very limited (Poulsen et al., 2011; Nishizawa et al., 2017). Poulsen et al.
(2011) and Nishizawa et al. (2017) have investigated fish behavior and physiological characteristics of mar- bled sole and rainbow trout under progressive hypo- xia for 260 and 240 min, respectively. They found that progressive hypoxia affected behavioral activity of fish, suggesting that physiological and immuno- logical imbalances might have been triggered by hy- poxia.
Several studies (e.g., Van Raaij et al., 1996; Peters- en and Gamperl, 2010; Ni et al., 2014) have shown numerous physiological adjustments in fish after acute exposure to hypoxia, including increased levels of cortisol, glucose, erythrocytes, and/or hemoglobin.
Saint-Paul (1984) found that hypoxic conditions in- duced changes of hematological index (e.g., hemoglo- bin and RBC count) in characoid fish. Taken together, hypoxia stress can be a critical factor that leads to an imbalance of cortisol and other hematological/sero- logical factors (e.g., glucose, lactate) (O’Connor et al., 2011). Such changes can affect various physio- logical and immunological characteristics. Maule and Schreck (1990) have found that the number of leuko- cytes is significantly increased in the kidney but sig- nificantly decreased in blood and spleen of corti- sol-fed coho salmon (Oncorhynchus kisutch), indicat- ing that serological changes under hypoxia can broad- ly change fish immune system and physiological char-
acteristics rather than local tissue devastation. There- fore, understanding immunological changes including leukocyte movement, cytokines, and hemato/serologi- cal factors under progressive hypoxic stress is crucial.
In rainbow trout, previous studies have demon- strated that hypoxia affects their physiological re- sponses, including reduction of digestive and growth performance, modification of erythropoietin level, and delay of hematopoiesis and embryo development (See Table S1) (Van Raaij et al., 1996; Lai et al., 2006;
Bianchini and Wright, 2013; Eliason and Farrel, 2014; Liu et al., 2017). However, those studies did not investigate changes in leukocyte distribution or cytokines expression, although influences of stress on leukocyte trafficking in mammals are well-docu- mented (Davis et al., 2008). A few studies (Saint- Paul, 1984; Maule and Schreck, 1990) have tried to understand changes in leukocytes distribution of rain- bow trout after exposure to hypoxia, but there is still lack of data. The objectives of this study were: 1) to understand systemic changes occurring in fish un- der hypoxia stress using varying serological parame- ters, and 2) to monitor morphological changes of er- ythrocytes and movement of leukocyte known to in- teract with cytokine expression in the head kidney.
Materials and Methods
Hypoxia stress
Rainbow trout (Onchorhynchus mykiss) (body weight
= 76.1 ± 12.6 g) were purchased from a commercial
farm in Korea and maintained in aerated, dechlori-
nated fresh water at 15°C. Health status of fish was
examined immediately upon arrival in the aquaria and
at one week thereafter. During one week of acclima-
tion, water pumped from a water cooler (Fish Cooler,
Daeil Cooler Co. CTD) created a clockwise current
in the tank. Half of the rearing water was exchanged
daily Fish were fed with commercial dry-pellet at a
rate of 1% of their body weight during the acclimation
period. Feeding was stopped one day before starting
the experiment. Thirty-six rainbow trout were sepa- rated into two ovoid tanks (125L), and they were ac- climated for a week. Hypoxia stress was induced by stopping aeration to fish tank. Dissolved oxygen (DO) was continuously monitored using a DO-meter (Multi 90i, iSTEK, Korea) at 10, 20, 30, 60, 90, 120, and 150 min after stopping aeration. Total ten fish from randomly selected five fish in two tanks for the hypo- xia group were sampled when DO levels reached 4.6 and 2.1 mg O
2L
-1at 60 and 150 min after stopping aeration, respectively. Ten trout with DO level at 8.6 mg O
2L
-1(normoxia) were achieved before starting the experiment as control. Sampled fish were euthan- ized with an excess of anesthetic (Ethyl 3-amino- benzoate methanesulfonate; MS-222; Sigma). Blood collected from the caudal vein was anticoagulated with either heparin or 3.8% sodium citrate depending on the purpose of further experiment. Head kidney
was taken and divided into three parts. One part was treated with RNAlater
TM(Invitrogen, Lithuania) and stored at -80°C. One part was fixed with 10% neutral buffered formalin while the other part was kept on ice for further analysis.
Hemato-serological analysis
Blood (approximately 2 ml each) was collected from a total of 30 fish for hematological and bio- chemical tests in this study. After mixing 75 μl of blood obtained from each fish with 25 μl of 3.8%
sodium citrate, the anticoagulated blood was trans- ferred into a plane capillary tube which was then ver- tically placed for an hour to measure erythrocyte sedi- ment rate (ESR). Except for ESR measurement, hep- arin was used as an anticoagulant for all other sero- logical tests. Venous blood was transferred into a hep- arinized capillary tube and hematocrit (Hct) was de- Table S1. Comparison of experimental conditions and results of studies using rainbow trout
Dissolved oxygen
(mg O
2L
-1) Exposure duration
Tempera-
ture (℃) Results References
Hypoxic Normoxic 4.4, 6.7,
and 8.9 11 ~1.5 h 10-11 Hypoxic stress reduced digestive performance of rainbow trout.
Eliason and Farrel, (2014)
2.5
+9.1
+3 h 15
Fish exposed to hypoxia showed dramatic increased behavior index, and were killed.
Van Raaij et al., 1996
5.0 and 2.5 11 24 h 8
Hypoxic stimulus during early development increased glucose metabolism in juvenile fish.
Liu et al., 2017
5.9 and 3.2
+10.8
+4, 8, 12, 24, 48, 72, 144,
216 h
12
Erythropoietin levels was increased in the head-kidney but decreased in the spleen of fish under hypoxia.
Lai et al., (2006)
3.4
+11.3
+60-65 d 10 Hypoxia delays hematopoiesis and embryo development of fish.
Bianchini and Wright (2013)
Sampled when DO level reached to 4.6
and 2.1
8.6
1, 2.5 h (Time to reach 4.6,
2.1 mg O
2L
-1)
15
Hypoxia induced significant decrease of granulocyte/lymphocyte ratio, which might be related to significant increase of proinflammatory cytokines (IL-1β and IL-6), and production of different isoforms of HSP70.
This study
+
DO level was inferred from % saturation based on DO calculator (MIT License, 2015).
termined after centrifuging at 12,000 rpm for 10 min (Digital Centrifuge, Digisystem Laboratory Instru- ments Inc., Taiwan). For RBC count and total hemo- globin concentration, blood was diluted 200 to 1,000 fold, respectively with phosphate buffered saline (PBS, pH 7.2-7.4) and analyzed using a hemocy- tometer and hemoglobin assay kit (Sigma, USA). For biochemical analysis, plasma was used to determine levels of glutamic oxaloacetic transaminase (GOT), glutamic pyruvic transaminase (GPT), alkaline phos- phatase (ALP), blood urea nitrogen (BUN), lactate de- hydrogenase (LDH), glucose (GLU), total protein (TP), total cholesterol (TCHO), and calcium (Ca) us- ing an automated dry chemistry analyzer (FUJI DRI- CHEM 3000).
Mean corpuscular volume (MCV, μm
2) was ob- tained using the following formula: MCV = 10 × Hct (%) divided by RBC count (as million unit). Mean corpuscular hemoglobin (MCH, pg) was calculated by dividing total mass of Hb (g·dl
-1) by RBC count (as million unit): MCH = (Hgb × 10)·RBC
-1. Mean cor- puscular hemoglobin concentration (MCHC) was used to measure the concentration of hemoglobin. It was calculated with the following equation: MCHC = [Hb (g·dl
-1) / Hct (%)] × 100.
Flow cytometry
Leukocytes were isolated from the head kidney us- ing a modified method as described previously (Kim and Austin, 2006) to determine the ratio of macro- phage to granulocyte and lymphocyte population.
Briefly, the head kidney of each trout was grinded onto a 70-μm nylon mesh in RPMI-1640 (Sigma, USA) supplemented with 2% fetal bovine serum (FBS, Gibco), 1% Anti-anti (Antibiotic-Antimycotic;
Gibco), and 10 IU · ml
-1heparin. Filtered suspensions were then placed onto 34/51% percoll gradient diluted by Hank's balanced salt solution and centrifuged at 400 g for 25 min at 4°C. Leukocyte band layered between 34% and 51% percoll was obtained and washed twice with RPMI-1640 medium as followed
by previous study (Kim and Austin, 2006). Head kid- ney leukocytes and whole blood diluted 200 to 1,000 folds with Leivovitz's L-15 media were then analyzed with a flow cytometer (Accuri C6
TMFlow Cytometer, BD Biosciences) by randomly selecting 10,000 cells within 1 hr. Head kidney leukocytes attached onto slide-glass were stained with May-Giemsa. Different types of leukocytes were observed under a light microscope.
Histopathology
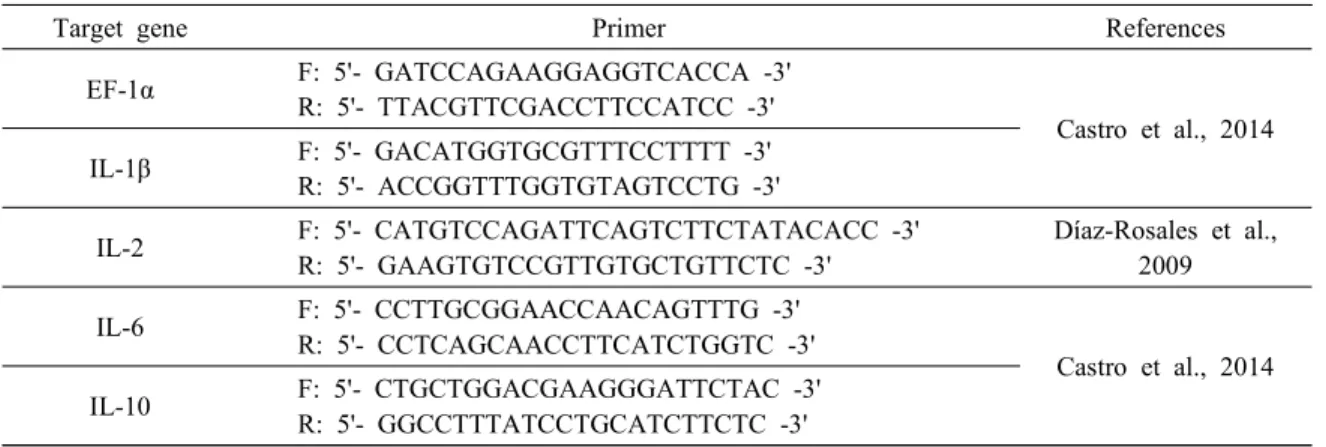
After the head kidney was fixed in 10% neutral buffered formalin (BBC biochemical, USA) for histo- pathological observation and quantification of differ- ent kinds of leukocytes. After fixed organ was dehy- drated and washed with graded alcohol and xylene, it was embedded in paraffin wax. Sections (approxim- ately 4 μm in thickness) from each embedded tissue block were stained with hematoxyline-eosin (BBC bi- ochemical, USA). Possible changes of types of leuko- cytes population in head kidney were analyzed by counting macrophages and lymphocytes in magnified (x400) microphotographs. In histopathological exami- nation, lymphocytes and granulocytes/macrophages in
× 400 magnified head kidney sections originated from 7, 6, and 6 fish sampled from normoxia group, sub-hypoxia, and lethal hypoxia groups, respectively, were counted because not enough head kidneys re- mained.
RNA extraction and cDNA synthesis
Total RNA was isolated using Trizol (Life Tech- nologies
TM) according to the manufacturer’s protocol.
One microgram of total RNA after treating with
DNase (Sigma, USA) was used to synthesize cDNA
using a MMLV-reverse transcriptase kit (Bioneer,
Korea). Briefly, 100 pmol of oligo dT was supple-
mented to 1μg of RNA suspension, and 10μl of DEPC
water was added. RNA was supplemented with 5X
M-MLV reverse transcriptase reaction buffer. Then
100 mM DTT, dNTP, and reverse transcriptase were
added. The reaction mixture was brought up to a final volume of 20 μl. After heating at 65°C for 10 min, cDNA was synthesized at 40°C for 1 h and 95°C for 5 min.
Real-time PCR (Quantitative PCR)
Real-time PCR was performed to determine ex- pression levels of IL-1β (Interleukin-1β), IL-2 (Inter- leukin-2), IL-6 (Interleukin-6), IL-10 (Interleukin-10) and EF-1α (Elongation factor-1α) genes using 2 μl of synthesized cDNA as template. PCR mixtures were prepared as follows: 12.5 μl of SYBR Green 2X mas- ter premix (Mbiotech, Korea), 8.5 μl of distilled wa- ter, 2 μl of cDNA, and 1 μl of forward/reverse primer (10 μM). Primer sequence are listed in Table 1. For all genes except IL-2, PCR was performed as follows:
1 cycle of pre-denaturation at 95°C for 10 min fol- lowed by 40 cycles of 15 s at 95°C and 60 s at 60°C according to previously described method (Castro et al. 2014). Real-time PCR for quantification of IL-2 transcripts was performed by incubating at 94°C for 3 min followed by 42 cycles of 20 s at 94°C, 20s at 60°C, and 30 s at 72°C. Expressed levels of genes were normalized against the level of EF-1α (Castro et al. 2014). Fold changes were calculated using the 2
–ΔΔCtmethod and melting curve of each reactions was observed to verify non-specific amplification.
Statistical analysis
Hematological and serological results, qPCR re- sults and leukocyte population were subjected to one- way analysis of variance (ANOVA) in SPSS (20.0) based on Duncan's multiple range test or Student's-t test. Significant differences among groups and/or con- trol were represented by different letters or asterisk when P-value was less than 0.05. Results are express- ed as mean ± standard deviation (SD).
Results
Hematology
Since two dead rainbow trout were observed when decreasing DO level up to 2.1 mg L
-1, 2.1 mg L
-1of DO group was considered as a lethal group in this study. All hematological and serum biochemical pa- rameters (RBC count, Ht, Hb, MCV, MCHC, ESR, GOT, GPT, ALP, BUN, GLU, TCHO, TP, LDH, and Ca) in rainbow trout exposed to hypoxic stress (sub- hypoxia and lethal hypoxia groups) or control (nor- moxia) are shown in Table 2. RBC counts were in- creased after exposure to hypoxia stress compared to those observed in control animals (pre-exposure). Hb concentration also tended to increase when DO level in rearing water was decreased. LDH and GPT levels in the lethal hypoxia group were significantly higher than those in the control group, although they were not significantly different between the control group
Table 1. Primers used in this study
Target gene Primer References
EF-1α F: 5'- GATCCAGAAGGAGGTCACCA -3'
R: 5'- TTACGTTCGACCTTCCATCC -3'
Castro et al., 2014
IL-1β F: 5'- GACATGGTGCGTTTCCTTTT -3'
R: 5'- ACCGGTTTGGTGTAGTCCTG -3'
IL-2 F: 5'- CATGTCCAGATTCAGTCTTCTATACACC -3'
R: 5'- GAAGTGTCCGTTGTGCTGTTCTC -3'
Díaz-Rosales et al., 2009
IL-6 F: 5'- CCTTGCGGAACCAACAGTTTG -3'
R: 5'- CCTCAGCAACCTTCATCTGGTC -3'
Castro et al., 2014
IL-10 F: 5'- CTGCTGGACGAAGGGATTCTAC -3'
R: 5'- GGCCTTTATCCTGCATCTTCTC -3'
and the sub-hypoxia group.
Leukocyte population in the head kidney Distribution of leukocytes in the head kidney is shown in scatter plots (Fig. 1). Populations in P7 and P8 regions shown in Fig. 1 represent macrophages/
granulocytes and lymphocytes, respectively, as con- firmed by May-Giemsa staining. Granulocyte+Macro- phage/lymphocytes ratio ((G+M)/L ratio) using cell number in each gating (P7 or P8) was significantly decreased from 157% to 84% when DO level was 2.1 mg L
-1. Although there was no significant differ- ence in the number of granulocyte/macrophages be- tween experimental and control groups, lymphocyte counts in fish exposed to hypoxia were significantly higher than those in the control group (Fig. 2).
Gene expression level
Expression levels of cytokine genes (IL-1β, IL-2, IL-6 and IL-10) in normoxia, sub-hypoxia, and lethal hypoxia groups are shown in Fig. 3. Expression levels of IL-1β and IL-6 in head kidney were significantly
increased when dissolved oxygen level in rearing wa- ter was decreased.
Discussion
Defining hypoxic environment and normoxia con- dition is very complicated because they can be af- fected by DO level, exposure time under hypoxia, fish species, water salinity, temperature, and other various environmental factors (Richards et al., 2009). For these reasons, standards for normoxia remain con- troversial (Remen et al., 2013; Eliason et al., 2014).
As summarized in Table S1, various hypoxic con- ditions have been applied to rainbow trout studies.
Remen et al. (2013) have argued that 80% of air satu- ration is considered normoxia for Atlantic salmon (Salmo salar). Richards et al. (2009) have defined DO concentration of less than 2-3 mg O
2· L
-1and 5-6 mg O
2· L
-1as a hypoxic environment for freshwater and marine fish, respectively. Although many studies have used DO levels less than 2 mg O
2· L
-1as hy- poxic condition, Vaquer-Sunyer and Duarte (2008) Table 2. Serological and hematological changes in rainbow trout exposed to hypoxic stress
Groups (dissolved oxygen level (mg O
2L
-1))
Normoxia (8.6) Sub-hypoxia (4.6) Lethal hypoxia (2.1) RBC (10
8cells mL
-1)
Hematocrit (%) Hemoglobin (g dL
-1) MCV (μm
2)MHC (pg) MCHC (%) ESR (%) GOT (U L-1) GPT (U L -1) ALP (U L -1) BUN (mg dL
-1) GLU (mg dL
-1) TCHO (mg dL
-1) TP (g dL
-1) LDH (U L-1) Ca (mg dL
-1)
7.90 ± 0.94
a39.2 ± 4.4 5.28 ± 1.32 504 ± 83 68 ± 20 14 ± 4 96 ± 2 619 ± 102 29 ± 6
a243 ± 81 2.34 ± 0.45
a81 ± 13 265 ± 39 4.52 ± 0.41
2230 ± 883
a11.92 ± 1.07
10.5 ± 2.36
b42.4 ± 4.2 6.07 ± 2.25 429 ± 118 58 ± 14 15 ± 6 97 ± 3 698 ± 224 36 ± 10
ab269 ± 124 2.91 ± 0.61
b97 ± 15 311 ± 69 4.85 ± 0.44
2942 ± 1435
a12.28 ± 0.56
9.75 ± 2.12
b39.6 ± 6.7 6.55 ± 2.31 418 ± 73 71 ± 30 17 ± 7 96 ± 1 662 ± 167 38 ± 10
b230 ± 60 2.41 ± 0.32
a94 ± 43 260 ± 46 5.11 ± 1.04
5358 ± 2865
b12.88 ± 1.92
+