Socioeconomic Costs of Overweight and Obesity in Korean Adults
This study was conducted to estimate the socioeconomic costs of overweight and obesity in a sample of Korean adults aged 20 yr and older in 2005. The socioeconomic costs of overweight and obesity include direct costs (inpatient care, outpatient care and
medication) and indirect costs (loss of productivity due to premature deaths and inpatient care, time costs, traffic costs and nursing fees). Hypertension, diabetes mellitus,
dyslipidemia, ischemic heart disease, stroke, colon cancer and osteoarthritis were selected as obesity-related diseases. The population attributable fraction (PAF) of obesity was calculated from national representative data of Korea such as the National Health Insurance Corporation (NHIC) cohort data and the 2005 Korea National Health and Nutrition Examination Survey (KNHANES) data. Direct costs of overweight and obesity were estimated at approximately U$1,081 million equivalent (men: U$497 million, women: U$584 million) and indirect costs were estimated at approximately U$706 million (men: U$527 million, women: U$178 million). The estimated total socioeconomic costs of overweight and obesity were approximately U$1,787 million (men: U$1,081 million, women: U$706 million). These total costs represented about 0.22% of the gross domestic product (GDP) and 3.7% of the national health care expenditures in 2005. We found the socioeconomic costs of overweight and obesity in Korean adults aged 20 yr and older are substantial. In order to control the socioeconomic burden attributable to overweight and obesity, effective national strategies for prevention and management of obesity should be established and implemented.
Key Words: Obesity; Overweight; Socioeconomic costs; Direct costs; Indirect costs Jae Heon Kang1,2, Baek Geun Jeong3,
Young Gyu Cho1,2, Hye Ryoung Song4 and Kyung A Kim2
1Department of Family Medicine, Seoul Paik Hospital, College of Medicine, Inje University, Seoul;
2Institute for Clinical Nutrition, Inje University, Seoul; 3Department of Preventive Medicine, School of Medicine, Institute of Health Sciences, Gyeongsang National University, Jinju; 4Department of Family Medicine, College of Medicine, Eulji University, Daejeon, Korea
Received: 23 March 2011 Accepted: 13 October 2011 Address for Correspondence:
Baek Geun Jeong, MD
Department of Preventive Medicine, School of Medicine, Gyeongsang National University, 15, 816 road, Jinju-daero, Jinju 660-751, Korea
Tel: +82.55-772-8094 Fax: +82.55-772-8089 E-mail: [email protected]
http://dx.doi.org/10.3346/jkms.2011.26.12.1533 • J Korean Med Sci 2011; 26: 1533-1540
INTRODUCTION
Obesity is a state of an excess of body fat that causes increased risk of metabolic derangement (1, 2). World Health Organiza- tion (WHO) estimated that globally in 2005, approximately 1.6 billion adults were overweight and at least 400 million adults were obese. They also predicted that by 2015, approximately 2.3 billion adults would be overweight and more than 700 million would be obese. Obesity prevalence has been constantly increas- ing in Korea, too. According to the Korea National Health and Nutrition Examination Survey (KNHANES) data, obesity (body mass index [BMI] ≥ 25 kg/m2) prevalence in Korea increased from 26.3% (male, 25.0%; female, 27.0%) in 1998 to 31.7% (male, 35.1%; female, 28.0%) in 2005. In 1997, WHO anticipated that obesity, along with smoking, would be the most serious public health problem, which threatens the health of world popula- tion, in the 21st century (3). Must et al. (4) reported that the prev- alence of obesity-related comorbidities such as type 2 diabetes mellitus, high blood pressure, and osteoarthritis, was increased along with increasing severity of overweight and obesity in adults aged 25 yr and older, who participated in the Third National Health and Nutrition Examination Survey (NHANES). The dis- ease burden associated with obesity is not only a problem lim-
ited to Western developed countries anymore but has increased to a serious level also in Asia-Pacific countries including Korea.
The Asia-Pacific Cohort Studies Collaboration reported that the population attributable fraction (PAF) of overweight and obesi- ty ranged from 0.8%-9.2% for coronary heart disease mortality, 0.2%-2.9% for hemorrhagic stroke mortality, and 0.9%-10.2% for ischemic stroke mortality in 14 Asia-Pacific countries (5).
Increase in the prevalence of obesity and obesity-related dis- eases leads to the growth of socioeconomic burden. According to previous studies, patients with obesity had 25%-52% higher medical care costs than normal-weighted individuals (6-8). Med- ical care costs attributable to obesity was reported to account for 2.0%-7.0% of national health care expenditures in Western developed countries (9). The direct costs for obesity in the USA in 1995 were estimated to be approximately 70 billion US dol- lars, which exceeded estimates of the direct costs for coronary artery disease, hypertension and diabetes mellitus (10). Accord- ing to a study in Sweden, the obese women had 1.5-1.9 times higher sick-leave during 1 yr compared to the general Swedish women. And, approximately 10% of the total cost of loss of pro- ductivity due to sick-leave and disability pensions in Swedish women was related to obesity and obesity-related diseases (11).
Obesity also brings about premature death and disability, which
lead to loss of labor productivity (12, 13). Popkin et al. (14) esti- mated the indirect costs of obesity due to premature death, pre- mature disability and sick-leave in China in 2000 to be 43.6 bil- lion US dollars (3.58% of the gross national product [GNP]).
The socioeconomic costs of obesity in Korean adults were first estimated by Jeong et al. (15) using 1998 KNHANES data. They reported that the estimated costs attributable to obesity in Korea ranged from U$170 million equivalent to $350 million (exchange rate in 1998: 1,209 Korean Won for 1 US dollar), which were con- siderably smaller than those in Western developed countries.
However, because the prevalences of obesity and obesity-relat- ed diseases in Korea have been constantly increasing, the socio- economic costs of obesity in Korean adults are anticipated to have increased rapidly as well. Yet, there has been no study on this issue in Korea since 1998. Thus, this study was conducted to estimate the socioeconomic costs attributable to overweight and obesity in Korean adults in 2005, in which KNHANES was most recently carried out.
MATERIALS AND METHODS Selection of obesity-related diseases
We selected hypertension (ICD-10 code: I10), diabetes mellitus (E10-E14), dyslipidemia (E78), ischemic heart disease (I20-I25),
stroke (I60-I64), breast cancer (C50), colon cancer (C18-C21) and osteoarthritis (M15-M19) as obesity-related diseases be- cause previous studies (9) demonstrated that obesity has the etiological role on these diseases and these diseases were also investigated in 2005 KNHANES. However, breast cancer was excluded from obesity-related diseases because relative risk of obesity on breast cancer was not high.
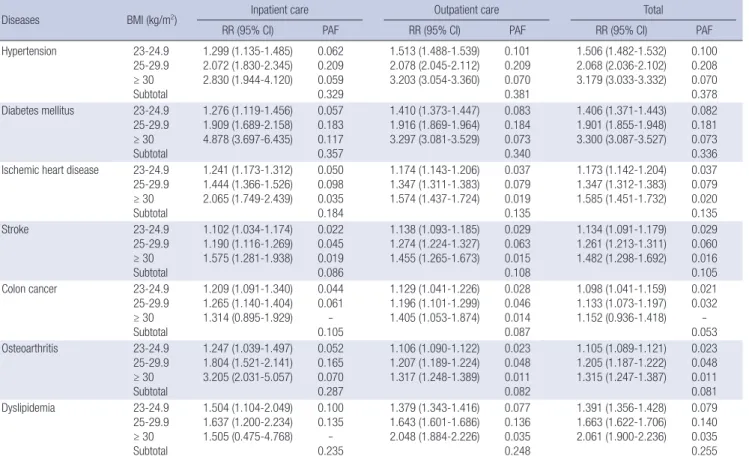
Calculation of population attributable fraction (PAF) We used the PAF of obesity in order to allocate the proportion attributable to obesity in the total costs of obesity-related dis- eases. The PAF of obesity is calculated using the formula; PAF = P × (RR-1)/[P × (RR-1) + 1], where P is the prevalence of over- weight and obesity and RR is the relative risk of overweight and obesity on obesity-related diseases. That is, the PAF of obesity is explained by the prevalence of obesity and the relative risk of obesity. The RRs and PAFs of obesity on obesity-related diseas- es in male and female were presented in Table 1 and 2.
Prevalence of obesity
The prevalence of obesity in Korean adults aged 20 yr and older was obtained from the raw data of 2005 KNHANES, to which was applied the weight value. We defined BMI of 18.5-22.9 kg/m2 as normal weight, 23-24.9 kg/m2 as overweight, 25-29.9 kg/m2 as
Table 1. RR and PAF on obesity-related diseases of obesity status (men)
Diseases BMI (kg/m2) Inpatient care Outpatient care Total
RR (95% CI) PAF RR (95% CI) PAF RR (95% CI) PAF
Hypertension 23-24.9
25-29.9
≥ 30 Subtotal
1.299 (1.135-1.485) 2.072 (1.830-2.345) 2.830 (1.944-4.120)
0.062 0.209 0.059 0.329
1.513 (1.488-1.539) 2.078 (2.045-2.112) 3.203 (3.054-3.360)
0.101 0.209 0.070 0.381
1.506 (1.482-1.532) 2.068 (2.036-2.102) 3.179 (3.033-3.332)
0.100 0.208 0.070 0.378 Diabetes mellitus 23-24.9
25-29.9
≥ 30 Subtotal
1.276 (1.119-1.456) 1.909 (1.689-2.158) 4.878 (3.697-6.435)
0.057 0.183 0.117 0.357
1.410 (1.373-1.447) 1.916 (1.869-1.964) 3.297 (3.081-3.529)
0.083 0.184 0.073 0.340
1.406 (1.371-1.443) 1.901 (1.855-1.948) 3.300 (3.087-3.527)
0.082 0.181 0.073 0.336 Ischemic heart disease 23-24.9
25-29.9
≥ 30 Subtotal
1.241 (1.173-1.312) 1.444 (1.366-1.526) 2.065 (1.749-2.439)
0.050 0.098 0.035 0.184
1.174 (1.143-1.206) 1.347 (1.311-1.383) 1.574 (1.437-1.724)
0.037 0.079 0.019 0.135
1.173 (1.142-1.204) 1.347 (1.312-1.383) 1.585 (1.451-1.732)
0.037 0.079 0.020 0.135
Stroke 23-24.9
25-29.9
≥ 30 Subtotal
1.102 (1.034-1.174) 1.190 (1.116-1.269) 1.575 (1.281-1.938)
0.022 0.045 0.019 0.086
1.138 (1.093-1.185) 1.274 (1.224-1.327) 1.455 (1.265-1.673)
0.029 0.063 0.015 0.108
1.134 (1.091-1.179) 1.261 (1.213-1.311) 1.482 (1.298-1.692)
0.029 0.060 0.016 0.105
Colon cancer 23-24.9
25-29.9
≥ 30 Subtotal
1.209 (1.091-1.340) 1.265 (1.140-1.404) 1.314 (0.895-1.929)
0.044 0.061 - 0.105
1.129 (1.041-1.226) 1.196 (1.101-1.299) 1.405 (1.053-1.874)
0.028 0.046 0.014 0.087
1.098 (1.041-1.159) 1.133 (1.073-1.197) 1.152 (0.936-1.418)
0.021 0.032 - 0.053
Osteoarthritis 23-24.9
25-29.9
≥ 30 Subtotal
1.247 (1.039-1.497) 1.804 (1.521-2.141) 3.205 (2.031-5.057)
0.052 0.165 0.070 0.287
1.106 (1.090-1.122) 1.207 (1.189-1.224) 1.317 (1.248-1.389)
0.023 0.048 0.011 0.082
1.105 (1.089-1.121) 1.205 (1.187-1.222) 1.315 (1.247-1.387)
0.023 0.048 0.011 0.081
Dyslipidemia 23-24.9
25-29.9
≥ 30 Subtotal
1.504 (1.104-2.049) 1.637 (1.200-2.234) 1.505 (0.475-4.768)
0.100 0.135 - 0.235
1.379 (1.343-1.416) 1.643 (1.601-1.686) 2.048 (1.884-2.226)
0.077 0.136 0.035 0.248
1.391 (1.356-1.428) 1.663 (1.622-1.706) 2.061 (1.900-2.236)
0.079 0.140 0.035 0.255 PAF, population attributable fraction; RR, relative risk; CI, confidence interval.
obesity I and over 30 kg/m2s as obesity II. These BMI cut-offs were recommended for Asians by WHO (16). In this study, 27.4%
of men and 22.0% of women were diagnosed as overweight, 31.5% of men and 24.6% of women as obese I, 3.6% of men and 3.4% of women as obese II.
PAFs of overweight, obesity I and obesity II were calculated separately and the sum of calculated PAFs was presented as the total PAF of obesity on obesity-related diseases.
Relative risk
The data source for calculation of the RR was the National Health Insurance Corporation (NHIC) cohort data. NHIC provides bi- ennial health examinations to the entire Korean population aged 40 yr and older. The NHIC cohort was composed of the partici- pants of health examinations of NHIC performed in 2000 who repeatedly participated in health examinations in 2002 or 2004.
Subjects, who did not have any previous history of obesity-relat- ed diseases and were judged as healthy men in 2000, were only enrolled in this study. Subjects who had problem in qualifica- tion as insured persons or who had some errors in computer- ized data, were excluded additionally. The payment data to them
by NHIC from 1999 to 2006 was obtained. The total number of the participants of health examinations of NHIC was 5,099,737.
Among them, 3,026,483 and 2,958,706 individuals were again undergone health examinations in 2002 and in 2004, respective- ly. Finally, 1,910,194 individuals were included in this study (men, 65.4%; women, 34.5%).
The RRs of overweight, obesity I and obesity II were estimated using the Cox proportional hazard model upon the first occur- rence of payment for outpatient care, inpatient care and either, respectively. Each RR was adjusted for age, smoking status, al- cohol consumption, frequency of meat intake, exercise, family medical history, household income, diabetes mellitus, hyper- tension, hypercholesterolemia, and so on. If any RRs of obesity on obesity-related diseases were interpreted as statistically in- significant, they were not included in calculation of PAF.
Estimation of costs
The socioeconomic costs of obesity can include direct costs, in- direct costs and intangible costs. Intangible costs such as pain, suffering and decreased quality of life, which are very important problems to patients, are omitted in most studies on cost of ill-
Table 2. RR and PAF on obesity-related diseases of obesity status (women)
Diseases BMI (kg/m2) Inpatient care Outpatient care Total
RR (95% CI) PAF RR (95% CI) PAF RR (95% CI) PAF
Hypertension 23-24.9
25-29.9
≥ 30 Subtotal
1.405 (1.164-1.695) 1.831 (1.534-2.185) 2.546 (1.740-3.723)
0.082 0.170 0.050 0.302
1.434 (1.400-1.468) 1.916 (1.873-1.959) 2.797 (2.665-2.935)
0.087 0.184 0.058 0.329
1.424 (1.391-1.457) 1.896 (1.854-1.938) 2.783 (2.654-2.918)
0.085 0.180 0.058 0.324 Diabetes mellitus 23-24.9
25-29.9
≥ 30 Subtotal
1.354 (1.068-1.716) 2.345 (1.906-2.886) 5.188 (3.705-7.264)
0.072 0.248 0.126 0.446
1.333 (1.283-1.386) 1.838 (1.773-1.906) 2.747 (2.554-2.955)
0.068 0.171 0.057 0.296
1.336 (1.286-1.388) 1.828 (1.764-1.894) 2.727 (2.537-2.930)
0.069 0.169 0.056 0.294 Ischemic heart disease 23-24.9
25-29.9
≥ 30 Subtotal
1.300 (1.172-1.441) 1.406 (1.270-1.556) 1.765 (1.409-2.210)
0.062 0.091 0.026 0.178
1.186 (1.139-1.235) 1.295 (1.244-1.348) 1.494 (1.357-1.645)
0.039 0.068 0.017 0.124
1.188 (1.142-1.236) 1.295 (1.245-1.347) 1.510 (1.375-1.657)
0.040 0.068 0.017 0.125
Stroke 23-24.9
25-29.9
≥ 30 Subtotal
1.127 (1.030-1.234) 1.136 (1.039-1.241) 1.438 (1.175-1.760)
0.027 0.032 0.015 0.074
1.122 (1.063-1.185) 1.198 (1.136-1.263) 1.246 (1.093-1.420)
0.026 0.046 0.008 0.081
1.125 (1.068-1.185) 1.199 (1.140-1.262) 1.244 (1.098-1.410)
0.027 0.047 0.008 0.082
Colon cancer 23-24.9
25-29.9
≥ 30 Subtotal
1.157 (1.968-1.384) 1.231 (1.033-1.468) 1.735* (0.412-1.310)
- 0.054
- 0.054
1.027 (0.897-1.175) 1.028 (0.898-1.177) 0.618 (0.391-0.977)
- - - -
1.089 (1.026-1.155) 1.018 (0.957-1.083) 0.912 (0.765-1.089)
0.019 - - 0.019
Breast cancer 23-24.9
25-29.9
≥ 30 Subtotal
0.982 (0.870-1.109) 0.908 (0.797-1.034) 0.697 (0.460-1.057)
- - - -
1.031 (0.936-1.136) 0.927 (0.834-1.029) 0.695 (0.496-0.973)
- - - -
1.023 (0.930-1.126) 0.914 (0.824-1.014) 0.694 (0.498-0.967)
- - - -
Osteoarthritis 23-24.9
25-29.9
≥ 30 Subtotal
1.308 (1.111-1.541) 2.375 (2.060-2.738) 5.710 (4.531-7.195)
0.064 0.253 0.139 0.455
1.196 (1.177-1.215) 1.441 (1.419-1.464) 1.870 (1.800-1.942)
0.041 0.098 0.029 0.168
1.195 (1.177-1.214) 1.439 (1.417-1.461) 1.863 (1.794-1.935)
0.041 0.097 0.029 0.167
Dyslipidemia 23-24.9
25-29.9
≥ 30 Subtotal
1.298 (0.745-2.260) 1.633 (0.968-2.755) 1.824 (0.552-6.022)
- - - -
1.221 (1.180-1.263) 1.425 (1.379-1.473) 1.551 (1.431-1.681)
0.046 0.095 0.019 0.160
1.231 (1.191-1.272) 1.432 (1.387-1.479) 1.621 (1.500-1.751)
0.048 0.096 0.021 0.165 PAF, population attributable fraction; RR, relative risk; CI, confidence interval.
ness because it is difficult to quantify these costs in monetary terms. These costs were not included in this study. Direct costs include hospitalization, outpatient visits and medication for the purpose of prevention and treatment of obesity and obesity-re- lated diseases. However, it is quite difficult to estimate precisely the costs for management of obesity itself, which is not covered by the national health insurance in Korea and is done in outside of the formal health care system. Costs for management of obe- sity-related diseases were only included as direct costs in this study. Loss of productivity due to premature deaths and admis- sion, time costs, traffic costs and nursing fees were measured as indirect costs in this study.
Direct costs
Direct costs were composed of costs for inpatient care, outpa- tient care and medication. They were calculated from the pay- ment data of NHIC, 2005 using formula 1. Costs, not insured by NHIC, were not included in these data. So, the proportion of not- insured, self-imposed costs in 2005, which was reported in an investigation (17), was reflected in this study. However, the pro- portions of not-insured, self-imposed costs on all obesity-relat- ed diseases were not reported in the investigation. Those were substituted with the average proportion of not-insured, self-im- posed costs on all the investigated diseases. The proportions of not-insured, self-imposed costs for medication were totally ap- plied by the average proportion of not-insured, self-imposed costs for the all investigated medication because those were not investigated separately for each disease.
Formula 1) Direct costs = (ΣHij × PAFij)/(1-αi) i = 1,2,….,nth disease j = 1 if male, 2 if female
Hij = Costs for inpatient care, outpatient care or medication to treat ‘i’ disease in ‘j’ sex
PAFij = population attributable fraction of obesity on ‘i’ disease in ‘j’ sex
α = the proportion of not-insured, self-imposed costs on the ‘i’ disease
Indirect costs: Loss of productivity due to premature deaths Costs by premature deaths due to obesity-related diseases were estimated by calculation of present value of lost future earning via formula 2. According to the data of the Korea National Sta- tistical Office, total 56,633 individuals died of all obesity-related diseases in adults aged 20 yr and older in 2005 (18). The number of death attributable to obesity was calculated through multipli- cation the number of deaths due to each obesity-related disease by total PAF for each disease. Future earnings were calculated within wages and future earnings after 2005 were assumed to be
the same as 2005. In addition, future earnings were discounted to the present values by the rate of 6%. The discount rate of 6%
has been used generally in healthcare project (19). The average monthly wage income of Korean adults aged 20 yr and older in 2005 was U$ 2,084 men and U$1,383 for women (exchange rate in 2005: 1,013 Korean Won for 1 US dollar). Labor force partici- pation rate and employment rate were 80.3% and 96.1% for men and 53.1% and 96.7% for women, respectively (20).
Formula 2) Loss of productivity due to premature deaths = (Ij ×ΣPAMij × Pj × Ej)/(1 + r)n
Ij = Average annual wage income of ‘j’ sex
PAMij = Number of death attributable to obesity via ‘i’ disease in ‘j’ sex
Pj = Labor force participation rate of ‘j’ sex Ej = Employment rate of ‘j’ sex
r = The discount rate n = Expected years of life lost
Indirect costs: Loss of productivity due to inpatient care Loss of productivity due to hospitalization was calculated with days of inpatient care due to each obesity-related disease and the average daily wage income via formula 3. Total number of days of inpatient care due to all obesity-related diseases in adults aged 20 yr and older was approximately 7.88 million days in 2005. The average daily wage income of Korean adults aged 20 yr and old- er in 2005 was U$ 83 equivalent for men and U$55 for women.
Formula 3) Loss of productivity due to inpatient care = Ijd ×ΣNij × Dij × PAFij × Pj × Ej
Ijd = Average daily wage income of ‘j’ sex
Nij = Total number of case of inpatient care with ‘i’ disease in ‘j’ sex
Dij = Average days per case of inpatient care with ‘i’ disease in ‘j’ sex
Indirect costs: Time costs
Time costs were calculated with time spent for hospital admis- sion and outpatient treatment and the average wage income per minute via formula 4. Time spent for hospital admission for each disease in each sex was investigated in 2005 KNHANES. Time spent for outpatient treatment included time spent for visiting physician, waiting time for outpatient treatment and treating time. In 2005 KNHANES, time spent for visiting physician was investigated, but the others were not investigated. So, waiting time for outpatient treatment was substituted with data investi- gated in 1998 KNHANES and treating time was assumed to be 3 min. The average wage income per minunte of Korean adults aged 20 yr and older in 2005 was U$ 0.17 for men and U$ 0.12
for women.
Formula 4) Time costs
= [(MINinij ×ΣNij) + (MINonij × ΣOij)] × Ijm × PAFij × Pj × Ej
MINinij = minutes spent per hospital admission with ‘i’ disease in ‘j’ sex
MINonij = minutes spent per outpatient treatment with ‘i’ dis ease in ‘j’ sex
Oij = Total number of case of outpatient care with ‘i’ disease in ‘j’ sex
Ijm = Average wage income per minute of ‘j’ sex
Indirect costs: Traffic costs
The traffic costs included two-way traffic costs of outpatients, inpatients and caregivers of inpatients and were calculated via formula 5. In 2005 KNHANES, two-way traffic costs of outpa- tients and inpatients were investigated, but the other was not investigated. So, those of caregivers of inpatients was substituted with adjusted values, investigated in 1995 Korea National Health Examination & Health Behavior Survey, by 1.7, the increase rate of traffic fee during 10 yr.
Formula 5) Traffic costs
= (TCon ×ΣOij) × PAFij + [(TCin + TCcg) × ΣNij] × PAFij
TCon = Average two-way transportation costs of outpatients TCin = Average two-way transportation costs of inpatients TCcg = Average two-way transportation costs of caregivers of inpatients
Indirect costs: Nursing fees
The nursing fees were investigated in 2005 KNHANES and were calculated via formula 6. It was investigated in 2005 KNHANES that nursing fees were paid only in colon cancer (U$ 340) in men, and stroke (U$ 877), colon cancer (U$ 237), and osteoarthritis (U$ 494) in women.
Formula 6) Nursing fees =ΣNij × NCij × PAFij
NCij = Average nursing costs per case of inpatient care with ‘i’
disease in ‘j’ sex RESULTS
Direct costs
Costs for inpatient care attributable to overweight and obesity in Korean adults aged 20 yr and older were estimated (Table 3) at about U$265 million equivalent (men, U$108 million; women, U$157 million). Inpatient care cost for ischemic heart disease occupied the largest proportion in these costs in men and inpa- tient care cost for osteoarthritis did in women. The estimated costs for outpatient care attributable to overweight and obesity were approximately U$300 million equivalent (men, U$133 mil- lion; women, U$167 million). Costs for medication attributable to overweight and obesity were estimated to be approximately U$516 million (men, U$256 million; women, U$260 million).
Hypertension made the largest contribution to costs for both out- patient care cost and medication attributable to overweight and obesity in both sexes. The total direct costs of overweight and obesity were estimated at about U$1,081 million (men, U$497 million; women, U$584 million). The direct costs of overweight and obesity due to hypertension were the highest in both sexes.
Costs for medication attributable to overweight and obesity were larger than costs for inpatients care or outpatient care.
Indirect costs
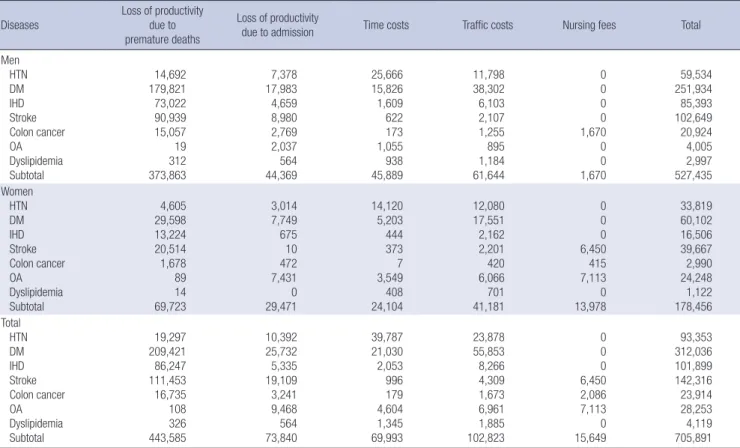
Loss of productivity due to premature deaths attributable to over- weight and obesity was estimated (Table 4) at approximately U$444 million (men, U$374 million; women, U$70 million). Di- abetes mellitus were the most important pathway of costs due to obestiy-attributed premature deaths in both sexes. The esti- mated amount of loss of productivity due to hospitalization at- tributable to overweight and obesity obesity-related diseases was approximately U$74 million (men, U$44 million; women, U$29 million). Hospitalization due to diabetes mellitus was the Table 3. Direct costs of obesity (unit: U$1,000 equivalent)
Diseases Inpatient care Outpatient care Pharmaceuticals Total
Men Women Total Men Women Total Men Women Total Men Women Total
HTN 3,459 5,423 8,882 68,346 82,389 150,734 143,507 153,026 296,533 215,312 240,837 456,149
DM 21,424 26,040 47,465 44,559 37,034 81,592 81,701 71,523 153,224 147,684 134,596 282,281
OA 6,977 77,764 84,742 5,585 38,142 43,728 1,844 15,810 17,654 14,407 131,717 146,123
IHD 42,139 24,156 66,295 4,751 3,716 8,466 12,924 8,464 21,388 59,813 36,336 96,149
Stroke 21,673 19,694 41,367 4,163 2,944 7,107 9,149 6,123 15,272 34,985 28,761 63,746 Colon cancer 12,095 4,175 16,269 2,705 0 2,705 1,010 0 1,010 15,809 4,175 19,984 Dyslipidemia 75 0 75 3,086 2,535 5,621 5,758 5,037 10,795 8,919 7,572 16,491 Total 107,842 157,252 265,094 133,194 166,758 299,953 255,892 259,984 515,877 496,930 583,994 1,080,923 HTN, hypertension; DM, diabetes mellitus; IHD, ischemic heart disease; OA, osteoarthritis.
most important cause of these costs in men and hospitalization due to stroke was in women. Time costs attributable to obesity was estimated to be about U$70 million (men, U$46 million;
women, U$24 million) and transportaion costs attributable to overweight and obesity were estimated to be approximately U$103 million (men, U$62 million; women, U$41 million). Hy- pertension made the largest contribution to time costs of over- weight and obestiy and diabetes mellitus most largely contrib- uted to transportation costs of overweight and obesity. Nursing fees attributable to overweight and obesity were estimated at about U$16 million (men, U$2 million; women, U$14 million).
The total indirect costs of overweight and obesity were estimat-
ed to be approximately U$706 million (men, U$527 million;
women, U$178 million). The indirect costs of overweight and obesity due to diabetes mellitus were the highest in both sexes.
The indirect costs of overweight and obesity were larger in men than in women.
Total socioeconomic costs
The estimated total socioeconomic costs of overweight and obe- sity in Korean adults aged 20 yr and older were approximately U$1,787 million equivalent (men, U$1,081 million; women, U$706 million). Costs for diabetes mellitus occupied the largest propor- tion in the total costs attributable to overweight and obesity in Table 4. Indirect costs of obesity (unit: U$1,000 equivalent)
Diseases Loss of productivity due to premature deaths
Loss of productivity
due to admission Time costs Traffic costs Nursing fees Total
Men HTN DM IHD Stroke Colon cancer OA Dyslipidemia Subtotal
14,692 179,821 73,022 90,939 15,057 19 312 373,863
7,378 17,983 4,659 8,980 2,769 2,037 564 44,369
25,666 15,826 1,609 622 173 1,055 938 45,889
11,798 38,302 6,103 2,107 1,255 895 1,184 61,644
0 0 0 0 1,670 0 0 1,670
59,534 251,934 85,393 102,649 20,924 4,005 2,997 527,435 Women
HTN DM IHD Stroke Colon cancer OA Dyslipidemia Subtotal
4,605 29,598 13,224 20,514 1,678 89 14 69,723
3,014 7,749 675 10 472 7,431 0 29,471
14,120
5,203 444 373 7 3,549 408 24,104
12,080 17,551 2,162 2,201 420 6,066 701 41,181
0 0 0 6,450 415 7,113 0 13,978
33,819 60,102 16,506 39,667 2,990 24,248 1,122 178,456 Total
HTN DM IHD Stroke Colon cancer OA Dyslipidemia Subtotal
19,297 209,421 86,247 111,453 16,735 108 326 443,585
10,392 25,732 5,335 19,109 3,241 9,468 564 73,840
39,787 21,030 2,053 996 179 4,604 1,345 69,993
23,878 55,853 8,266 4,309 1,673 6,961 1,885 102,823
0 0 0 6,450 2,086 7,113 0 15,649
93,353 312,036 101,899 142,316 23,914 28,253 4,119 705,891 HTN, hypertension; DM, diabetes mellitus; IHD, ischemic heart disease; OA, osteoarthritis.
Table 5. Total socioeconomic costs of obesity (unit: U$1,000 equivalent)
Diseases Direct cost Indirect cost Total
Men Women Total Men Women Total Men Women Total
DM 147,684 134,596 282,281 251,934 60,102 312,036 399,618 194,698 594,317
HTN 215,312 240,837 456,149 59,534 33,819 93,353 274,846 274,656 549,502
Stroke 34,985 28,761 63,746 102,649 39,667 142,316 137,634 68,428 206,062
IHD 59,813 36,336 96,149 85,393 16,506 101,899 145,206 52,842 198,047
OA 14,407 131,717 146,123 4,005 24,248 28,253 18,413 155,964 174,377
Colon cancer 15,809 4,175 19,984 20,924 2,990 23,914 36,733 7,166 43,899
Dyslipidemia 8,919 7,572 16,491 2,997 1,122 4,119 11,915 8,694 20,610
Subtotal 496,930 583,994 1,080,923 527,435 178,456 705,891 1,024,364 762,449 1,786,814
HTN, hypertension; DM, diabetes mellitus; IHD, ischemic heart disease; OA, osteoarthritis.
men and costs for hypertension did in women (Table 5). The es- timated total socioeconomic costs of obesity in Korean adults aged 20 yr and older were approximately U$1,306 million and those of overweight were approximately U$481 million (Table 6).
DISCUSSION
This study estimated the socioeconomic costs of overweight and obesity in Korean adults aged 20 yr and older in 2005. The esti- mated total costs were approximately U$1.8 billion equivalent (direct costs: U$1.1 billion, indirect costs: U$0.7 billion). These total costs represented about 0.22% of the gross domestic product (GDP) and 3.7% of the national health care expenditures in 2005.
Diabetes mellitus and hypertension were the two main contrib- utors to the socioeconomic costs of overweight and obesity.
A previous study (15) on the same issue presented that the socioeconomic cost of overweight and obesity (BMI ≥ 23 kg/m2) in Korean adults in 1998 were approximately U$350 million equivalent (0.094% of GDP, 1.88% of the total national health care expenditures). The socioeconomic costs of overweight and obesity has increased 4-5 times during these 7 yr. Even if the growth of GDP and the national health care expenditures in Korea was considered, increase of these costs was more than 2 times. It is thought that the rapid increase in the prevalence of obesity in Korea has led to the increase of the socioeconomic costs attributable to obesity.
According to a previous study (9), obesity accounts for 5.5%- 7.0% of national health care expenditures in the USA and 2.0%- 3.5% in other Western developed countries. The estimated med- ical-care costs attributable to obesity were approximately 2.3%
of the national health-care expenditures, which were similar to those in other Western developed countries than the USA. These results imply that the economic burden attributable to obesity in Korea is getting bigger like Western countries.
The socioeconomic costs of obesity can be classified into tan- gible costs and intangible costs. Intangible costs are very impor- tant problems to patients such as pain, suffering, and anxiety and are usually measured in terms of quality of life. Although there are several studies (21-23) that estimated intangible costs of diseases, these costs are omitted in most studies on cost of illness because it is difficult to quantify these costs in monetary terms. For estimation of intangible costs, organized and metic-
Table 6. Total socioeconomic costs of obesity by obesity grade (unit: U$1,000 equivalent)
Obesity grade Direct cost Indirect cost Total
Men Women Total Men Women Total Men Women Total
Overweight 129,081 141,443 270,514 139,168 70,839 210,007 268,249 212,282 480,521
Obesity I 272,327 327,874 600,208 293,380 83,142 376,522 565,707 411,016 976,730
Obesity II 95,522 114,677 210,201 94,887 24,475 119,362 190,410 139,151 329,563
Subtotal 496,930 583,994 1,080,923 527,435 178,456 705,891 1,024,365 762,450 1,786,814
Overweight, 23-24.9 kg/m2; Obesity I, 25-29.9 kg/m2; Obesity II, ≥ 30 kg/m2.
ulous investigation on the quality of life of study subjects should be planned. However, because this study was made of second- ary data, intangible costs could not be included in this study.
The medical care costs attributable to obesity can be classi- fied into costs for management of obesity-related diseases and costs for management of obesity itself. And, these costs can be divided into costs expended within the formal health care sys- tem and costs expended in outside of the formal health care system, respectively. Costs for management of obesity itself is rapidly increasing in Korea. The amount of sales of anti-obesity drugs has increased from U$60 million equivalent in 2005 to U$81 million in 2007 (exchange rate in 2007, 938 Korean Won for 1 US dollar) in Korea (22). However, management of obesity is not covered by the national health insurance in Korea and a lot of Koreans utilize services for weight loss in outside of the formal health care system. Therefore, data on the costs for man- agement of obesity itself could not be obtained. Besides the dis- eases defined as obesity-related diseases in this study, various diseases including gallbladder disease and endometrial cancer can be considered as obesity-related diseases. However, only dis- eases investigated in 2005 KNHANES were selected as obesity- related diseases in this study. These limitations of study meth- ods made the socioeconomic cost of overweight and obesity underestimated in this study. Therefore, it is thought that the real costs of obesity may be superior to U$1.8 billion equivalent, the estimated cost of obesty of this study. That PAF of obesity was calculated from national representative data such as NHIC cohort data and 2005 KNHANES data, is one of strengths of this study. The PAF of obesity calculated in this study can be utilized in researches on the relationship between obesity and obesity- related diseases in Asian including Korean.
We found the socioeconomic costs of overweight and obesity in Korean adults aged 20 yr and older were substantial. Also, this study showed the socioeconomic burden of obesity (U$1,306 million equivalent) was much bigger than that of overweight (U$481 million). This study might be a good evidence for bene- fits of prevention and management of obesity. In order to con- trol the socioeconomic burden attributable to overweight and obesity, effective national strategies for prevention and manage- ment of obesity should be established and implemented. The results of this study are expected to make a contribution to plan and execution of obesity-related public health policy.
REFERENCES
1. Park KA, Jeon EY. Effects of the integrative weight control program includ- ing east Asian traditional medicine on the degree of obesity and body composition. Korean J Rehabil Nurs 2010; 13: 62-9.
2. Korea Society for the Study of Obesity. Guidelines of obesity. Seoul: Ko- rean Medicine press, 2008.
3. WHO. Obesity-preventing and managing the global epidemic. Geneva:
World Health Organization, 1997.
4. Must A, Spadano J, Coakley EH, Field AE, Colditz G, Dietz WH. The dis- ease burden associated with overweight and obesity. JAMA 1999; 282:
1523-9.
5. Asia Pacific Cohort Studies Collaboration. The burden of overweight and obesity in the Asia-Pacific region. Obes Rev 2007; 8: 191-6.
6. Burton WN, Chen CY, Schultz AB, Edington DW. The economic costs as- sociated with body mass index in a workplace. J Occup Environ Med 1998;
40: 786-92.
7. Quesenberry CP Jr, Caan B, Jacobson A. Obesity, health services use, and health care costs among members of a health maintenance organization.
Arch Intern Med 1998; 158: 466-72.
8. Thompson D, Brown JB, Nichols GA, Elmer PJ, Oster G. Body mass in- dex and future health-care costs: a retrospective cohort study. Obes Res 2001; 9: 210-8.
9. Thompson D, Wolf AM. The medical-care cost burden of obesity. Obes Rev 2001; 2: 189-97.
10. Coldtiz GA. Economic costs of obesity and inactivity. Med Sci Sports Exerc 1999; 31: S663-7.
11. Narbro K, Jonsson E, Larsson B, Waaler H, Wedel H, Sjöström L. Eco- nomic consequences of sick-leave and early retirement in obese Swedish women. Int J Obes Relat Metab Disord 1996; 20: 895-903.
12. Fontaine KR, Redden DT, Wang C, Westfall AO, Allison DB. Years of life lost due to obesity. JAMA 2003; 289: 187-93.
13. Peeters A, Barendregt JJ, Willekens F, Mackenbach JP, Al Mamun A, Bon-
AUTHOR SUMMARY
Socioeconomic Costs of Overweight and Obesity in Korean Adults
Jae Heon Kang, Baek Geun Jeong, Young Gyu Cho, Hye Ryoung Song and Kyung A Kim
We estimated the socioeconomic costs of overweight and obesity in Korean adults in 2005. Hypertension, diabetes mellitus, dyslipidemia, ischemic heart disease, stroke, colon cancer and osteoarthrits were selected as obesity-related diseases.The estimated total socioeconomic costs of overweight and obesity were approximately $1,787 million. These total costs represented about 0.22% of the gross domestic product and 3.7% of the national health care expenditures in 2005.
neux L; NEDCOM, the Netherlands Epidemiology and Demography Compression of Morbidity Research Group. Obesity in adulthood and its consequences for life expentancy: a life-table analysis. Ann Intern Med 2003; 138: 24-32.
14. Popkin BM, Kim S, Rusev ER, Du S, Zizza C. Measuring the full economic costs of diet, physical activity and obesity-related chronic diseases. Obes Rev 2006; 7: 271-93.
15. Jeong BG, Moon OR, Kim NS, Kang JH, Yoon TH, Lee SY, Lee SJ. Socio- economic costs of obesity for Korean adults. Korean J Prev Med 2002; 35:
1-12.
16. WHO Western Pacific Region. The Asia-Pacific perspective: redefining obesity and its treatment. Sydney: IOTF, 2000.
17. Kim JH, Jeong JC, Lee HY, Choi SJ, Lee JK. Survey on the benefit coverage rate of national health insurance in 2005. Seoul: National Health Insur- ance Corporation, 2006.
18. Korean Statistical Information Service. Statistical database: health, soci- ety, welfare. 2005. Available at http://kosis.kr/[accessed on 19 February 2011].
19. Drummond MF. Principles of economic appraisal in health care. Oxford:
Oxford University Press, 1980, p10-2.
20. Korean Statistical Information Service. Statistical database: employment, labor, wages, 2005. Available at http://kosis.kr. [accessed on 19 February 2011].
21. Casado V, Romero L, Gubieras L, Alonso L, Moral E, Martinez-Yelamos S, Martinez-Yelamos A, Carmona O, Arbizu T. An approach to estimat- ing the intangible costs of multiple sclerosis according to disability in Cat- alonia, Spain. Mult Scler 2007; 13: 800-4.
22. Leardini G, Salaffi F, Montanelli R, Gerzeli S, Canesi B. A multicenter cost- of-illness study on rheumatoid arthritis in Italy. Clin Exp Rheumatol 2002;
20: 505-15.
23. Xie F, Thumboo J, Fong KY, Lo NN, Yeo SJ, Yang KY, Li SC. A study on in- direct and intangible costs for patients with knee osteoarthritis in Singa- pore. Value Health 2008; 11: S84-90.