INTRODUCTION
Electroconvulsive therapy (ECT) results in electrically in- duced repetitive firing of neurons in the central nervous sys- tem; it is a technique that has been used to treat severe psy- chiatric illness. Major depression, especially in the elderly, is currently the most common indication for ECT. However, it is also used in other serious psychiatric disorders such as sc- hizophrenia and bipolar I disorder. It has been shown to be effective in between 85% and 90% of cases of major depres- sion; by comparison, antidepressant medications have been shown to be effective in 60-65% of cases (1). Understanding the mechanism by which ECT improves the symptom of major depression might provide a clue to better understand- ing involved in the etiology of depression. Despite the early recognition of the essential role of generalized seizure activi- ty in producing the therapeutic effects, the exact mechanisms of action of ECT have remained to be elucidated.
The human genome project has provided a wealth of infor- mation on the sequences of individual genes. However, the decoding of the nucleic acid sequence alone is not sufficient to understand the complex biological processes and the mech- anisms underlying diseases; the analysis of mRNA and pro-
tein function is necessary to advance understanding (2, 3).
Therefore, the focus of research is now moving to the immense task of identifying the structure, function and the interactions of the proteins produced by individual genes. Proteins are key molecules to understand cellular functions, disease processes, and chemotherapeutic treatments; this area of research of the analysis of cellular proteins has been termed proteomics (4).
Recent improvements for proteome analysis have offered the possibility of identifying disease-associated protein markers to assist in diagnosis or prognosis, and for selecting potential targets for specific drug therapy.
In this study, we prepared proteins from ECT-treated and normal rat brain tissues, and then analyzed and identified a number of ECT-associated proteins by two-dimensional gel electrophoresis and matrix-assisted laser desorption/ioniza- tion time-of flight (MALDI-TOF)/mass spectrometry.
MATERIALS AND METHODS Materials and animals
IPG gel strips (pH 4-7, 18 cm), ampholyte, SDS, acryla-
132
Cheol Soon Lee1, Kee Ryeon Kang*,�,1, Ji-Young Lee*,�, Chul Soo Park, Kyu Hee Hahn, Jin Wook Sohn, and Bong Jo Kim
Departments of Psychiatry and Biochemistry*, MRC for Neural Dysfunction�, College of Medicine and Institute of Health Sciences, Gyeongsang National University, Jinju, Korea
1Both authors are equally contributed to this paper.
Address for correspondence Bong Jo Kim, M.D.
Department of Psychiatry, College of Medicine, Gyeongsang National University, 90 Chilam-dong, Jinju 660-701, Korea
Tel : +82.55-750-8084, Fax : +82.55-759-0003 E-mail : [email protected]
*This work was supported by MRC grant of KOSEF/
MOST (R13-2005-012-01003-0) and a grant from the Korea Research Foundation (KRF-2006-005-J04203).
Proteomic Analysis of Rat Brains Following Exposure to Electroconvulsive Therapy
Electroconvulsive therapy (ECT) is one of the most effective treatments used in psychiatry to date. The mechanisms of ECT action, however, are the least under- stood and still unclear. As a tool to elucidate the mechanisms of action of ECT, we employed proteomic analysis based on the identification of differentially expressed proteins after exposure to repeated ECT in rat brains. The expression of proteins was visualized by silver stain after two-dimensional gel electrophoresis. Of 24 dif- ferentially expressed protein spots (p<0.05 by Student t-test), six different proteins from 7 spots were identified by matrix-assisted laser desorption/ionization time-of flight (MALDI-TOF)/mass spectrometry. Among the identified proteins, there were five dominantly expressed proteins in the ECT-treated rat brain tissues (p<0.05);
S100 protein beta chain, 14-3-3 protein zeta/delta, similar to ubiquitin-like 1 (sentrin) activating enzyme subunit 1, suppressor of G2 allele of SKP1 homolog, and phos- phatidylinositol transfer protein alpha. The expression of only one protein, ACY1 protein, was repressed (p<0.05). These findings likely serve for a better understand- ing of mechanisms involved in the therapeutic effects of ECT.
Key Words : Proteomics; Electroconvulsive Therapy
Received : 12 July 2007 Accepted : 3 June 2008
mide, N,N′-methylene-bis-acrylamide, TEMED, ammoni- um persulfate, dithiothreitol (DTT), urea, Tris, glycine, glyc- erol, and CHAPS were purchased from Bio-Rad (Hercules, CA, U.S.A.). Silver nitrate, Coomassie Brilliant Blue G-250, TCA, iodoacetamide, and CHCA (α-cyano-4-hydroxycinnam- ic acid) were from Sigma-Aldrich (St. Louis, MO, U.S.A.).
Methyl alcohol, ethyl alcohol, phosphoric acid, acetic acid, and formaldehyde were purchased from Merck (Darmstadt, Ger- many). Sequencing grade modified trypsin was obtained from Promega (Madison, WI, U.S.A.). Other reagents were obtained from Sigma-Aldrich or Merck.
Four to six months male rats (Sprague Dawley, 200-350 g;
ACE Animals, Boyertown, PA, U.S.A.) were used in this study.
Rats were housed in groups of five with free access to food and water, and the animal room was maintained at approximate- ly 23℃with a 12 hr light/dark cycle. The ECT (or electrocon- vulsive shock) was applied via bilateral ear clip electrodes. The shock, a square wave pulse (pulse width, 0.7 msec; 50 Hz) of 50 mA, was administered for 1 sec to provide a tonic seizure phase. ECT-treated animals (N=8) were given one ECT per day for 14 consecutive days. The control rats (N=8) were han- dled in the same condition with no current. All animal exper- iments were approved by the Institutional Review Board and carried out in accordance with the principles of laboratory ani- mal care. The rat brains were weighed, frozen on dry ice and stored at -70℃.
Sample preparation for two-dimensional gel electrophoresis (2-DE)
The frozen rat brain tissues (-2.5 g) were washed three times with phosphate-buffered saline (pH 7.2), and homogenized in 5 mL homogenization buffer (50 mM Tris-HCl [pH 7.2] and 150 mM NaCl) containing 1× protease inhibitor cock- tail (Promega) using an Ultra-Turrax T8 Homogenizer (IKA, Staufen, Germany).
TCA-precipitated proteins were washed once in diethyl ether and dried under air stream. The dried pellets were dis- solved with sonication in the lysis buffer (40 mM Tris, 8 M urea, 4% CHAPS, 100 mM DTT, and 2% ampholyte), and were centrifuged at 15,000 rpm (100,000×g) for 15 min at 4℃. The resulting supernatant was kept at -70℃until use. Protein concentration was determined by the Bradford method using bovine serum albumin as a standard (5).
2-DE
The IPG gel strips were rehydrated in a swelling solution (8 M urea, 2% CHAPS, 100 mM DTT, 0.5% pH 4-7 IPG buffer, and bromophenol blue) containing 50 μg (for silver staining) or 500 μg (for Coomassie blue staining) proteins for 12 hr at 20℃, and applied to strips by overnight rehydration at 50 V (6). Proteins were focused for 10,000 V within 3 hr, and maintained at 10,000 V for 7 hr at 20℃using Protean
IEF Cell (Bio-Rad, Hercules, CA, U.S.A.). After the IEF pro- cedure, the strips were equilibrated as described (7). Separa- tion in the second dimension by SDS-PAGE at 16℃at 5 mA/cm (constant current) for the initial 1 hr and 10 mA/cm thereafter. Protein visualization by silver or Coomassie blue staining was performed as described (7).
Image analysis and protein identification
Protein patterns in the gel were recorded as digitalized im- ages using a high-resolution scanner (GS-710 Calibrated Imag- ing Densitometer, Bio-Rad). The scanned gel image was ana- lyzed using a standard protocol for PDQuest software (Bio- Rad). For all spot intensity calculations, normalized values were used and expressed in ppm. In-gel digestion of protein spots with trypsin was performed as described (7). The tryp- tic peptides were redissolved in a solution containing water, acetonitrile, and trifluoroacetic acid (93:5:2), and the solution was treated for 5 min in a bath sonicator. Target preparation was carried out by solution phase nitrocellulose method. Sat- urated solution of CHCA (40 mg/mL) and nitrocellulose (NC) solution (20 mg/mL) was prepared separately in acetone. A mixture of CHCA- and NC solution, and 2-propanol was pre- pared at a ratio of 2:1:1. Peptide calibrants (50-200 fM of each), des-Arg-bradykinin (monoisotopic mass, 904.4681), and neurotensin (1672.9715), were added and the mixture solution was then spotted on the target and dried. The dried samples were washed with 5 μL of 5% formic acid for 10 sec, followed by 5 μL of Milli-Q water for 10 sec, and then the dried spots were analyzed in a Voyager-DETMSTR MALDI- TOF mass spectrometer (PerSeptive Biosystems, Framing- ham, MA, U.S.A.). The spectrometer was run in positive ion mode and in reflector mode with the following settings:
accelerating voltage, 20 kV; grid voltage, 76%; guide wire voltage, 0.01%; and a delay of 150 ns. The low mass gate was set at 500 m/z. Proteins were identified by peptide mass fingerprinting with the search programs MS-FIT (http://pro- spector.ucsf.edu/ucsfhtml3.4/msfit.htm).
RESULTS
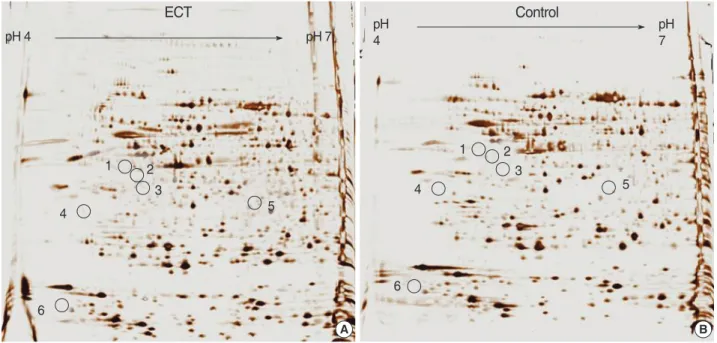
We analyzed the proteomic profiles of the ECT-treated rat brain tissues and the normal control brain tissues with each 8 pairs. Spots representing proteins that were differentially expressed in the ECT-treated rat brains were selected (p<0.05 by Student’s t-test). A total of 918 spots from the control group and 962 spots from the ECT-treated group were visualized in a gel (pH range from 4-7 and molecular mass range from 10-100 kDa) (Fig. 1). The overall protein expression patterns in the ECT-treated and the normal brain tissues were quite similar except for some areas. The protein identities from all the spots were entered in the composite gel database so that any changes in the protein expression could be determined for
each protein spot. The integrated protein intensity was deter- mined for each identified spot in eight gels each from the ECT-treated and normal brains. The mean intensity of each spot was calculated by its silver stain intensity and the rela- tive intensities between the ECT-treated and normal brains.
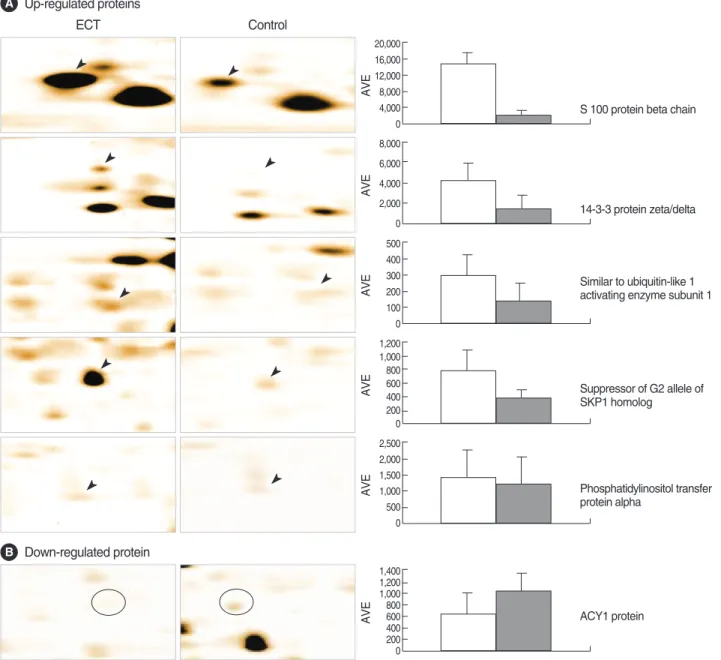
Five proteins were dominantly expressed in the ECT-treated rat brain tissues and one protein was revealed largely repressed, and these proteins were found with a statistical significance.
Some of these proteins have been identified by mass spectrom- etry. A typical mass spectrum of a protein, 14-3-3 protein zeta/
delta, was shown in Fig. 2. Total 6 proteins from 7 spots were identified. The expression level of each protein in both ECT- treated and normal tissue was indicated by the density val-
ues (Fig. 3). Their predicted values of isoelectrical point (pI) and molecular weight (M.W.) were summarized in Table 1, and the values were compatible to those of acquired from the gels. The sequence coverage of proteins isolated from the pep- tide mass matching in a program was acceptable (20-40%
ranges). Five proteins were dominantly expressed in the ECT- treated rat brain tissues with a statistical significance; S100 protein beta chain (S100B), 14-3-3 protein zeta/delta, simi- lar to ubiquitin-like 1 (sentrin) activating enzyme subunit 1, suppressor of G2 allele of SKP1 homolog and phosphatidyli- nositol transfer protein alpha (PI-TPα) (Fig. 1, 3A). One protein, ACY1 protein, was revealed largely repressed (Fig.
1, 3B).
DISCUSSION
Proteomics provides a powerful tool for the identification of proteins differentially expressed after exposure to ECT. In this study, 24 protein spots whose expression was changed after ECT were shown to have either increased or decreased expression in the ECT-treated rat brain tissues. Three ranges of IPG gel strips (pI 3-10, 4-7, and 6-9) were used for IEF with similar results in the slightly different resolution, but pI 4-7 strip was selected for the optimum condition (data not shown). Among them, six proteins were identified as S100B, 14-3-3 protein zeta/delta, PI-TPα, similar to ubiquitin-like 1 (sentrin) activating enzyme subunit 1, suppressor of G2 allele of SKP1 homolog and ACY1 protein by MALDI-TOF/mass spectrometry.
Expression of S100B was increased after ECT-treated brain
Fig. 1. Two-dimensional gel electrophoresis patterns of proteins from the ECT-treated rat brain tissue (A) and normal control brain tissue (B).
Proteins were identified using MALDI-TOF/mass spectrometry and peptide mass fingerprinting. Identified spots were indicated by numbers.
A B
pH pH 4 4
ECT Control
pH 7
1
1 2
2
3
3
4
4 5
5
6
6
pH 7
Fig. 2. Peptide mass fingerprinting of 14-3-3 protein zeta/delta. The spot P35213 was in-gel digested with trypsin. After desalting, the peptide mixture was analyzed by MALDI-TOF/mass spectrometry.
The abscissa represents the mass/charge ratio of ions detected in the MALDI-TOF experiments. The ordinate denotes the relative intensity of the averaged ion current in arbitrary units. The peaks for trypsin and keratin were excluded.
Intensity
25
0
600 2,998
1,000 m/z 2,500
889.51
977.57 1,021.6 1,150.5 1,189.71,205.7 1,278.7 1,526.81,548.7 1,739.9 1,995.0 2,078.0 2,131.9
Fig. 3. 2-DE patterns showing up-regulated protein spots (A, indicated by arrowheads) and down-regulated spot (B, indicated by circle) in ECT-treated rat brain tissues (left panel) compared with control brain tissues (middle panel). The histogram in the right panel shows the relative intensities of protein spots expressed in ECT-treated (open bar) and control tissues (shaded bar). AVE, average.
AVE
20,000 16,000 12,000 8,000 4,000 0
S 100 protein beta chain
AVE
8,000 6,000 4,000 2,000 0
14-3-3 protein zeta/delta
AVE
500 400 300 200 100 0
Similar to ubiquitin-like 1 activating enzyme subunit 1
AVE
1,200 1,000 800 600 400 200 0
Suppressor of G2 allele of SKP1 homolog
AVE
2,500 2,000 1,500 1,000 500 0
Phosphatidylinositol transfer protein alpha
AVE
1,400 1,200 1,000 800 600 400 200 0
ACY1 protein
ECT Control
Up-regulated proteins
Down-regulated protein
*The ratio of normalized spot intensities of control and ECT-treated rat brain tissues. The ratio was calculated for each paired samples in rat brains. The arrows indicate the intensities of up-regulated protein spots in ECT-treated brains (↑) and that of down-regulated spot in ECT-treated brains (↓).
ECT, electroconvulsive therapy.
Accession number Protein identified pI/MW (kDa) Abundance level* Sequence
(mean±SD) coverage
P04631 S100 protein beta chain 4.5/10.7 ↑2.8±2.1 40%
P35213 14-3-3 protein zeta/delta 4.7/27.7 ↑2.6±1.9 20%
34855215 Similar to ubiquitin-like 1 (sentrin) activating enzyme subunit 1 5.0/39.5 ↑4.7±3.9 37%
Q9CX34 Suppressor of G2 allele of SKP1 homolog 5.3/38.1 ↑3.0±2.6 37%
P16446 Phosphatidylinositol transfer protein alpha isoform 6.0/31.7 ↑2.2±0.7 35%
P00787 ACY1 protein 6.0/45.8 ↓1.8±2.3 40%
Table 1. Differentially expressed proteins in normal and ECT-treated rat brains A
B
compared with control rat brain. S100B is a calcium-binding protein, produced and secreted by astrocytes and it modulated the proliferation and differentiation of neurons and glia (8).
Increased levels of this protein are associated with brain dam- age and its persistent elevation appears to be involved in neu- rodegenerative disorders including schizophrenia (9). Cere- brospinal fluid levels of S100B of rats submitted to repeat- ed-ECT were significantly increased (10). Whether S100B levels are elevated due to injured astrocytes and a disrupted blood brain barrier or by active secretion of S100B by astro- cytes, it is remained to be clarified by further studies.
The 14-3-3 proteins belong to a family consisting of high- ly conserved acidic proteins with molecular weights of 25-30 kDa. The 14-3-3 proteins participate in phosphorylation-de- pendent protein-protein interactions that control progression through the cell cycle, initiation and maintenance of DNA damage checkpoints, activation of MAP kinases, prevention of apoptosis and coordination of integrin signaling and cyto- skeletal dynamics (11, 12). Alterations of the expression of 14-3-3 proteins have been associated with several human dis- eases such as cancer, heart disease and a variety of neurodegen- erative disorders including Cruezfeldt-Jacob disease and Al- zheimer’s disease. The 14-3-3 proteins have been implicated by several recent studies in the potential genetic bases of sc- hizophrenia (13, 14). In schizophrenia, mRNA levels of one of the 14-3-3 membrane (eta) proteins have been reported to be significantly decreased in post-mortem cerebellum sam- ples obtained form medicated subjects with schizophrenia (15).
Recently, Middleton et al. reported that the 14-3-3 beta tran- script may be unique among the 14-3-3 genes due to its asso- ciated increase in response to haloperidol and decrease in the disease state (16). Expression of the 14-3-3 protein zeta/delta in the ECT-treated rat brain was increased in this study. This finding might be associated with the therapeutic mechanism of ECT on psychotic symptoms.
Expression of phosphatidylinositol transfer proteins was increased after ECT. PI-TPs are responsible for the transport of phosphatidylinositol (PI) and other phospholipids between membranes. PI-TPs play a role in the delivery of PI to PI-4- kinase, which synthesizes PI-4,5-biphosphate (PIP2). Because of the high affinity of PI-TPs for PIP and PIP2, these lipids remain bound to PI-TPs that may also deliver these substances for PLC (17). Kauffmann et al. (18) have identified PI-TPα as an essential component for ensuring substrate supply to PLC. This enzyme hydrolyzes PIP2 to generate the second messengers: diacylglycerol (DAG) and inositol trisphosphate (IP3). In the next step, DAG activates PKC via phosphory- lation which initiates the mitogen activated protein kinase (MAPK) cascade. A second messenger generating system that may be involved in mood regulation involves phosphoinosi- tide metabolism (19, 20). In this system, the plasma mem- brane located lipid PIP2 is hydrolyzed to a postsynaptic sec- ond messenger that contributes to chronic cell stimulation by altering the electrical activity in the neuron. Inositol formed
during this process is recycled by the enzyme inositol mono- phosphatase. Cells in the central nervous system have limit- ed access to plasma sources of inositol and depend on its syn- thesis for the transduction of neuronal signals. Lithium in ther- apeutic concentrations blocks the activity of inositol monop- hosphatase, inhibiting the hydrolysis of intermediate inosi- tol phosphates into inositol, which is necessary for the resyn- thesis of PIP2 (21). As a result, PIP2 levels are depleted, and the lipid is no longer able to stimulate the formation of ade- quate quantities of the second messenger or alter electrical activity. Therefore, increased expression of PI-TPαin ECT- treated rat brain may be associated with a mood stabilizing effect of ECT.
The ACY1 protein is a homodimeric zinc-binding metal- loenzyme located in the cytosol (22). The ACY1 protein is usually involved in detoxification processes. It hydrolyzes a variety of N-acylated amino acids generating free amino acids and may be involved in the synthesis of hippurate that is formed during detoxification of aromatic compounds (23). A dimin- ished expression of this enzyme has also been found in lung cancer cell lines of small cell type and pulmonary tumors (24).
However, its physiological role remains unclear. The physi- ological role of the other identified proteins such as similar to ubiquitin-like 1 (sentrin) activating enzyme subunit 1 and suppressor of G2 allele of SKP1 homolog is still unknown.
Further studies are required to determine whether these pro- teins are associated with the mechanisms of ECT in regard to its therapeutic and/or adverse effects.
In conclusion, the current study was designed to identify differentially expressed proteins in rat brains following expo- sure to repeated ECT using proteomic analysis. Twenty four protein spots whose expression was increased or decreased after exposure to ECT were isolated. Six different proteins from 7 spots, whose levels were altered by more than 3.0-fold in more than four of the eight pairs analyzed, were identified by MA- LDI-TOF/mass spectrometry. These proteins were ACY1 pro- tein, S100B, 14-3-3 protein zeta/delta, similar to ubiquitin- like 1 (sentrin) activating enzyme subunit 1, PI-TPαand sup- pressor of G2 allele of SKP1 homolog. Taken together, the results obtained might help us to find a valuable resource for the investigation of mechanisms involved in the therapeutic and adverse effects of ECT.
REFERENCES
1. Shergill SS, Katona CL. Pharmacotherapy of affective disorders. In:
Helmchen H, Henn F, Lauter H, Sartorius N, eds. Contemporary Psy- chiatry. 4th ed. Heidelberg: Springer 2001; 317-36.
2. Rohlff C. Proteomics in molecular medicine: applications in central nervous systems disorders. Electrophoresis 2000; 21: 1227-34.
3. Morrison RS, Kinoshita Y, Johnson MD, Conrads TP. Proteomics in the postgenomic age. Adv Protein Chem 2003; 65: 1-23.
4. Moseley FL, Bicknell KA, Marber MS, Brooks G. The use of pro-
teomics to identify novel therapeutic targets for the treatment of dis- ease. J Pharm Pharmacol 2007; 59: 609-28.
5. Bradford MM. A rapid and sensitive method for the quantitation of microgram quantities of protein utilizing the principle of protein-dye binding. Anal Biochem 1976; 72: 248-54.
6. Gorg A, Weiss W, Dunn MJ. Current two-dimensional electrophore- sis technology for proteomics. Proteomics 2004; 4: 3665-85.
7. Hwa JS, Kim HJ, Goo BM, Park HJ, Kim CW, Chung KH, Park HC, Chang SH, Kim YW, Kim DR, Cho GJ, Choi WS, Kang KR. The expression of ketohexokinase is diminished in human clear cell type of renal cell carcinoma. Proteomics 2006; 6: 1077-84.
8. Donato R. S100: a multigenic family of calcium-modulated proteins of the EF-hand type with intracellular and extracellular functional roles. Int J Biochem Cell Biol 2001; 33: 637-68.
9. Rothermundt M, Falkai P, Ponath G, Abel S, Burkle H, Diedrich M, Hetzel G, Peters M, Siegmund A, Pedersen A, Maier W, Schramm J, Suslow T, Ohrmann P, Arolt V. Glial cell dysfunction in schizophre- nia indicated by increased S100B in the CSF. Mol Psychiatry 2004;
9: 897-9.
10. Busnello JV, Leke R, Oses JP, Feier G, Bruch R, Quevedo J, Kapczin- ski F, Souza DO, Cruz Portela LV. Acute and chronic electroconvul- sive shock in rats: effects on peripheral markers of neuronal injury and glial activity. Life Sci 2006; 78: 3013-7.
11. Yaffe MB, Rittinger K, Volinia S, Caron PR, Aitken A, Leffers H, Gamblin SJ, Smerdon SJ, Cantley LC. The structural basis for 14- 3-3: phosphopeptide binding specificity. Cell 1997; 91: 961-71.
12. Urschel S, Bassermann F, Bai RY, Munch S, Peschel C, Duyster J.
Phosphorylation of Grb10 regulates its interaction with 14-3-3. J Biol Chem 2005; 280: 16987-93.
13. Bell R, Munro J, Russ C, Powell JF, Bruinvels A, Kerwin RW, Col- lier DA. Systematic screening of the 14-3-3 eta (n) chain gene for poly- morphic variants and case-control analysis in schizophrenia. Am J Med Genet 2000; 96: 736-43.
14. Vawter MP, Barrett T, Cheadle C, Sokolov BP, Wood WH 3rd, Dono- van DM, Webster M, Freed WJ, Becker KG. Application of cDNA microarrays to examine gene expression differences in schizophre- nia. Brain Res Bull 2001; 55: 641-50.
15. Wong AH, Macciardi F, Klempan T, Kawczynski W, Barr CL, Laka-
too S, Wong M, Buckle C, Trakalo J, Boffa E, Oak J, Azevedo MH, Dourado A, Coelho I, Macedo A, Vicente A, Valente J, Ferreira CP, Pato MT, Pato CN, Kennedy JL, Van Tol HH. Identification of can- didate genes for psychosis in rat models, and possible association between schizophrenia and the 14-3-3eta gene. Mol Psychiatry 2003;
8: 156-66.
16. Middleton FA, Peng L, Lewis DA, Levitt P, Mirnics K. Altered expres- sion of 14-3-3 genes in the prefrontal cortex of subjects with schizophre- nia. Neuropsychopharmacology 2005; 30: 974-83.
17. Thomas GM, Cunningham E, Fensome A, Ball A, Totty NF, Truong O, Hsuan JJ, Cockcroft S. An essential role for phosphatidylinositol transfer protein in phospholipase C-mediated inositol lipid signaling.
Cell 1993; 74: 919-28.
18. Kauffmann-Zeh A, Thomas GM, Ball A, Prosser S, Cunningham E, Cockcroft S, Hsuan JJ. Requirement for phosphatidylinositol trans- fer protein in epidermal growth factor signaling. Science 1995; 268:
1188-90.
19. Baraban JM. Toward a crystal-clear view of lithium’s site of action.
Proc Natl Acad Sci, USA 1994; 91: 5738-9.
20. Pollack SJ, Atack JR, Knowles MR, McAllister G, Ragan CI, Baker R, Fletcher SR, Iversen LL, Broughton HB. Mechanism of inositol monophosphatase, the putative target of lithium therapy. Proc Natl Acad Sci, USA 1994; 91: 5766-70.
21. Manji HK, Chen G, Hsiao JK, Risby ED, Masana MI, Potter WZ.
Regulation of signal transduction pathways by mood-stabilizing agents:
implications for the delayed onset of therapeutic efficacy. J Clin Psy- chiatry 1996; 57 (Suppl 13): 34-46.
22. Giardina T, Biagini A, Massey-Harroche D, Puigserver A. Distribu- tion and subcellular localization of acylpeptide hydrolase and acylase I along the hog gastro-intestinal tract. Biochimie 1999; 81: 1049-55.
23. Lindner H, Hopfner S, Tafler-Naumann M, Miko M, Konrad L, Rohm KH. The distribution of aminoacylase I among mammalian species and localization of the enzyme in porcine kidney. Biochimie 2000; 82:
129-37.
24. Cook RM, Franklin WA, Moore MD, Johnson BE, Miller YE. Muta- tional inactivation of aminoacylase-I in a small cell lung cancer cell line. Genes Chromosomes Cancer 1998; 21: 320-5.
. .