D I A B E T E S & M E T A B O L I S M J O U R N A L
This is an Open Access article distributed under the terms of the Creative Commons At- tribution Non-Commercial License (http://creativecommons.org/licenses/by-nc/3.0/) which permits unrestricted non-commercial use, distribution, and reproduction in any medium, provided the original work is properly cited.
Pattern of Stress-Induced Hyperglycemia according to Type of Diabetes: A Predator Stress Model
Jin-Sun Chang, Young-Hye You, Shin-Young Park, Ji-Won Kim, Hun-Sung Kim, Kun-Ho Yoon, Jae-Hyoung Cho
Department of Internal Medicine, Seoul St. Mary’s Hospital, The Catholic University of Korea College of Medicine, Seoul, Korea
Background: We aimed to quantify stress-induced hyperglycemia and differentiate the glucose response between normal ani- mals and those with diabetes. We also examined the pattern in glucose fluctuation induced by stress according to type of diabetes.
Methods: To load psychological stress on animal models, we used a predator stress model by exposing rats to a cat for 60 min- utes and measured glucose level from the beginning to the end of the test to monitor glucose fluctuation. We induced type 1 dia- betes model (T1D) for ten Sprague-Dawley rats using streptozotocin and used five Otsuka Long-Evans Tokushima Fatty rats as obese type 2 diabetes model (OT2D) and 10 Goto-Kakizaki rats as nonobese type 2 diabetes model (NOT2D). We performed the stress loading test in both the normal and diabetic states and compared patterns of glucose fluctuation among the three mod- els. We classified the pattern of glucose fluctuation into A, B, and C types according to speed of change in glucose level.
Results: Increase in glucose, total amount of hyperglycemic exposure, time of stress-induced hyperglycemia, and speed of glu- cose increase were significantly increased in all models compared to the normal state. While the early increase in glucose after exposure to stress was higher in T1D and NOT2D, it was slower in OT2D. The rate of speed of the decrease in glucose level was highest in NOT2D and lowest in OT2D.
Conclusion: The diabetic state was more vulnerable to stress compared to the normal state in all models, and the pattern of glu- cose fluctuation differed among the three types of diabetes. The study provides basic evidence for stress-induced hyperglycemia patterns and characteristics used for the management of diabetes patients.
Keywords: Diabetes; Glucose fluctuation; Models, animal; Predator stress model; Stress; Type of diabetes
Corresponding author: Jae-Hyoung Cho
Division of Endocrinology and Metabolism, Department of Internal Medicine, Seoul St. Mary’s Hospital, The Catholic University of Korea College of Medicine, 222 Banpo-daero, Seocho-gu, Seoul 137-701, Korea
INTRODUCTION
Recent studies have explored the incidence of complications in diabetic populations and emphasized strict glucose control to reduce these complications. Despite advances in antidiabet- ic medications, the number of diabetic patients who achieve target glucose level has remained low [1]. As well as chronic hyperglycemia, acute glucose fluctuation activates oxidative stress, which is a mechanism of complications in diabetic pop- ulations [2]. Therefore, it is essential to control acute glucose fluctuation to achieve target glucose level and to reduce com- plications. Glucose fluctuation is affected by various factors;
therefore, the factors aggravating hyperglycemia also need to be controlled in order to more effectively manage diabetes.
Psychiatric stress is a major factor causing increased glucose level [3]. Stress hormones such as glucagon and epinephrine increase glycogenolysis and gluconeogenesis in the liver and reduce glucose uptake in muscle, producing resultant hyper- glycemia [4]. While many studies have reported that psychiat- ric stress aggravates hyperglycemia in diabetes [3], the pattern and extent of hyperglycemia induced by psychiatric stress and the difference in the amount of psychiatric stress-induced hy- perglycemia between normal and diabetic subjects remain unknown. In addition, the pattern and level of hyperglycemia http://dx.doi.org/10.4093/dmj.2013.37.6.475
pISSN 2233-6079 · eISSN 2233-6087
induced by psychiatric stress are difficult to investigate because psychiatric stress is difficult to objectively measure and quan- tify and to reproduce in humans due to ethical and method- ological considerations.
Therefore, we used animal models to investigate the charac- teristics of patterns of glucose fluctuation in response to psy- chiatric stress. Moreover, we investigated potential differences in the pattern of stress-induced hyperglycemia between type 1 diabetes, caused by an absolute insulin deficiency, and type 2 diabetes, with chronic hyperglycemia resulting from insulin resistance together with relative insulin deficiency. For type 2 diabetes, we included an obese type 2 diabetes model (OT2D), which is predominantly caused by insulin resistance [5-7], and a nonobese type 2 diabetes model (NOT2D), which is caused mainly by insulin deficiency [8-11]. In the present study, we established an acute stress-loading test to evaluate and quanti- fy glucose changes induced by acute psychiatric stress rather than physical stress in the animal models; we exposed rats with a normal glucose level to a cat in an experimental box—a pred- ator stress model [12,13]—thereby subjecting the rats to fear stress. When predators (e.g., cats and ferrets) or odors of pred- ators are presented to rodents, the hypothalamic–pituitary–adre- nocortical axis is activated [14-19], and stress-related neu- rotransmitters are excreted in the brains [20,21]. Next, after progression to type 1 or type 2 diabetes, we repeated the stress- loading test in the rats and examined the patterns in glucose fluctuation and glucose level in the diabetes models. We com- pared the differences in glucose change according to the type of diabetes, including type 1 diabetes, obese type 2 diabetes, and nonobese type 2 diabetes, as well as between the normal and diabetic states. Thus, the present study shows quantified patterns in glucose change in normal and diabetic rats and type of glucose change according to diabetes type. We emphasize that psychiatric stress may be a serious factor in the aggravation of hyperglycemia in diabetes, and that the pattern of glucose change should be considered for effective treatment of diabe- tes patients.
METHODS
Stress loading test (predator stress model)
We prepared an experimental model for stress loading by cre- ating an environment believed to produce actual psychiatric stress rather than using physical stress. Rats in an experimen- tal box were exposed to a cat. A male cat with short hair and a
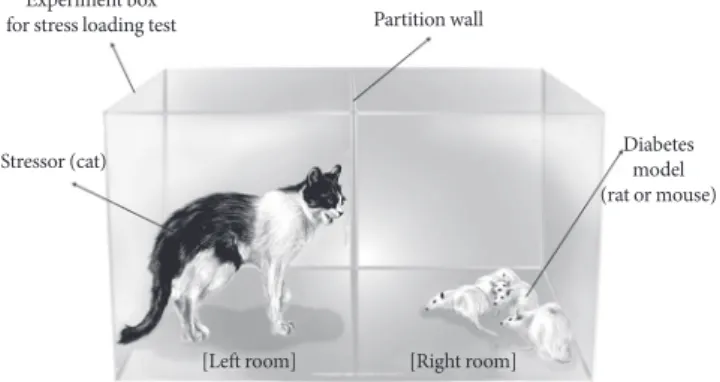
body weight of 1.8 kg was used in the study. The cat and rats were placed in adjacent compartments of the experimental box to produce a consistent psychiatric stress on the rats, as shown in Fig. 1. The box was 80 cm in width, 45 cm in length, and 60 cm in height and had 32 1-cm holes in each front and back wall and 18 holes in each side wall. A transparent partition with 18 holes was placed in the center of the box to prevent the cat from attacking the rats but to allow visual and auditory stimuli and exposure to predator odor. The duration of expo- sure to the cat in the experimental box was 60 minutes. The rats received only water for at least 12 hours before the experi- ment and remained in their cages for 30 minutes after being transferred to the experimental room and before exposure to the cat. The cat was removed from the testing room after the test was complete.
Glucose monitoring and patterns of blood glucose change To determine changes in blood glucose induced by the preda- tor stress, we measured the glucose levels of the rats with a glucometer (ACCU-CHEK Performa; Roche, Indianapolis, IN, USA) at 5-minute intervals after exposure to the cat. We used capillary blood from the tail tips of the rats. We contin- ued to measure blood glucose at 5-minute intervals even after removal of the cat until blood glucose returned to baseline lev- el. To avoid exposure to any trace of the cat remaining in the experimental box, the rats were moved back to their home cag- es during the poststress period. To assess the pattern of blood glucose change, we defined baseline glucose level (Gbase; mg/dL) as blood glucose level before exposure to the cat and peak glu-
Experiment box
for stress loading test Partition wall
Stressor (cat)
[Left room] [Right room]
Diabetes model (rat or mouse)
Fig. 1. Stress loading on rats. We exposed rats to a cat in an ex- perimental box to produce mental stress. The box was com- posed of two separate but adjacent compartments into which the cat and the rats were placed. Rats were exposed to the cat for 60 minutes for the stress-loading test. We measured glucose levels with a glucometer at 5-minute intervals during the test.
cose level (Gpeak; mg/dL) as the peak level of blood glucose dur- ing the stress-loading test. We calculated G (Gpeak to Gbase; mg/
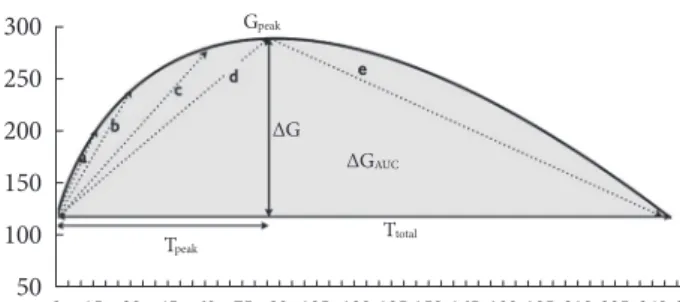
dL) to assess the glucose increment induced by the stress. For quantification of total hyperglycemic exposure by stress, we calculated area under the curve of glucose change (total amount of hyperglycemic change caused by stress, ∆GAUC; mg/dL/min) from beginning to end of the stress-loading test. We defined time to reach peak glucose level (Tpeak; min) as the time to reach peak glucose level and time to return to the baseline glucose level from the beginning of the stressor exposure (Ttotal; min) as the time to return to baseline glucose level from the begin- ning of the stressor exposure. To assess the rate of increase of glucose level, we calculated the increase in glucose. Thus, we defined Grinc(15 min), Grinc(30 min), and Grinc(60 min) (mg/dL/min) as the gradient of increase during the first 15, 30, and 60 minutes from baseline, respectively. Increasing rate of glucose from be- ginning to peak (Grinc(peak)) was defined as the increase in glu- cose from baseline level to peak level. We also calculated the decrease in glucose. We defined decreasing rate of glucose from peak level to baseline level (Grdec; mg/dL/min) as the decrease in glucose from peak to baseline level (Fig. 2).
Diabetes models
To perform the stress-loading test on a type 1 diabetes model (T1D), we prepared 10 male Sprague-Dawley (SD) rats with normal glucose level. The rats’ weight range was 250 to 300 g.
We performed the stress-loading test as a baseline study before development of diabetes. Then, a model of type 1 diabetes was induced by a single intraperitoneal injection of 70 mg/kg strep- tozotocin. After the streptozotocin injection, we measured fast- ing plasma glucose level to identify development of diabetes and repeated the stress loading test on the same rats with type 1 diabetes.
We prepared five male Otsuka Long-Evans Tokushima Fatty (OLETF) rats, which is an established model of spontaneous noninsulin-dependent diabetes mellitus or human type 2 dia- betes that exhibits obesity, hyperinsulinemia, hypertriglyceri- demia, and hyperglycemia [22,23], to perform the stress-load- ing test on OT2D. Firstly, we performed the intraperitoneal glucose tolerance test (IPGTT) and the stress loading test on 28-week-old OLETF rats with normal glucose level and a weight range of 450 to 550 g. We regularly measured fasting plasma glucose levels during progression to diabetes and repeated IP- GTT to confirm the development of diabetes and the stress- loading test on the same OLETF rats at 50 weeks of age after progression to type 2 diabetes.
The Goto-Kakizaki (GK) rat, selectively bred from Wistar rats with increased blood glucose levels, is a well-studied non- obese spontaneous type 2 diabetes animal model [24]. Its main diabetic phenotype is impaired glucose-stimulated insulin se- cretion (GSIS) [25,26]. To test stress-induced glucose changes in a NOT2D model, we prepared ten male 6-week-old GK rats of 180 to 230 g and performed the stress-loading test on the same rats at both baseline and diabetes stages. All the rats were housed in two or three cages per rat model at a consistent tem- perature and humidity (12-hour light/dark cycle). They were maintained in conventional animal facilities (~21°C) with ad libitum food and water at the animal facility of The Catholic University of Korea College of Medicine. All investigations on the rats were performed with the approval of the Institutional Animal Care and Use Committee of The Catholic University of Korea College of Medicine, Seoul, Korea.
Statistical analysis
Values were expressed as mean±standard deviation. For com- parison of the extent of hyperglycemia induced by predator stress between normal and diabetic states in each diabetes model, we used the independent two-tailed Student t-test. The repeated measures analysis of variance test was used for com- parison of the extent of hyperglycemia among the type 1 dia- betes, nonobese type 2 diabetes, and OT2Ds. Statistically sig-
0 30 60 90 120 150 180 210 240 15 45 75 105 135 165 195 225 255 Gpeak
Tpeak Ttotal
∆GAUC
∆G
300 250 200 150 100 50
Fig. 2. Variables for analysis of pattern of glucose fluctuation induced by stress. Gpeak, peak glucose level; ∆G, glucose incre- ment caused by stress; ∆GAUC, total amount of hyperglycemic change caused by stress; Tpeak, time to reach peak glucose level;
Ttotal, time to return to the baseline glucose level from the be- ginning of the stressor exposure; Grinc(peak), increasing rate of glucose from beginning to peak (mg/dL/min); Grinc(15 min, 30 min, and 60 min), increasing rate of glucose from beginning to 15, 30 to 60 minutes points, respectively; Grdec, decreasing rate of glu- cose from peak level to baseline level. aGrinc(15 min), bGrinc(30 min),
cGrinc(60 min), dGrinc(peak), eGrdec.
nificant differences were recognized at P<0.05.
RESULTS
Stress-induced hyperglycemia Type 1 diabetes model
The glucose parameters are shown in Table 1. In normal SD rats, the glucose level was increased by 26.8±9.7 mg/dL with exposure to a cat and returned to baseline after 63.0±5.7 min- utes of stress loading. After induction of type 1 diabetes, the glucose increment in the rats with 60 minutes exposure to a cat was dramatically increased over the previous normal state.
Glucose level was increased to a peak of 388.2±145.5 mg/dL with an increment of 164.2±67.6 mg/dL and only returned to baseline after about 4 hours, which was a 4-fold increase over the normal state. The glucose increment (∆G) and ∆GAUC ex- perienced about 5-fold and 20-fold increases, respectively, in the type 1 diabetes state compared with the previous normal state. After stress loading of the rats, the glucose concentration in the blood increased at a rate of 4.8 mg/dL/min during the first 15 minutes in type 1 diabetes, which was a 4-fold increase
compared to the normal glucose state. Table 1 shows the defin- itive differences in blood glucose level changes induced by fear stress between the normal glucose and type 1 diabetes states.
Obese type 2 diabetes model
The results of glucose changes induced by fear stress in the normal and type 2 diabetes stages are shown in Table 1. ΔG in- duced by stress loading in 28-week-old normal rats was 38.0±
11.0 mg/dL, and glucose level peaked at the time of stressor exposure (Tpeak, 19.0±4.2 minutes) and returned to baseline shortly after the stressor was removed (Ttotal, 69.0±11.4 min- utes). In the 50-week-old rats with type 2 diabetes, ΔG was 98.5±21.1 mg/dL with stress loading, which was an approxi- mately 3-fold increase over the normal stage, and hyperglyce- mia persisted for about 3 hours even after the stress was re- moved. ΔGAUC caused by stress in the type 2 diabetes stage was a greater than 6-fold increase compared to the normal stage.
The rate of increase of the glucose level within the initial peri- od of stress loading was 0.9 mg/dL/min in the diabetes stage, which was significantly higher than that of the normal stage (0.3 mg/dL/min, P<0.05) (Table 1).
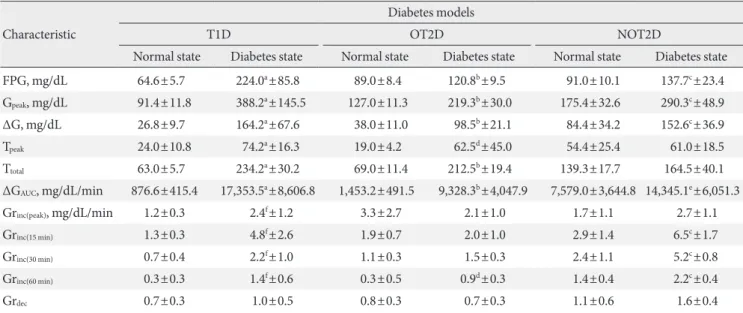
Table 1. Characteristics of glucose fluctuation induced by acute predator stress in three diabetes models before and after the de- velopment of diabetes
Characteristic
Diabetes models
T1D OT2D NOT2D
Normal state Diabetes state Normal state Diabetes state Normal state Diabetes state
FPG, mg/dL 64.6±5.7 224.0a±85.8 89.0±8.4 120.8b±9.5 91.0±10.1 137.7c±23.4
Gpeak, mg/dL 91.4±11.8 388.2a±145.5 127.0±11.3 219.3b±30.0 175.4±32.6 290.3c±48.9
∆G, mg/dL 26.8±9.7 164.2a±67.6 38.0±11.0 98.5b±21.1 84.4±34.2 152.6c±36.9
Tpeak 24.0±10.8 74.2a±16.3 19.0±4.2 62.5d±45.0 54.4±25.4 61.0±18.5
Ttotal 63.0±5.7 234.2a±30.2 69.0±11.4 212.5b±19.4 139.3±17.7 164.5±40.1
∆GAUC, mg/dL/min 876.6±415.4 17,353.5a±8,606.8 1,453.2±491.5 9,328.3b±4,047.9 7,579.0±3,644.8 14,345.1e±6,051.3
Grinc(peak), mg/dL/min 1.2±0.3 2.4f±1.2 3.3±2.7 2.1±1.0 1.7±1.1 2.7±1.1
Grinc(15 min) 1.3±0.3 4.8f±2.6 1.9±0.7 2.0±1.0 2.9±1.4 6.5c±1.7
Grinc(30 min) 0.7±0.4 2.2f±1.0 1.1±0.3 1.5±0.3 2.4±1.1 5.2c±0.8
Grinc(60 min) 0.3±0.3 1.4f±0.6 0.3±0.5 0.9d±0.3 1.4±0.4 2.2c±0.4
Grdec 0.7±0.3 1.0±0.5 0.8±0.3 0.7±0.3 1.1±0.6 1.6±0.4
Values are presented as mean±standard deviation.
T1D, type 1 diabetes model; OT2D, obese type 2 diabetes model; NOT2D, nonobese type 2 diabetes model; FPG, fasting plasma glucose; Gpeak, peak glucose level; ∆G, glucose increment caused by stress; Tpeak, time to reach peak glucose level; Ttotal, time to return to the baseline glucose level from the beginning of the stressor exposure; ∆GAUC, total amount of hyperglycemic change caused by stress; Grinc(peak), increasing rate of glucose from beginning to peak; Grinc(15 min, 30 min, and 60 min), increasing rate of glucose from beginning to 15, 30, and 60 minutes point, respectively;
Grdec, decreasing rate of glucose from peak level to baseline level.
aP<0.01 T1D (normal state) vs. T1D, bP<0.01 OT2D (normal state) vs. OT2D, cP<0.01 NOT2D (normal state) vs. NOT2D, dP<0.05, eP<0.01,
fP<0.05.
Nonobese type 2 diabetes model
After exposing the rats to the stressor, the blood glucose con- centration increased at a rate of 6.5±1.7 mg/dL/min during the first 15 minutes, which was significantly higher than the baseline rate (2.9±1.4 mg/dL/min, P<0.01). This increased rate of glucose change was still significantly high at 30 and 60 minutes after exposure to the stressor in NOT2D compared with the baseline stage. ΔG (152.6±36.9 mg/dL) and ΔGAUC
(14,345.1±6,051.3 mg/dL/min) were significantly greater in the nonobese type 2 diabetes state compared with the baseline stage before development of diabetes.
Patterns of stress-induced hyperglycemia
As shown in Fig. 3, the pattern of change in glucose concentra- tion induced by acute fear-like stress differed among the three types of diabetes. The rates of glucose increase within the first 15 minutes after stress loading (Grinc(15 min)) in the T1D and
NOT2D were markedly rapid and significantly higher than that in OT2D (T1D, 4.8±2.6 mg/dL/min; NOT2D, 6.5±1.7 mg/dL/min vs. OT2D, 2.0±1.0 mg/dL/min; P<0.01). Glucose increments in T1D and NOT2D were also significantly greater than in OT2D (T1D, 164.2±67.6; NOT2D, 152.6±36.9 vs.
OT2D, 98.5±21.1; P=0.045) (Fig. 4). The rate of Grdec was high- est in NOT2D (1.6±0. mg/dL/min, P<0.01); subsequently, Ttotal
was shortest in this model (61.0±18.5 minutes, P=0.003). In contrast, Grdec was lowest in OT2D (0.7±0.3 mg/dL/min, P<
0.01). The analysis revealed three different patterns of change in glucose concentration induced by acute stress according to type of diabetes. As shown in Fig. 3, T1D had pattern A, fast &
slow, in which glucose was rapidly increased by the acute stress and slowly decreased after reaching peak level; NOT2D had pattern B, fast & fast, in which glucose rapidly increased and also rapidly decreased; and OT2D had pattern C, slow & slow, in which glucose slowly increased and also slowly decreased.
mg/dL
400
300
200
100 0 10 20 30 40 50 60 70 80 90 100 110 120 130 140 150 160 170 180 190 200 210 220 230 Minutes
Pattern A RM ANOVA P=0.038a
Pattern B
Pattern C T1D
NOT2D OT2D
Fig. 3. Patterns of glucose fluctuation induced by acute predator stress with cat exposure in type 1 diabetes model (T1D), obese type 2 diabetes model (OT2D), and nonobese type 2 diabetes model (NOT2D). Pattern A, fast & slow, in which glucose was rap- idly increased by the acute stress and slowly decreased after reaching peak level; pattern B, fast & fast, in which glucose rapidly increased and also rapidly decreased; and pattern C, slow & slow, in which glucose slowly increased and also slowly decreased.
aRM ANOVA, repeated measures analysis of variance test.
DISCUSSION
It has been reported that stress plays a role in the etiology and treatment of diabetes mellitus [3]. Activation of the sympathet- ic nervous system with excessive catecholamine release con- tributes to pathogenesis of stress-induced hyperglycemia [27,28].
Catecholamines stimulate glycogenolysis and, gluconeogene- sis and inhibit insulin secretion [27,29]. However, there have been no reports of differences in stress-induced hyperglyce- mia between diabetic and nondiabetic patients or on the mechanisms of stress-induced hyperglycemia in diabetes. The present study was the first to demonstrate that glucose level is quantitatively more sensitive to psychiatric stress in diabetic than in normal subjects, and interestingly, the pattern of glu-
cose change differed according to the type of diabetes. We ob- served prominent glucose increases shortly after stress expo- sure in the diabetes models, which persisted throughout the stress exposure and even after removal of the stressor. There- fore, we classified the stress-induced hyperglycemia phase into two phases, an in-stress hyperglycemia phase and poststress hyperglycemia phase. However, this phenomenon was not ob- served in subjects with normal glucose tolerance. Our finding might reflect the stress response in diabetic patients with beta cell failure, insulin resistance, or impaired GSIS. An immedi- ate response of the autonomic nervous system and release of catecholamine occur in the in-stress hyperglycemia phase, and the GSIS and increase of cortisol occur in the poststress phase.
Gpeak and increment of glucose level induced by the acute fear Fig. 4. (A-D) Comparison of variables associated with pattern of glucose fluctuation induced by acute predator stress. Values are presented as mean±standard deviation. T1D, type 1 diabetes model; OT2D, obese type 2 diabetes model; NOT2D, nonobese type 2 diabetes model; Gpeak, peak glucose level (mg/dL); ∆G, glucose increment caused by stress (mg/dL); ∆GAUC, total amount of hyperglycemic change caused by stress (mg/dL/min); Tpeak, time to reach peak glucose level; Ttotal, time to return to the baseline glucose level from the beginning of the stressor exposure. Independent two-tailed Student t-test. aP<0.05 T1D vs. OT2D,
bP<0.01 OT2D vs. NOT2D, cP<0.05, dP<0.05, eP<0.01 T1D vs. NOT2D.
9.00
6.00
3.00
0
mg/min
T1D OT2D NOT2D
a
b
b,e
b,d b,d
D
T1D OT2D NOT2D
600 450 300 150 0
mg/dL
Gpeak
∆G
a a
b b
A T1D OT2D NOT2D
300 225 150 75 0
Minutes
Tpeak Ttotal
c,d
T1D OT2D NOT2D C 30,000
22,500 15,000 7,500 0
mg/min
∆G (AUC)
a
B
stress were significantly higher in all of the diabetes models compared to the normal glucose states, and the increased glu- cose level induced by the 60-minute stress only returned to baseline after 3 to 4 hours in the diabetes models. In contrast, there were relatively small increments in glucose induced by the stress in the same animal models with normal glucose tol- erance status, and the glucose level returned rapidly to base- line, even during the stress exposure. The total amount of hy- perglycemia caused by stress loading was increased 20-fold in T1D over the normal state. This impairment of compensation led to severe stress-induced hyperglycemia, which was more prolonged in diabetic than in normal glucose tolerance states.
We found a marked difference between the glucose param- eters induced by the same stress before and after diabetes de- velopment in the same rats, which suggests that diabetic pa- tients are considerably more sensitive to stress. We hypothe- sized that rats with normal glucose tolerance had the ability to compensate for stress-induced hyperglycemia, but lost or suf- fered weakened ability after development of diabetes. Such disability would lead to severe hyperglycemia due to stress, which could be quantified with ΔG, Gpeak, and ΔGAUC.
We also found that the pattern of the change in glucose level induced by the stress differed according to the type of diabetes.
To analyze differences in the pattern of glucose fluctuation, we quantified rates of increase and decrease of glucose level. Ini- tial rates of glucose increase were significantly higher in T1D and NOT2D than in OT2D. The rates of glucose increase with- in 15 minutes of stress loading (Grinc(15 min)) in T1D and NOT2D were two to three times than that in the OT2D, the slowest re- sponder among the three types of diabetes. The rates of glucose increase within the first 30 minutes after stress loading and decrease from Gpeak to baseline were highest in NOT2D. From these results, we characterized the pattern of stress-induced hyperglycemia as follows: pattern A, fast and slow, in which glucose rapidly increased and slowly decreased, was shown in T1D; pattern B, fast & fast, in which glucose rapidly increased and decreased, was shown in NOT2D; and pattern C, slow &
slow, in which glucose slowly increased and also slowly de- creased, was shown in the OT2D. In a previous study, T1D rats showed higher norepinephrine levels than control rats due to increased sympathetic activity [30]. In another study, ob/ob mice as subjects with obese type 2 diabetes had altered periph- eral responses to sympathetic stimuli and glycemic responses to stress [31]. We hypothesized that differences in insulin se- cretion and insulin resistance could bring about different pat-
terns in glucose change induced by stress loading according to the type of diabetes; also, there are discrepancies in diabetes types with regard to impairment of the autonomic nervous system and response to catecholamine, which could affect these different patterns.
There are several limitations to the present study. Firstly, we used a predator stress model to imitate psychiatric stress in humans. This fear stress may differ from the actual psychiatric stress or emotions like depression, anxiety, and anger experi- enced by humans. Thus, we cannot directly extrapolate the re- sults of the animal models to humans. Secondly, we used dif- ferent animal models for the three types of diabetes, which might have influenced the interpretation of the difference in pattern of glucose change induced by the stress. We also did not adjust variables by age of the rats, and we did not use con- trol groups of the same strain and age. Another limitation is that we conducted this test in an acute hyperglycemic state, which meant a short duration of exposure to hyperglycemia for the T1D model. In addition, we did not measure catechol- amine, cortisol, or glucagon level, which are considered to play key roles in stress-induced hyperglycemia [4,28,29]. Stressful stimuli can cause elevated glucose level via several different hypothalamic-pituitary pathways. When glucagon or epineph- rine is released in physiologic doses, there are modest altera- tions in glucose regulation in normal subjects. Physiologic in- creases in stress hormones such as glucagon, epinephrine, and interact cortisol synergistically. Epinephrine enhances gluca- gon-stimulated glucose production and interrupts glucose up- take, while cortisol maintains elevations in glucose output produced by epinephrine and glucagon [32]. Therefore, we could have found patterns of stress-induced hyperglycemia; it was nothing but observation of phenomenon. The findings in the present study cannot explain why different patterns of stress- induced hyperglycemia were expressed among the three dif- ferent types of diabetes or why the response to stress was over- active in the diabetic state. Although further study is warrant- ed to evaluate the specific mechanisms of stress-induced hy- perglycemia, the current study quantitatively confirmed the characteristics of acute stress-induced hyperglycemia.
Furthermore, we conclude that psychiatric stress has a much greater impact on glucose parameters in diabetes mellitus.
Therefore, stress control should be emphasized for more effec- tive diabetes management, which could result in reduced dia- betic complications and improved quality of life. We also found that the pattern of glucose change induced by stress dif-
fered according to type of diabetes, which could be applied in the actual treatment of patients with different types of diabe- tes. This study verifies the existence of specific patterns of glu- cose fluctuation induced by acute stress in diabetes mellitus and confirms the need to control psychiatric stress for more effective diabetes management to help reduce diabetic compli- cations and improve quality of life.
In conclusion, diabetic stage subjects were more vulnerable to acute stress compared to baseline stage subjects, and the pattern of glucose fluctuation differed among the three types of diabetes mellitus. This study provides basic information on stress-induced hyperglycemia; the pattern and characteristics could be used for management of diabetes patients.
CONFLICTS OF INTEREST
No potential conflict of interest relevant to this article was re- ported.
REFERENCES
1. Walker EA, Shmukler C, Ullman R, Blanco E, Scollan-Kolio- poulus M, Cohen HW. Results of a successful telephonic inter- vention to improve diabetes control in urban adults: a random- ized trial. Diabetes Care 2011;34:2-7.
2. Monnier L, Mas E, Ginet C, Michel F, Villon L, Cristol JP, Co- lette C. Activation of oxidative stress by acute glucose fluctua- tions compared with sustained chronic hyperglycemia in pa- tients with type 2 diabetes. JAMA 2006;295:1681-7.
3. Surwit RS, van Tilburg MA, Zucker N, McCaskill CC, Parekh P, Feinglos MN, Edwards CL, Williams P, Lane JD. Stress man- agement improves long-term glycemic control in type 2 diabe- tes. Diabetes Care 2002;25:30-4.
4. Surwit RS, Schneider MS. Role of stress in the etiology and treatment of diabetes mellitus. Psychosom Med 1993;55:380-93.
5. Warram JH, Martin BC, Krolewski AS, Soeldner JS, Kahn CR.
Slow glucose removal rate and hyperinsulinemia precede the development of type II diabetes in the offspring of diabetic parents. Ann Intern Med 1990;113:909-15.
6. Gulli G, Ferrannini E, Stern M, Haffner S, DeFronzo RA. The metabolic profile of NIDDM is fully established in glucose-tol- erant offspring of two Mexican-American NIDDM parents.
Diabetes 1992;41:1575-86.
7. Martin BC, Warram JH, Krolewski AS, Bergman RN, Soeld- ner JS, Kahn CR. Role of glucose and insulin resistance in de-
velopment of type 2 diabetes mellitus: results of a 25-year fol- low-up study. Lancet 1992;340:925-9.
8. Pimenta W, Mitrakou A, Jensen T, Yki-Jarvinen H, Daily G, Gerich J. Insulin secretion and insulin sensitivity in people with impaired glucose tolerance. Diabet Med 1996;13(9 Suppl 6):
S33-6.
9. Yoneda H, Ikegami H, Yamamoto Y, Yamato E, Cha T, Kawa- guchi Y, Tahara Y, Ogihara T. Analysis of early-phase insulin responses in nonobese subjects with mild glucose intolerance.
Diabetes Care 1992;15:1517-21.
10. Matsumoto K, Miyake S, Yano M, Ueki Y, Yamaguchi Y, Aka- zawa S, Tominaga Y. Glucose tolerance, insulin secretion, and insulin sensitivity in nonobese and obese Japanese subjects.
Diabetes Care 1997;20:1562-8.
11. Doi K, Taniguchi A, Nakai Y, Kawamura H, Higaki Y, Yokoi H, Tanaka H, Fujitani J, Suzuki M, Tokuyama K, Sakai M, Fuku- shima M. Decreased glucose effectiveness but not insulin re- sistance in glucose-tolerant offspring of Japanese non-insulin- dependent diabetic patients: a minimal-model analysis. Me- tabolism 1997;46:880-3.
12. Park CR, Zoladz PR, Conrad CD, Fleshner M, Diamond DM.
Acute predator stress impairs the consolidation and retrieval of hippocampus-dependent memory in male and female rats.
Learn Mem 2008;15:271-80.
13. Figueiredo HF, Bodie BL, Tauchi M, Dolgas CM, Herman JP.
Stress integration after acute and chronic predator stress: dif- ferential activation of central stress circuitry and sensitization of the hypothalamo-pituitary-adrenocortical axis. Endocrinol- ogy 2003;144:5249-58.
14. Blanchard RJ, Nikulina JN, Sakai RR, McKittrick C, McEwen B, Blanchard DC. Behavioral and endocrine change following chronic predatory stress. Physiol Behav 1998;63:561-9.
15. Morrow BA, Elsworth JD, Roth RH. Fear-like biochemical and behavioral responses in rats to the predator odor, TMT, are de- pendent on the exposure environment. Synapse 2002;46:11-8.
16. Dias Soares D, Fernandez F, Aguerre S, Foury A, Mormede P, Chaouloff F. Fox odour affects corticosterone release but not hippocampal serotonin reuptake and open field behaviour in rats. Brain Res 2003;961:166-70.
17. File SE, Zangrossi H Jr, Sanders FL, Mabbutt PS. Dissociation between behavioral and corticosterone responses on repeated exposures to cat odor. Physiol Behav 1993;54:1109-11.
18. Anisman H, Hayley S, Kelly O, Borowski T, Merali Z. Psycho- genic, neurogenic, and systemic stressor effects on plasma cor- ticosterone and behavior: mouse strain-dependent outcomes.
Behav Neurosci 2001;115:443-54.
19. Adamec R, Kent P, Anisman H, Shallow T, Merali Z. Neural plasticity, neuropeptides and anxiety in animals: implications for understanding and treating affective disorder following traumatic stress in humans. Neurosci Biobehav Rev 1998;23:
301-18.
20. Morrow BA, Redmond AJ, Roth RH, Elsworth JD. The preda- tor odor, TMT, displays a unique, stress-like pattern of dopa- minergic and endocrinological activation in the rat. Brain Res 2000;864:146-51.
21. Hayley S, Borowski T, Merali Z, Anisman H. Central mono- amine activity in genetically distinct strains of mice following a psychogenic stressor: effects of predator exposure. Brain Res 2001;892:293-300.
22. Kawano K, Hirashima T, Mori S, Saitoh Y, Kurosumi M, Natori T. Spontaneous long-term hyperglycemic rat with diabetic complications. Otsuka Long-Evans Tokushima Fatty (OLETF) strain. Diabetes 1992;41:1422-8.
23. Kawano K, Hirashima T, Mori S, Natori T. OLETF (Otsuka Long-Evans Tokushima Fatty) rat: a new NIDDM rat strain.
Diabetes Res Clin Pract 1994;24 Suppl:S317-20.
24. Goto Y, Kakizaki M, Masaki N. Production of spontaneous di- abetic rats by repetition of selective breeding. Tohoku J Exp Med 1976;119:85-90.
25. Ostenson CG, Efendic S. Islet gene expression and function in
type 2 diabetes: studies in the Goto-Kakizaki rat and humans.
Diabetes Obes Metab 2007;9 Suppl 2:180-6.
26. Portha B, Lacraz G, Kergoat M, Homo-Delarche F, Giroix MH, Bailbe D, Gangnerau MN, Dolz M, Tourrel-Cuzin C, Movassat J. The GK rat beta-cell: a prototype for the diseased human be- ta-cell in type 2 diabetes? Mol Cell Endocrinol 2009;297:73-85.
27. Barth E, Albuszies G, Baumgart K, Matejovic M, Wachter U, Vogt J, Radermacher P, Calzia E. Glucose metabolism and cat- echolamines. Crit Care Med 2007;35(9 Suppl):S508-18.
28. Nonogaki K. New insights into sympathetic regulation of glu- cose and fat metabolism. Diabetologia 2000;43:533-49.
29. Mechanick JI. Metabolic mechanisms of stress hyperglycemia.
JPEN J Parenter Enteral Nutr 2006;30:157-63.
30. Lee JH, Konarska M, McCarty R. Physiological responses to acute stress in alloxan and streptozotocin diabetic rats. Physiol Behav 1989;45:483-9.
31. Kuhn CM, Cochrane C, Feinglos MN, Surwit RS. Exaggerated peripheral responses to catecholamines contributes to stress- induced hyperglycemia in the ob/ob mouse. Pharmacol Biochem Behav 1987;26:491-5.
32. Eigler N, Sacca L, Sherwin RS. Synergistic interactions of physi- ologic increments of glucagon, epinephrine, and cortisol in the dog: a model for stress-induced hyperglycemia. J Clin Invest 1979;63:114-23.