Journal of Bacteriology and Virology 2007. Vol. 37, No. 4 p.203 – 212
Proteomic Analysis of Helicobacter pylori Whole Cell Proteins using the Narrow Range IPG Strips
Jeong-Won Park1, Seung-Gyu Lee1, Jae-Young Song1, Jin-Su Jun2, Jung-Soo Joo1, Hee-Shang Youn2, Ji-Hyun Seo2, Hyung-Lyun Kang1,4, Seung-Chul Baik1,3,
Woo-Kon Lee1,4, Myung-Je Cho1,4 and Kwang-Ho Rhee1,4*
1Department of Microbiology, Gyeongsang National University School of Medicine, Jinju, Gyeong-Nam 660-751, Republic of Korea,
2Department of Pediatrics, Gyeongsang National University School of Medicine, Jinju, Gyeong-Nam 660-751, Republic of Korea,
3Institute of Health Science, Gyeongsang National University, Jinju, Gyeong-Nam 660-751, Republic of Korea,
4Research Institute of Life Science, Gyeongsang National University, Jinju, Gyeong-Nam 660-701, Republic of Korea
Received : October 2, 2007 Accepted : October 25, 2007
It has been reported that most of Helicobacter pylori proteome components appear so crowded in the region of pH 4.5~8.0 that a lot of them were inseparable in 2-DE using the broad range IPG strip. Therefore, inseparable protein spots in 2-DE profiles have to be apart from each other for improving the protein identification. Here, we attempt to examine the usability of the narrow range IPG strips for separating close spots in the broad range IPG strip at proteomic analysis of H. pylori. The whole cell proteins of H. pylori strain 26695 were separated by narrow range IPG strips (pI 3.9~5.1, 4.7~5.9, 5.5~6.7, and 6.3~8.3, respectively), followed by SDS-PAGE, and visualized by silver staining, showing that the distances between spots were widened and the total number of detectable spots was increased. Resolved protein spots were identified by the peptide fingerprinting using MALDI-TOF-MS. As a result, 87 expressed proteins were identified by the peptide fingerprinting. Of them, 23 proteins, including hydrogenase expression/formation protein, purine-binding chemotaxis protein, and ribosomal protein S6, have not been reported in the previous proteome studies of H. pylori. Thus, these results demonstrate that the high complexity proteome components could be effectively separated using the narrow range IPG strips, which might be helpful to strengthen the contents of the master protein map of the H. pylori reference strain.
Key Words: Narrow range IPG strip / Helicobacter pylori / Proteomics
INTRODUCTION
Helicobacter pylori, a gram-negative spiral bacterium, was first observed in human gastric mucosa in 1982 by
Marshall and Warren (22). The discovery of H. pylori in the gastric mucosa has provided a new paradigm for under- standing the pathogenesis and control of most gastric disorders including peptic ulcer and gastric cancers (5,7,13).
Gastric mucosa with H. pylori challenges are destined to develop inflammatory responses resulting in accumulating reactive oxygen radicals which damage DNAs of gastric tissues to lead pathological events. Although the severity of gastric diseases caused by H. pylori varies from asympto- matic to ulcerative or malignant (3,8), most H. pylori infec- 203
*Corresponding author: Kwang-Ho Rhee. Department of Microbiology, Gyeongsang National University School of Medicine, Jinju, Gyeong-Nam 660-751, Republic of Korea.
Phone: +82-55-751-8781, Fax: +82-55-759-1588 e-mail: [email protected]
**This study was supported by grant 02-PJ1-PG10-20201-005 from the Ministry of Health and Welfare of Korea.
tions cause only benign subclinical symptoms and do not progress to serious diseases (27,28). Since more than half of the world's population suffers from H. pylori infection (3,6,31), gastric diseases caused by H. pylori infection might be the most common human disorders.
Genome sequencing of H. pylori strains has been initiated for delving into their biochemistry and metabolism, which may provide novel drug targets for the development of monotherapies against H. pylori. The entire genome sequences of H. pylori strains 26695, J99, HPAG1 have been reported (1,26,32). The accumulation of genomic information, combined with advances in protein separation and identification techniques, has advanced the technology of proteomics (17). High-throughput two-dimensional elec- trophoresis (2-DE) displays and the identification of the entire protein complement of the genome expressed in an organism can lead to the identification of disease-specific markers or virulent strains of pathogenic bacteria (9). The proteome components of H. pylori have been investigated to identify functionally active genes, subcellular proteins, disease-specific proteins, and immunoreactive proteins. The genome of H. pylori has been determined to contain about 1,590 open reading frames (ORFs) (1,26,32). Up to date, more than 250 have been identified to list as proteome components of H. pylori (4,10,18,20,21,23,29,33), revealing more intensive exploration needed to construct proteomic information of H. pylori. Actually, most spots appeared so crowded in the region of pI 4.5~8.0 that they were in- separable in 2-DE using the broad range IPG strip. There- fore, a part of spots in the region of pI 4.5~8.0 should be separated for proteomic analysis, which has been one of the bottlenecks to construct the master proteome map of H.
pylori.
Now, the narrow range IPG strips have been commer- cially available to widen the crowded region of pI 4.5~8.0.
Here, 4 kinds of narrow range IPG strips covered from pI 3.9 to 8.3 were subjected to analyze proteome components of H. pylori strain 26695. We found that the narrow range 2-DE of H. pylori whole cell protein was useful to separate close spots as well as to detect low abundant proteins resul- ting in strengthening the contents of the master proteome
map of the H. pylori.
MATRIALS AND METHODS 1. Bacterial strain and culture conditions
H. pylori strain 26695 was supplied by the H. pylori Korean Type Culture Collection (Gyeongsang National University School of Medicine, Jinju, Korea). The frozen H. pylori were thawed and grown on brucella agar plate containing 10% bovine serum, vancomycin (10 µg/ml), nalidixic acid (25 µg/ml), and amphotericin B (1 µg/ml) at 37℃ under 10% CO2 and 100% humidity. After 18 h of culture, the bacterial mass was collected, determining by microscopic observation using Gram staining that most of the cells showed a typical curved shape.
2. Two-dimensional electrophoresis and image analysis
Two-dimensional electrophoresis (2-DE) sample prepara- tion was carried out as described previously (10). Cultured cells were lysed using a buffer containing 9.5 M urea, 4%
CHAPS, and 35 mM Tris-HCl (pH 7.2). The solubilized protein samples (300 µg) were mixed with the rehydration solution (GE Healthcare Bio-Sciences AB, Uppsala, Sweden), to a final volume of 320 µl and applied to narrow range IPG strips (17 cm; pH 3.9~5.1, 4.7~5.9, 5.5~6.7, and 6.3~
8.3; Bio-Rad, Hercules, CA, USA) in a re-swelling tray (Bio-Rad). After the IPG strips were rehydrated, IEF was performed using a Protein IEF Cell (Bio-Rad) and three preset programs consisting of the first conditioning step (15 min at 250 V), the linear voltage ramping step (3 h at 10,000 V), and the maximum voltage ramping step of up to 90,000 Vh. The current did not exceed 50 µA per strip.
Following IEF, the strips were equilibrated with 0.375 M Tris buffer (pH 8.8) containing 6 M urea, 2% SDS, 20%
glycerol, 2% DTT, and 0.01% bromophenol blue. The strips were equilibrated again with the same buffer supplemented with 2.5% iodoacetamide. The second dimension SDS- PAGE was carried out overnight at 20 mA per gel using a 12.5% separating polyacrylamide gel. The resolved protein spots on the gels were visualized by silver staining and scanned using a Fluor-S MultiImager (Bio-Rad).
3. Destaining and in-gel digestion of protein spots The silver-stained spots were excised from the 2-DE
gels and transferred into microcentrifuge tubes. The spots were destained with fresh chemical reducers in a 1:1 ratio of 30 mM potassium ferricyanide and 100 mM sodium A
C D
B
Figure 1. Two-dimensional-gel electrophoresis of whole cell proteins from H. pylori strain 26695. Whole cell proteins solution was separated on a narrow range IPG strips, followed by 12.5% SDS-PAGE, and visualized by silver staining. The original gel size was 20×
18×0.15 cm. (A) pH 3.9~5.1; (B) pH 4.7~5.9; (C) pH 5.5~6.7; (D) pH 6.3~8.3.
thiosulfate, as described previously (10), with occasional mixing until the brownish color disappeared. The gel pieces were rinsed three times with distilled water to stop the reaction. Ammonium bicarbonate (500 µl of 200 mM) was added to cover the gels for 20 min and then discarded. The gel pieces were dehydrated with 100 µl of acetonitrile and dried in a vacuum centrifuge. An in-gel digestion was carried out by the method described by O'Connell and Stults (25).
Gel pieces were rehydrated by covering with digestion buffer containing trypsin (12.5 ng/ml) and incubated on ice for 45 min. The enzyme solution was replaced with 20 µl of the buffer without enzyme and incubated overnight at 37℃. The digested solutions (20 µl) were transferred into clean E-tubes and dried in a vacuum. The resulting pellets were dissolved in 2 µl of 0.1% trifluoroacetic acid (TFA).
4. Matrix assisted laser desorption ionization-time of flight-mass spectrometry (MALDI-TOF-MS)
For the matrix solution, α-cyano-4-hydroxycinnamic acid (40 mg/ml) was dissolved in 50% acetonitrile and 0.1%
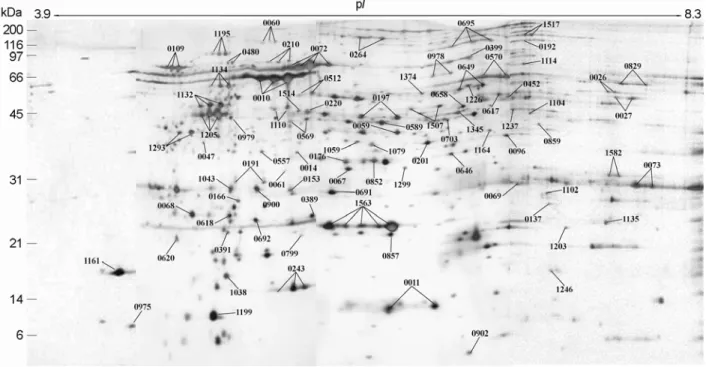
TFA. The matrix and sample solutions (2 µl each) were mixed and loaded into the target wells, rapidly dried, and washed using deionized water. The wells were dried for 10 min at room temperature and subjected to MALDITOF- Figure 2. The composite profile of the whole cell proteins of H. pylori strain 26695 resolved in the 2-DE using the narrow pH range IPG strips. The whole cell proteins of H. pylori strain 26695 was subjected to 2-DE using IPG strips of 3.9~5.1, 4.7~5.9, 5.5~6.7, and 6.3~8.3 ranges, the gels were visualized with silver staining. The 4 kinds of images were taken up and analyzed with PDQUEST software, and excluded with the overlapping zones of each right and left termini, and then combined by PHOTOSHOP software to generate the composite one ranged from pI 3.9 to pI 8.3. The marked protein spots have been identified and listed in Table 1.
Figure 3. Blow-up images of two different regions in 2-DE gels of H. pylori whole cell proteins resolved by broad (pH 3.0~10.0), intermediate (pH 5.0~8.0), narrow (pH 4.7~5.9) pH strips. Here, the narrower is the pH range of the strip, the higher resolution does the spots profile show in which the resolution and the number of spots are improved. HtpG spot appears in the gel of narrow pH strips but did not in otherwise.
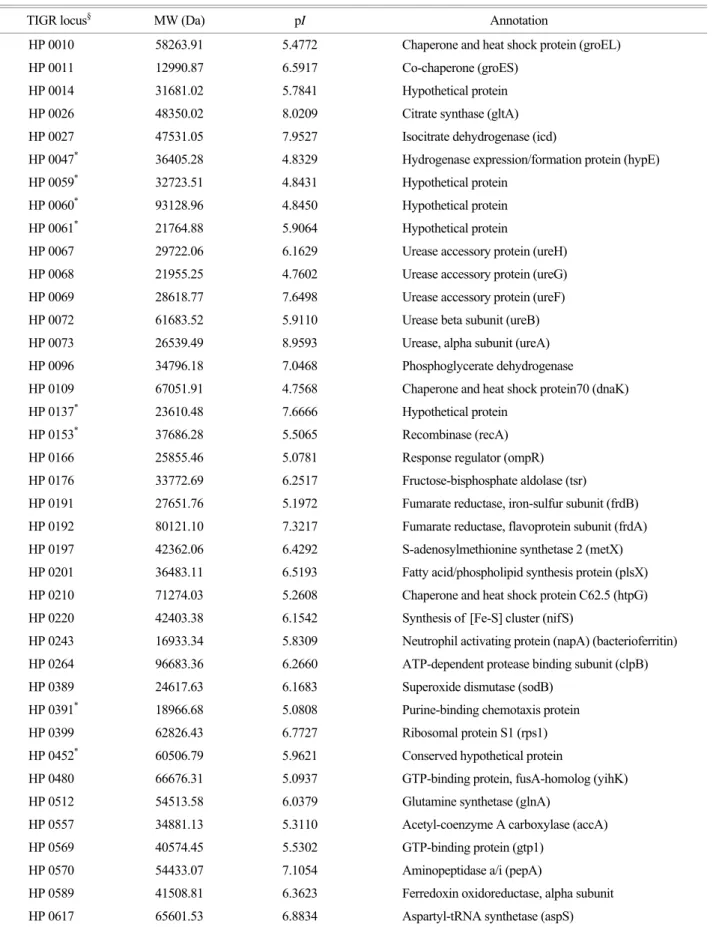
Table 1. Protein identification of spots from narrow range 2-DE gels the whole cell proteins of H. pylori strain 26695
TIGR locus§ MW (Da) pI Annotation
HP 0010 58263.91 5.4772 Chaperone and heat shock protein (groEL)
HP 0011 12990.87 6.5917 Co-chaperone (groES)
HP 0014 31681.02 5.7841 Hypothetical protein
HP 0026 48350.02 8.0209 Citrate synthase (gltA) HP 0027 47531.05 7.9527 Isocitrate dehydrogenase (icd)
HP 0047* 36405.28 4.8329 Hydrogenase expression/formation protein (hypE)
HP 0059* 32723.51 4.8431 Hypothetical protein
HP 0060* 93128.96 4.8450 Hypothetical protein
HP 0061* 21764.88 5.9064 Hypothetical protein
HP 0067 29722.06 6.1629 Urease accessory protein (ureH) HP 0068 21955.25 4.7602 Urease accessory protein (ureG) HP 0069 28618.77 7.6498 Urease accessory protein (ureF) HP 0072 61683.52 5.9110 Urease beta subunit (ureB) HP 0073 26539.49 8.9593 Urease, alpha subunit (ureA) HP 0096 34796.18 7.0468 Phosphoglycerate dehydrogenase
HP 0109 67051.91 4.7568 Chaperone and heat shock protein70 (dnaK)
HP 0137* 23610.48 7.6666 Hypothetical protein
HP 0153* 37686.28 5.5065 Recombinase (recA)
HP 0166 25855.46 5.0781 Response regulator (ompR) HP 0176 33772.69 6.2517 Fructose-bisphosphate aldolase (tsr)
HP 0191 27651.76 5.1972 Fumarate reductase, iron-sulfur subunit (frdB) HP 0192 80121.10 7.3217 Fumarate reductase, flavoprotein subunit (frdA) HP 0197 42362.06 6.4292 S-adenosylmethionine synthetase 2 (metX) HP 0201 36483.11 6.5193 Fatty acid/phospholipid synthesis protein (plsX) HP 0210 71274.03 5.2608 Chaperone and heat shock protein C62.5 (htpG) HP 0220 42403.38 6.1542 Synthesis of [Fe-S] cluster (nifS)
HP 0243 16933.34 5.8309 Neutrophil activating protein (napA) (bacterioferritin) HP 0264 96683.36 6.2660 ATP-dependent protease binding subunit (clpB) HP 0389 24617.63 6.1683 Superoxide dismutase (sodB)
HP 0391* 18966.68 5.0808 Purine-binding chemotaxis protein HP 0399 62826.43 6.7727 Ribosomal protein S1 (rps1) HP 0452* 60506.79 5.9621 Conserved hypothetical protein
HP 0480 66676.31 5.0937 GTP-binding protein, fusA-homolog (yihK) HP 0512 54513.58 6.0379 Glutamine synthetase (glnA)
HP 0557 34881.13 5.3110 Acetyl-coenzyme A carboxylase (accA) HP 0569 40574.45 5.5302 GTP-binding protein (gtp1)
HP 0570 54433.07 7.1054 Aminopeptidase a/i (pepA)
HP 0589 41508.81 6.3623 Ferredoxin oxidoreductase, alpha subunit HP 0617 65601.53 6.8834 Aspartyl-tRNA synthetase (aspS)
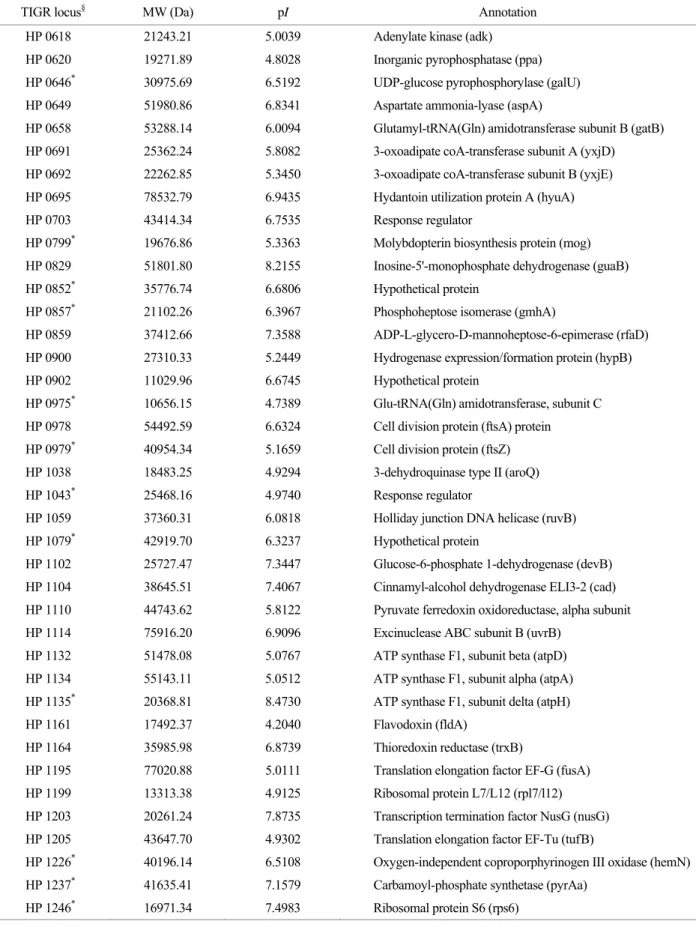
Table 1. Continued
TIGR locus§ MW (Da) pI Annotation
HP 0618 21243.21 5.0039 Adenylate kinase (adk) HP 0620 19271.89 4.8028 Inorganic pyrophosphatase (ppa)
HP 0646* 30975.69 6.5192 UDP-glucose pyrophosphorylase (galU) HP 0649 51980.86 6.8341 Aspartate ammonia-lyase (aspA)
HP 0658 53288.14 6.0094 Glutamyl-tRNA(Gln) amidotransferase subunit B (gatB) HP 0691 25362.24 5.8082 3-oxoadipate coA-transferase subunit A (yxjD) HP 0692 22262.85 5.3450 3-oxoadipate coA-transferase subunit B (yxjE) HP 0695 78532.79 6.9435 Hydantoin utilization protein A (hyuA) HP 0703 43414.34 6.7535 Response regulator
HP 0799* 19676.86 5.3363 Molybdopterin biosynthesis protein (mog) HP 0829 51801.80 8.2155 Inosine-5'-monophosphate dehydrogenase (guaB)
HP 0852* 35776.74 6.6806 Hypothetical protein
HP 0857* 21102.26 6.3967 Phosphoheptose isomerase (gmhA) HP 0859 37412.66 7.3588 ADP-L-glycero-D-mannoheptose-6-epimerase (rfaD) HP 0900 27310.33 5.2449 Hydrogenase expression/formation protein (hypB) HP 0902 11029.96 6.6745 Hypothetical protein
HP 0975* 10656.15 4.7389 Glu-tRNA(Gln) amidotransferase, subunit C HP 0978 54492.59 6.6324 Cell division protein (ftsA) protein
HP 0979* 40954.34 5.1659 Cell division protein (ftsZ) HP 1038 18483.25 4.9294 3-dehydroquinase type II (aroQ)
HP 1043* 25468.16 4.9740 Response regulator
HP 1059 37360.31 6.0818 Holliday junction DNA helicase (ruvB)
HP 1079* 42919.70 6.3237 Hypothetical protein
HP 1102 25727.47 7.3447 Glucose-6-phosphate 1-dehydrogenase (devB) HP 1104 38645.51 7.4067 Cinnamyl-alcohol dehydrogenase ELI3-2 (cad) HP 1110 44743.62 5.8122 Pyruvate ferredoxin oxidoreductase, alpha subunit HP 1114 75916.20 6.9096 Excinuclease ABC subunit B (uvrB)
HP 1132 51478.08 5.0767 ATP synthase F1, subunit beta (atpD) HP 1134 55143.11 5.0512 ATP synthase F1, subunit alpha (atpA) HP 1135* 20368.81 8.4730 ATP synthase F1, subunit delta (atpH)
HP 1161 17492.37 4.2040 Flavodoxin (fldA)
HP 1164 35985.98 6.8739 Thioredoxin reductase (trxB)
HP 1195 77020.88 5.0111 Translation elongation factor EF-G (fusA) HP 1199 13313.38 4.9125 Ribosomal protein L7/L12 (rpl7/l12) HP 1203 20261.24 7.8735 Transcription termination factor NusG (nusG) HP 1205 43647.70 4.9302 Translation elongation factor EF-Tu (tufB)
HP 1226* 40196.14 6.5108 Oxygen-independent coproporphyrinogen III oxidase (hemN) HP 1237* 41635.41 7.1579 Carbamoyl-phosphate synthetase (pyrAa)
HP 1246* 16971.34 7.4983 Ribosomal protein S6 (rps6)
MS analysis using a Voyager Biospectrometry Workstation (PE Biosystems, Foster City, CA, USA) with the following parameters: 20 kV accelerating voltage, 75% grid voltage, 0.02% guide wire voltage, 70 ns delay, and a mass gate from 800 to 3500. The peptide mass fingerprints were analyzed using the program MS-FIT of ProteinProspect developed by the UCSF Mass Spectrometry Faculty (http://prospector.
ucsf.edu). The NCBI database of Helicobacter proteins was searched to identify the proteins, using monoisotopic peptide masses and allowing a molecular mass range of 2DE±15%, a peptidemass accuracy of 50 ppm, and one partial cleavage. When matching proteins were not found, the molecular mass window was extended. Pyroglutamic acid modification of N-terminal glutamine, oxidation of methionine, and acrylamide modification of cysteine were taken into consideration.
RESULTS
1. Two-DE profiles of H. pylori proteome using narrow range IPG strips
Previous papers have described 2-DE proteome maps of H. pylori strain 26695 in which most abundant protein spots were clustered in the pI regions of pH 4.5~8.0 (10, 18). Here, the narrow range IPG strips were subjected to widen closed spots in order to get highly resolved profiles in 2-DE of whole cell proteins of H. pylori strain 26695.
The whole cell proteins solution of the strain was loaded
onto precast IPG strips (17 cm) of the narrow pH range for the first-dimensional separation. The strips were loaded onto a 12.5% acrylamide gel of 18×20 cm for the second- dimensional electrophoresis. After running SDS-PAGE, the separated spots were visualized by silver staining, as shown in Fig. 1. Each of 2-DE gels was excluded by the over- lapping regions and combined together to the composite gel (Fig. 2). Fig. 3 represented actual examples in which the narrower had the pH range of the strip, the higher resolution did the spots profile show. Therefore, the narrow range IPG strips made close spots become further apart from each other as well as weak spots hidden by strong spots appear to be independent spots.
2. Peptide mass fingerprinting and protein identifi- cation
As shown in Fig. 2, the silver-stained spots generated by 2-DE using the narrow range IPG strips were numbered, excised, destained, and followed by in-gel digestion using trypsin for peptide fingerprinting. The mass of the resul- ting peptide mixtures was measured by MALDI-TOF-MS.
Among the all represented proteins spots processed, proteins expressed by 87 genes were identified as shown in Table 1.
Of them, 64 proteins like urease beta subunit, 60 kDa chaperonin, and alkyl hydroperoxide reductase had been identified in the previous studies (4,10,18,20,21,23,29,33).
And 23 proteins that have not been reported in the previous proteome studies of H. pylori could be identified like hydro- Table 1. Continued
TIGR locus§ MW (Da) pI Annotation
HP 1293 38499.11 4.6887 DNA-directed RNA polymerase, alpha subunit (rpoA) HP 1299 27576.93 6.4208 Methionine amino peptidase (map)
HP 1345* 44771.64 6.7477 Phosphoglycerate kinase
HP 1374* 50353.20 6.4377 ATP-dependent protease ATPase subunit (clpX) HP 1507* 43904.36 6.5698 Conserved hypothetical ATP-binding protein HP 1514 44649.63 5.5915 Transcription termination factor NusA (nusA)
HP 1517 149715.58 7.5020 Type IIS restriction enzyme R and M protein (ECO57IR) HP 1563 22235.57 6.2482 Alkyl hydroperoxide reductase (tsaA)
HP 1582 29720.44 8.0532 Pyridoxal phosphate biosynthetic protein J (pdxJ)
§ Tigr loci from figure 2., * Not previously identified in references
genase expression/formation protein, purine-binding chemo- taxis protein, and ribosomal protein S6.
DISCUSSION
The 2-DE method is capable of simultaneously separating thousands of proteins in cells, tissues, or whole organisms (15,16). However, technical limitation has always been met since a lot of gene products have too similar physicoche- mical properties to separate each other in 2-DE experiment.
Several researches for exploiting proteome components of H. pylori demonstrated that most of spots were closely displayed together in the region of pH 4~8 and only part of them could be identified by protein fingerprinting. Protein identification of a given spot might be hampered by conta- mination of nearby spots. Therefore, physical separation of close spots is important to identify protein spots successfully.
Broad range 2-DE gels, which has generally used in pro- teomic researches of H. pylori, have been proved to be insufficient to construct a proteome map of H. pylori. Now, additional approaches were needed for enhancing detection of low abundance proteins and increasing the represented protein spots on the gel (30,35). Here, the narrow range pH IPG strips were applied for improving the resolution of spots profiles displayed in 2-DE. The narrow range pH IPG strips will take the increase of the number of protein spots per pH unit for grant (34). Also, 2-DE using the narrow range IPG strips was reducing overlap of close spots resul- ting in improving the purities of isolated spots to the quality enough for protein identification.
For the understanding of biomarkers involved in patho- logy, it is necessary to identify low abundant components of the proteome. Previous reports have described that the whole cell proteins of H. pylori strain 26695 has been resolved to show 1,000~1,800 spots in 2-DE and MALDI- TOF-MS peptide-fingerprinting analysis has identified about 250 genes products (4,10,18,20,21,23,29,33). However, many protein spots remained to be identified in pI 4.5~8.0 region in order to construct a master proteome map of H.
pylori. In this study, high complexity region (pI 4.5~8.0) was separated by using the narrow IPG strips (Fig. 1). As
result, the distances between spots were widened and total number of detectable spots was increased when compared with previous investigations. And with removing the overlap regions of right and left termini, images of narrow range IPG gels were combined to the composite gel by using PDQUEST and PHOTOSHOP software (Fig. 2).
Comparison of images obtained from 3~10, 5~8, and 4.7~5.9 pH strips demonstrated that the narrow range IPG strips made the distance among nearby spots widen and spots hidden by the large spots appear (Fig. 3). These results will be helpful to strengthen the purity of picked spots to the quality enough for protein identification and to find low abundant spots. Proteins expressed by 87 genes could be identified from spots displayed in the narrow range pH IPG strips, of which 23 proteins had not been reported by other investigations (Fig. 2, Table 1) (4,10,18,20,21,23,29,33).
Eight of newly identified proteins were of unknown function and 6 were associated with cellular processes and signaling, 6 with metabolism, and 3 with information storage and processing. Especially, RecA protein (HP0153) was known to be the central components of homologous recombination machinery and of the SOS system in most bacteria. The RecA protein of H. pylori has likewise been shown to be necessary for DNA repair (12). UDP-glucose pyrophosp- horylase (HP0646) catalyzes the synthesis of UDP-glucose.
UDP-glucose was known to be an essential metabolite in almost all cellular processes in living organisms and to be an essential protein for virulence in various Gram-negative bacteria (13).
In conclusion, the whole cell proteins of H. pylori strain 26695 were displayed using the narrow IPG strips and then identified by peptide fingerprints. This investigation showed that the narrow range IPG strips might contribute to streng- then the contents of master proteome map of the H. pylori reference strain.
REFERENCES
1) Alm RA, Ling LS, Moir DT, King BL, Brown ED, Doig PC, Smith DR, Noonan B, Guild BC, deJonge BL, Carmel G, Tummino PJ, Caruso A, Uria-
Nickelsen M, Mills DM, Ives C, Gibson R, Merberg D, Mills SD, Jiang Q, Taylor DE, Vovis GF, Trust TJ:
Genomic-sequence comparison of two unrelated isolates of the human gastric pathogen Helicobacter pylori. Nature 14: 176-180, 1999.
2) Backert S, Kwok T, Schmid M, Selbach M, Moese S, Peek RM Jr, Konig W, Meyer TF, Jungblut PR:
Subproteomes of soluble and structure-bound Helico- bacter pylori proteins analyzed by two-dimensional gel electrophoresis and mass spectrometry. Proteomics 5:
1331-1345, 2005.
3) Baik SC, Kim JB, Cho MJ, Kim YC, Park CG, Rhou HH, Choi HJ, Rhee KH: Prevalence of Helico- bacter pylori infection among normal Korean adults. J Korean Soc Microbiol 6: 455-462, 1990.
4) Baik SC, Kim KM, Song SM, Kim DS, Jun JS, Lee SG, Song JY, Park JU, Kang HL, Lee WK, Cho MJ, Youn HS, Ko GH, Rhee KH: Proteomic analysis of the sarcosine-insoluble outer membrane fraction of Helicobacter pylori strain 26695. J Bacteriol 186: 949- 955, 2004.
5) Baik SC, Yoon HS, Chung MH, Lee WK, Cho MJ, Ko KH, Park CK, Kasai H, Rhee KH: Increased oxidative DNA damage Helicobacter pylori-infected human gastric mucosa. Cancer Res 56: 1279-1282, 1996.
6) Banatvala NK, Mayo K, Megraud F, Jennings R, Deeks JJ, Feldman RA: The cohort effect and Helico- bacter pylori. J Infect Dis 168: 219-221, 1993.
7) Blaser MJ: Gastric Campylobacter-like organisms gastritis and peptic ulcer disease. Gastroenterology 97:
371-383, 1987.
8) Blaser MJ: Helicobacter pylori and gastric diseases.
Br Med J 316: 1507-1510, 1998.
9) Cash P: Proteomics in medical microbiology. Electro- phoresis 21: 1187-1201, 2000.
10) Cho MJ, Jeon BS, Park JW, Jung TS, Song JY, Lee WK, Choi YJ, Choi SH, Park SG, Park JU, Choe MY, Jung SA, Byun EY, Baik SC, Youn HS, Ko GH, Lim D, Rhee KH: Identifying the major proteome components of Helicobacter pylori strain 26695. Elec- trophoresis 23: 1161-1173, 2002.
11) Dunn BE, Cohen H, Blaser MJ: Helicobacter pylori.
Clin Microbiol Rev 10: 720-741, 1997.
12) Fischer W, Haas R: The RecA protein of Helicobacter pylori requires a posttranslational modification for full activity. J Bacteriol 186: 777-784, 2004.
13) Forman D, Newell DG, Fullerton F, Yarnel JW, Stacey AR, Wald N, Sitas F: Association between infection with Helicobacter pylori and risk of gastric cancer: evidence from a prospective investigation. Br Med J 302: 1302-1305, 1991.
14) Gharahdaghi F, Weinberg CR, Maagher DA, Imai BS, Mische SM: Mass spectrometric identification of proteins from silver-stained polyacrylamide gel: a method for the removal of silver ions to enhance sensitivity. Electrophoresis 20: 601-605, 1999.
15) Görg A, Obermaier C, Boguth G, Harder A, Scheibe B, Wildgruber R, Weiss W: The current state of two- dimensional electrophoresis with immobilized pH gradients. Electrophoresis 21: 1037-1053, 2000.
16) Görg A, Obermaier C, Boguth G, Weiss W: Recent developments in two-dimensional gel electrophoresis with immobilized pH gradients: wide pH gradients up to pH 12, longer separation distances and simplified procedures. Electrophoresis 20: 712-717, 1999.
17) Humphery-Smith I, Cordwell SJ, Blackstock WP:
Proteome research: complementarity and limitations with respect to the RNA and DNA worlds. Electro- phoresis 18: 1217-1242, 1997.
18) Jungblut PR, Bumann D, Haas G, Zimmy-Arndt U, Holland P, Lamer S, Siejak F, Aebischer A, Meyer TF: Comparative proteome analysis of Helicobacter pylori. Mol Microbiol 36: 710-725, 2000.
19) Kim H, Wu CA, Kim DY, Han YH, Ha SC, Kim CS, Suh SW, Kim KK: Crystallization and preliminary X-ray crystallographic study of UDP-glucose pyropho- sphorylase (UGPase) from Helicobacter pylori. Acta Crystallogr D Biol Crystallogr 60: 1447-1449, 2004.
20) Lee HW, Choe YH, Kim DK, Jung SY, Lee NG:
Proteomic analysis of a ferric uptake regulator mutant of Helicobacter pylori: regulation of Helicobacter pylori gene expression by ferric uptake regulator and iron. Proteomics 4: 2014-2027, 2004.
21) Lock RA, Cordwell SJ, Coombs GW, Walsh BJ, Forbes GM: Proteome analysis of Helicobacter pylori:
major proteins of type strain NCTC11637. Pathol 33:
365-374, 2001.
22) Marshall BJ, Warren JR: Unidentified curved bacilli in the stomach of patients with gastritis and peptic ulceration. Lancet 16: 1311-115, 1984.
23) McAtee CP, Hoffman PS, Berg DE: Identification of differentially regulated proteins in metronidozole resis- tant Helicobacter pylori by proteome techniques. Pro- teomics 1: 516-521, 2001.
24) Nomura A, Stemmermann GN, Chyou PH, Kato I, Perez-Perez GI, Blaser J: Helicobacter pylori infection and gastric carcinoma among Japanese Americans in Hawaii. N Engl J Med 325: 1132-1136, 1991.
25) O'Connell KL, Stults JT: Identification of mouse liver proteins on two-dimensional electrophoresis gels by matrix-assisted laser desorption/ionization mass spectro- metry of in situ enzymatic digests. Electrophoresis 18:
349-359, 1997
26) Oh JD, Kling-Bäckhed H, Giannakis M, Xu J, Fulton RS, Fulton LA, Cordum HS, Wang C, Elliott G, Edwards J, Mardis ER, Engstrand LG, Gordon JI:
The complete genome sequence of a chronic atrophic gastritis Helicobacter pylori strain: evolution during disease progression. Proc Natl Acad Sci U S A 103:
9999-10004, 2006.
27) Parsonnet J, Hansen S, Rodriguez L, Gelb AB, Warnke RA, Jellum E, Orentreich N, Vogelman JH, Friedman GD: Helicobacter pylori infection and lymphoma. N Engl J Med 330: 1132-1136, 1994.
28) Peterson W: Helicobacter pylori and peptic ulcer disease. N Engl J Med 324: 1043-1048, 1991.
29) Proteome 2D-PAGE database (http://www.mpiib-berlin.
mpg.de/2D-PAGE/).
30) Quadroni M, James P: Proteomics and automation.
Electrophoresis 20: 664-677, 1999.
31) Rhee KH, Yoon HS, Baik SC, Lee WK, Cho MJ, Choi HJ, Maeng KY, Ko KW: Prevalence of Helico- bacter pylori infection among normal Koreans. J Korean Soc Microbiol 6: 475-490, 1990.
32) Tomb JF, White O, Kerlavage AR, Clayton RA, Sutton GG, Fleischmann RD, Ketchum KA, Klenk HP, Gill S, Dougherty BA, Nelson K, Quackenbush J, Zhou L, Kirkness EF, Peterson S, Loftus B, Richardson D, Dodson R, Khalak HG, Glodek A, McKenney K, Fitzegerald LM, Lee N, Adams MD, Hickey EK, Berg DE, Gocayne JD, Utterback TR, Peterson JD, Kelley JM, Cotton MD, Weidman JM, Fujii C, Bowman C, Watthey L, Wallin E, Hayes WS, Borodovsky M, Karp PD, Smith HO, Fraser CM, Venter JC: The complete genome sequence of the gastric pathogen Helicobacter pylori. Nature 7:
539-547, 1997.
33) Uwins C, Deitrich C, Argo E, Stewart E, Davidson I, Cash P: Growth-induced changes in the proteome of Helicobacter pylori. Electrophoresis 27: 1136-1146, 2006.
34) Wildgruber R, Harder A, Obermaier C, Boguth G, Weiss W, Fey SJ, Larsen PM, Görg A: Towards higher resolution: two-dimensional electrophoresis of Saccharomyces cerevisiae proteins using overlapping narrow immobilized pH gradients. Electrophoresis 21:
2610-2616, 2000.
35) Williams KL: Genomes and proteomes: towards a multidimensional view of biology. Electrophoresis 20:
678-688, 1999.