Copyright © 2015 The Korean Society for Bone and Mineral Research
This is an Open Access article distributed under the terms of the Creative Commons Attribution Non-Commercial Li- cense (http://creativecommons.org/licenses/by-nc/3.0/) which permits unrestricted non-commercial use, distribu- tion, and reproduction in any medium, provided the original work is properly cited.
Comparison of Calcium Intake Status by Region and Socioeconomic Status in Korea: The 2011-2013 Korea National Health and Nutrition Examination Survey
Hee-Sook Lim1,2, Yoon-Hyung Park1, Hae-Hyeog Lee4, Tae-Hee Kim4*, Soon-Kyung Kim3*
1Department of Preventive Medicine, Soonchunhyang University College of Medicine, Cheonan;
2Department of Nutrition, Soonchunhyang University Bucheon Hospital, Bucheon;
3Department of Food Sciences & Nutrition, Soonchunhyang University, Asan;
4Department of Obstetrics and Gynecology, Soonchunhyang University College of Medicine, Bucheon, Korea
Background: Calcium is an essential element nutrient in our body, and insufficient calci- um intake is very common in Korean. Socioeconomic status (SES) is known to be associ- ated with quality of diet and health. The purpose of this study was to compare between calcium intake by region and SES. Methods: This study used data from a nationally rep- resented sample of Koreans (n=19,249) from 2011 to 2013 Korea National Health and Nutrition Examination Survey. We were divided into six regions: Seoul and Gyeonggi-do, Gangwon-do, Chungcheong-do, Jeolla-do, Gyeongsang-do, and Jeju-do. Daily calcium intake and dietary quality based on 24 hr recall data was calculated and analyzed by the sex, age, SES. Results: The regions with the highest calcium intakes in both males and females were Seoul and Gyeonggi-do. The age groups with a significant difference in calcium intake, nutrient adequacy ratio, and nutrient density by region were 14 to 19, 20 to 29, and ≥65 years. Calcium intake and dietary quality were lowest in the low house- hold income group. In terms of being a recipient of the dietary life supply, the calcium intake and dietary quality of the recipient group was low. Conclusions: We found that daily calcium intake was very different by region and was significantly lower in region with lower SES. The findings of this study suggest social inequalities in calcium intake by region can be address ed in the development and implementation of tailored nutritional interventions to promote calcium nutritional status of Koreans.
Key Words: Calcium, Diet, Socioeconomic factors
INTRODUCTION
Calcium is the most abundant mineral in the body, and the calcium content of the adult human body takes for about 1.5% to 2.0% of the body weight.[1] Calci- um is the most notable nutrient related to bone health and plays important roles in muscle contraction, nerve transmission, regulation of cell membrane permea- bility, and blood clotting.[2,3] Insufficient calcium intake may lead to osteoporo- sis,[4] hypertension, stroke,[5] or premenstrual syndrome.[6] However, insufficient calcium intake has been very common in Korea and other countries. According to the 2013 Korea National Health and Nutrition Examination Survey (KNHANES), Corresponding author: Soon-Kyung Kim
Department of Food Sciences & Nutrition, Soonchunhyang University,
22 Soonchunhyang-ro, Sinchang-myeon, Asan 31538, Korea
Tel: +82-41-530-1261, Fax +82-41-530-1264 E-mail: [email protected]
Corresponding author: Tae-Hee Kim Department of Obstetrics and Gynecology, Soonchunhyang University Bucheon Hospital, 170 Jomaru-ro, Wonmi-gu, Bucheon 14584, Korea
Tel: +82-32-621-5380, Fax: +82-2-6008-6874 E-mail: [email protected]
* Tae-Hee Kim and Soon-Kyung Kim contributed equally to this work and should be considered co-corresponding authors.
Received: July 17, 2015 Revised: August 8, 2015 Accepted: August 9, 2015
No potential conflict of interest relevant to this article was reported.
This work was supported by the Soonchunhyang University Research Fund.
the calcium intake of adults in Korea was found to reach only 70% of the recommended calcium intake for adults, and only 17.8% of the population was found to consume calcium at adequate levels. In addition, calcium intake was shown to be lower in elderly persons aged 65 years or old- er, young persons aged 12 to 18 years, and in females.[7]
The 12 major food sources of calcium are milk, anchovy, kimchi, tofu, radish leaves, sea mustard, yogurt, eggs, green onions, soybeans, bread, and sesame, accounting for 50%
of the total calcium intake.[8]
The results of the National Health and Nutrition Exami- nation Survey (NHANES) in the United States indicated that there was a severe deficiency of calcium intake among fe- male youths and preschool children from low-income fami- lies, which has been raised as a nutritional issue.[9] The di- etary pattern or nutrient intake is known to be greatly af- fected by socioeconomic factors.[10] High socioeconomic status (SES) was also associated with higher fruit and/or vegetable consumption, diet quality, and diversity.[10]; that food insecurity and dietary quality were related to income;
and that food insecurity was expected to increase the risk of chronic diseases.[11]
The status of nutrient intake of Koreans has been report- ed by KNHANES, which was examined by sex, age, and re- gion; however, studies of nutrient intakes and their quali- tative assessment by region of the country are lacking. In this regard, this study was done to compare the intake of calcium as one of major minerals, and its qualitative assess- ment, by region; to examine the differences depending on SES by using the original data of KNHANES; and thus to pro- vide basic data that can be used to resolve nutritional im- balance by region.
METHODS
1. SubjectThis study was conducted by using raw data of the 2011 to 2013 KNHANES. The total number of subjects were 24,594, from whom children under 7 years of age (n=1,885) and subjects with missing calcium and energy intakes (n=2,579) as well as those with missing answers to all the variables used in this study (n=881) were excluded. A total of 19,249 subjects were included in the final analysis. In the original data, the survey area was divided into 17 cities and prov- inces, and the analysis data were presented in big cities,
small- and medium-sized cities, and eup-myeon areas (or rural areas). In this study, for regional comparisons, the coun- try area was divided into six regions: Seoul and Gyeonggi- do (Seoul, Gyeonggi, Incheon), Gangwon-do (Gangwon), Chungcheong-do (Daejeon, Chungbuk, and Chungnam), Jeolla-do (Gwangju, Jeonbuk, and Jeonnam), Gyeongsang- do (Busan, Daegu, Ulsan, Gyeongbuk, and Gyeongnam), and Jeju-do.
2. Description of the parameter
The subvariables used in this study were referred to the KNHANES User’s Guide and were set by using items of its health screening survey and nutrition survey sections. The variables used for the analysis of subjects were sex, age (actual age: 8 to 13, 14 to 19, 20 to 29, 30 to 49, 50 to 64, and 65 years or older), household income (low, middle- low, middle-high, and high), and being recipients of the national basic livelihood security supply and dietary life supply.
3. Calcium intake and dietary quality
Data on calcium intake amount was analyzed using the 24-hr recall method. The nutrient adequacy ratio (NAR) was calculated to assess the appropriateness of calcium intake.
Nutrient density (ND) was calculated by standardizing the calcium intake per 1,000 kcal based on the individual’s in- take amount.[12]
NAR of calcium=calcium intake of an individual/recom- mended dietary allowance (RDA) of calcium
ND of calcium=calcium intake of an individual/1,000 kcal 4. Statistical analysis
The mean and standard deviation (SD) were calculated using SPSS software program ver. 18.0 (SPSS Inc., Chicago, IL, USA). All data were reported as mean±SD or as num- bers and percentages. Groups comparisons used Chi-square tests for qualitative variables and two-way analysis of vari- ance (ANOVA) for quantitative variables. In this study, there were no interaction effect between region and general characteristics for measurement values related to calcium intake. Thus, one-way ANOVA was conducted for region and general characteristics, respectively. If there seemed to be a significant differences, post hoc comparison was applied by Bonferroni's method. A two-tailed P-value of
less than 0.05 was considered statistically significant. All statistical analyses were performed using R 3.1.3 version freely available on the web (http://cran.r-project.org/) and SPSS (version 18.0; SPSS Inc., Chicago, IL, USA).
RESULTS
1. Distribution of study population
With regard to the distribution of the total subjects, there were 43.4% males and 56.6% females, showing a higher female ratio in all six regions. The age distribution was as follows: 9.4% elementary school students, 7.8% youths, 8.1% in their 20s, 28.4% in their 30 to 40s, 23.1% in their aged between 50 and 64 years and 23.2% aged 65 years or older; the ratio of elderly people aged 65 years or older was higher in Gangwon-do and Jeju-do than in the other re- gions. In terms of household income quartile, the region with the highest proportion of low household income was Gangwon-do (26.9%). The proportion of recipients of the national livelihood security supply was 3.4% of the total subjects. The region with the highest proportion of recipi-
ents of the national livelihood supply was Gyeongsang-do (5.3%), whereas the regions with the lowest proportions were Seoul and Gyeonggi-do (2.2%). The proportion of re- cipients of the national dietary life supply was 3.5% on av- erage. The region with the highest proportion of recipients of the national dietary life supply was Gangwon-do (5.0%), whereas the region with the lowest proportion was Jeju-do (1.4%) (Table 1).
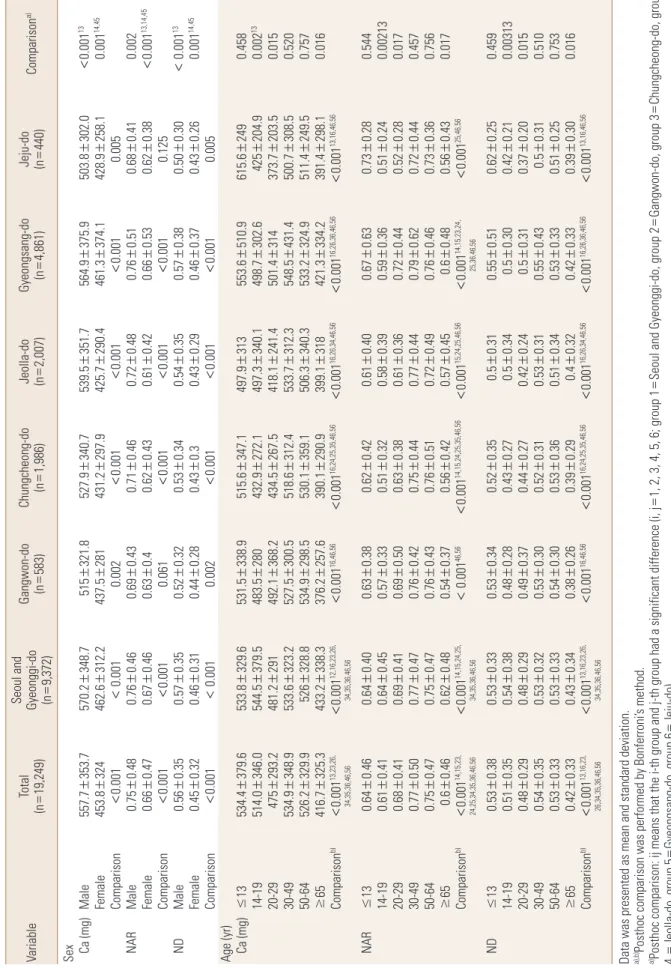
2. Comparison of calcium intake status by the age and sex
Calcium intake and its quality assessment by sex and age are shown in Table 2. The regions with the highest cal- cium intakes in both males and females were Seoul and Gyeonggi. The NAR of calcium showed similar results; how- ever, the ND of calcium in both sexes was highest in Gyeong- sang-do. The NAR of calcium was <0.7 in all age groups except for those in their 30s to 40s and those aged 50 to 64 years, and was 0.61 in youths aged 14 to 19 years (i.e., the lowest NAR). The age groups with a significant difference in calcium intake, NAR, and ND by region were 14 to 19, 20 Table 1. Regional distribution
Variable Total
(n=19,249)
Seoul and Gyeonggi-do
(n=9,372)
Gangwon-do (n=583)
Chung- cheong-do (n=1,986)
Jeolla-do (n=2,007)
Gyeongsang- (n=4,861)do
Jeju-do
(n=440) Comparisona) Sex Male
Female 8,350 (43.4)
10,899 (56.6) 4,015 (42.8)
5,357 (57.2) 265 (45.5)
318 (54.5) 901 (45.4)
1,085 (54.6) 871 (43.4)
1,136 (56.6) 2,093 (43.1)
2,768 (56.9) 205 (46.6) 235 (53.4)
0.194
Age (yr) ≤13 14-19 20-29 30-49 50-64 ≥65
1,817 (9.4) 1,496 (7.8) 1,565 (8.1) 5,461 (28.4) 4,441 (23.1) 4,469 (23.2)
950 (10.1) 796 (8.5) 879 (9.4) 2,920 (31.2) 2,027 (21.6) 1,800 (19.2)
45 (7.7) 33 (5.7) 53 (9.1) 137 (23.5) 119 (20.4) 196 (33.6)
177 (8.9) 156 (7.9) 134 (6.7) 523 (26.3) 476 (24.0) 520 (26.2)
185 (9.2) 146 (7.3) 127 (6.3) 496 (24.7) 473 (23.6) 580 (28.9)
429 (8.8) 329 (6.8) 344 (7.1) 1,279 (26.3) 1,241 (25.5) 1,239 (25.5)
31 (7.0) 36 (8.2) 28 (6.4) 106 (24.1) 105 (23.8) 134 (30.5)
<0.00112,13,14,15,16,23,25
Income Low Middle-low Middle-high High
3,617 (18.8) 5,145 (26.7) 5,212 (27.1) 5,275 (27.4)
1,393 (14.9) 2,527 (27.0) 2,654 (28.2) 2,798 (29.9)
157 (26.9) 176 (30.2) 134 (23.0) 116 (19.9)
429 (21.6) 557 (28.1) 521 (26.2) 479 (24.1)
485 (24.2) 590 (29.4) 461 (23.0) 471 (23.4)
1,075 (22.1) 1,189 (24.5) 1,330 (27.3) 1,267 (26.1)
78 (17.7) 106 (24.1) 112 (25.5) 144 (32.7)
<0.00112,13,14,15,25,26,36,45,46
NBLSS Yes
No 657 (3.4)
18,592 (96.6) 205 (2.2)
9,167 (97.8) 27 (4.6)
556 (95.4) 73 (3.7)
1,913 (96.3) 79 (3.9)
1,928 (96.1) 260 (5.3)
4,601 (94.7) 13 (3.0) 427 (97.0)
<0.00112,13,14,15
NDLS Yes
No 674 (3.5)
18,575 (96.5) 292 (3.1)
9,080 (96.9) 29 (5.0)
554 (95.0) 83 (4.2)
1,903 (95.8) 66 (3.3)
1,941 (96.7) 198 (4.1)
4,663 (95.9) 6 (1.4) 434 (98.6)
0.00126
Data was presented as frequency and percentage.
a)Posthoc comparison was performed by Bonferroni's method, Posthoc comparison: ij means that the i-th group and j-th group had a significant difference (i, j=1, 2, 3, 4, 5, 6; group 1=Seoul and Gyeonggi-do, group 2=Gangwon-do, group 3=Chungcheong-do, group 4=Jeolla-do, group 5=Gyeongsang-do, group 6=Jeju-do).
NBLSS, national basic livelihood security supply; NDLS, national dietary life supply; yr, year.
Table 2. Comparison of calcium intake status by the age and sex VariableTotal (n=19,249)Seoul and Gyeonggi-do (n
=9,372)Gangwon-do (n=583)Chungcheong-do (n=1,986)
Jeolla-do (nGyeongsang-do =2,007)(n=4,861)
Jeju-do (na) Comparison 440)= Sex 13527.90.001302.0503.8564.9351.7539.5340.7375.9321.8353.7Ca (mg)515348.7Male570.2557.7±<±±±±±± 14,45281461.3290.4425.7297.9258.1431.2453.80.001437.5312.2462.6324Female374.1428.9±±±±±±± 0.0010.0050.001<<0.001< 0.001<0.001<Comparison0.002 0.760.72±0.48±±0.510.680.41±0.460.0020.710.480.43NAR0.75±Male0.76±0.460.69± 13,14,450.620.0010.380.530.660.420.610.430.620.40.670.660.47Female0.630.46±±±±±<±± 0.1250.0010.0010.0010.0610.0010.001Comparison<<<<< 130.380.350.57±0.540.50±0.30< 0.001±0.560.340.57±Male±0.35ND±0.52±0.320.350.53 14,45±0.290.460.260.370.43±0.0010.43±0.440.3±0.430.28±0.31±0.460.32±0.45Female 0.0010.0050.0010.001 0.0010.002Comparison0.001<<<<< Age (yr) ±±313553.60.458510.9615.6±249347.1497.9±515.6379.6Ca (mg)13534.4±≤533.8329.6531.5±338.9± 13302.6±498.7±0.002425±204.9272.1497.3340.1±±432.9514.0±544.5346.0379.5483.5±14-19280 368.2241.4418.1267.5373.7434.50.015492.1291203.5481.2293.231447520-29501.4±±±±±±± 300.5312.3500.7533.7312.4431.4518.6323.2527.5308.5533.6348.90.520534.930-49548.5±±±±±±± 359.10.757249.5±511.4324.9±533.2340.3506.3±±52650-64530.1±329.9526.2±328.8534.9±298.5 ±0.016298.1±391.4334.2±421.3318399.1290.9±390.1325.3≥65416.7±257.6433.2±338.3376.2± 16,24,25,35,46,5612,16,23,26, 16,26,34,46,5616,26,36,46,5613,23,26, b)16,46,5613,16,46,560.0010.0010.0010.0010.0010.001Comparison0.001<<<<<<< 34,35,36,46,5634,35,36,46,56 0.5440.380.730.630.670.400.610.420.620.280.640.400.63NAR0.640.4613±±≤±±±±± 0.320.002130.24±0.510.36±0.590.39±0.580.33±0.640.510.61±0.4114-19±0.450.57± 0.380.0170.28±0.520.44±0.720.36±0.61±±0.690.680.630.41±±0.410.6920-290.50 0.4570.440.720.620.790.440.770.440.750.420.5030-490.760.470.770.77±±±±±±± 0.7560.360.730.460.760.760.720.510.490.430.7550-640.470.750.470.76±±±±±±± ±±0.450.60.0170.480.56±0.430.420.570.48±0.56≥650.6±0.460.62±0.54±0.37 14,15,24,25, 25,46,5614,15,23,24, 15,24,25,46,5646,5614,15,24,25,35,46,5614,15,23, b)<0.001Comparison0.001<0.001<<0.001<0.001< 0.001<0.001 25,36,46,5634,35,36,46,5624,25,34,35,36,46,56 0.310.350.50.4590.550.510.620.250.520.34130.530.330.53ND0.530.38≤±±±±±±± 0.280.340.300.50.270.420.430.510.480.380.210.540.350.0031314-190.5±±±±±±± 0.270.0150.20±0.370.31±0.50.240.42±±0.4820-290.44±0.290.48±0.290.49±0.37 0.310.5100.31±0.50.43±0.550.31±0.53±±0.5330-490.520.350.54±0.320.53±0.30 0.530.7530.250.510.330.530.340.510.360.530.300.5350-640.540.330.33±±±±±±± 0.390.0160.300.390.330.420.320.40.290.380.260.43650.330.420.34±±±±±±±≥ 13,16,46,5613,16,23,26, 16,26,36,46,5616,26,34,46,5616,24,25,35,46,5616,46,56b)13,16,23, 0.0010.001Comparison0.001<<0.001<<0.001<0.001<0.001< 26,34,35,36,46,5634,35,36,46,56 Data was presented as mean and standard deviation. a),b)Posthoc comparison was performed by Bonferroni’s method. a)and 4, 5, 6; group 2, Seoul group Gyeonggi-do, 2Gangwon-do, group 3Chungcheong-do, group 3, 11, and Posthoc comparison: ij means that the i-th group j-th group had a significant difference (i, j==== Gyeongsang-do, group 6Jeju-do).Jeolla-do, group 54 === b), group 2, group 30-49 yr20-29 yr; group 4, group 314-19 yr13 yr1, 2, 3, 4, 5, 6; group 1Posthoc comparison: ij means that the i-th group and j-th group had a significant difference (i, jage =====≤ 550-64 yr, group 665 yr).==≥ NAR, nutrient adequacy ratio; ND, nutrient density; yr, year.
Table 3. Comparison of calcium intake status by the socioeconomic status VariableTotal (n=19,249)Seoul and Gyeonggi-do (n
=9,372)Gangwon-do (n=583)Chungcheong-do (n=1,986)
Jeolla-do (nGyeongsang-do =2,007)(n=4,861)
Jeju-do (na)Comparison 440)= Income 423.8382.1±285.5261.5332.0341.3±±0.002255.6±380.3300.3266.9Ca (mg)Low±408.6422.5±296.2373.9± 13490.5268.4316.0482.1281.5269.4444.9309.90.042462310490.4483.2Middle-low327.0471.8±±±±±±± 377.40.608296.8±473298.2±520.5331.6±501.4520.8±Middle-high522±329.5517.9±334.9514.8±337.5 327.90.286271.7±517501.4±574.7340.9536.2±±314.5±574356.9±556.7390.3±557.3High543.9 all12,13,14,24,3412,13,14,23,2412,13,14,2412,13,14,2412,13,14allb)0.0010.0010.0010.0010.001Comparison0.0010.001<<<<<<< ±0.0010.37±0.470.47±0.600.40.540.36±0.530.42NAR0.360.57±Low0.59±0.410.53± 130.400.0450.37±0.660.46±0.690.450.68±±0.680.62Middle-low0.670.44±±0.430.64±0.37 0.470.460.660.690.520.720.6070.720.460.400.720.460.410.72Middle-high0.72±±±±±±± 0.2710.390.46±0.720.69±0.800.47±0.74±±0.42±0.790.49±0.770.540.77High0.76 12,13,14,24,3412,13,1413,14,24allb)all12,13,1412,13,14,23,24<0.0010.001<<0.0010.001<0.001<0.001<0.001<Comparison 0.370.290.340.380.260.380.270.300.300.260.420.330.0020.41LowND0.42±±±±±±± 13 0.280.0420.27±0.470.33±0.49±0.480.32±0.490.450.48±0.31Middle-low±0.310.46±0.27 0.6110.30±0.470.30±0.520.33±0.50.38±0.520.33Middle-high0.52±0.340.520.340.52±± 0.310.2780.270.520.500.580.540.540.340.330.560.570.560.39High0.36±±±±±±± 12,13,14,23,2412,13,14b)all12,13,14,24,34all12,13,14,2412,13,14,24 <0.001<0.0010.0010.001<0.001Comparison<<<0.001<0.001 NBLSS 171.90.223230.1395.4263.7388.7268.2425.4244.1407403.9301.7Ca (mg)Ye428.2299.6271.6s±±±±±±± 13,14,35,450.001283.0465.9382.7512.5325.3477.1323.9477.6305510.5No502.3342.9481.1333.1±±±±±<±± 0.0660.3750.001<0.1640.002<0.001<Comparison0.001 0.430.370.580.350.510.570.260.290.590.420.3710.380.56sYeNAR0.540.37±±±±±±± 13,14,35,450.420.720.450.670.450.390.660.460.670.530.0010.710.480.70No0.65<±±±±±±± 0.0760.2240.001<0.0950.0040.001<0.001<Comparison 0.170.2210.230.390.260.390.270.430.240.410.270.30.40Ye0.30s0.43ND±±±±±±± 13,14,35,450.480.0010.280.470.380.510.330.480.320.30.34No0.480.510.330.51<±±±±±±± 0.0650.3660.001<0.1660.0010.0020.001<Comparison< NDLS 246.70.068151.9210.3239.5381.8258270405.9404.4Ye410.9326.3Ca (mg)348.9443.7286.5s±±±±±±± 13,14,450.001477.5281.5±467.3382.2±511.2325.1±<323.4342.5±No502.1±510.8±332.6479.2±303.9478.1 0.0450.026<0.0710.0010.0240.001<Comparison0.001 0.480.340.310.530.380.550.340.240.1570.420.590.380.55sYeNAR0.330.52±±±±±±± 13,14,35,450.670.001<0.39±0.650.53±0.710.45±0.480.450.670.42±0.670.46±0.71±0.70No± 0.0210.037<0.0150.0010.018<0.001<Comparison0.001 0.350.260.240.410.270.210.410.250.440.330.150.290.0680.41sYeND0.38±±±±±±± 13,14,35,450.380.330.51±<0.47±0.280.480.001±0.32±0.480.3±0.480.33±0.510.34±0.50No 0.0720.0260.001<<0.0460.024Comparison0.0010.001 Data was presented as mean and standard deviation. a),b)Posthoc comparison was performed by Bonferroni’s method. a)4, and 5, 6; group 1Seoul group Gyeonggi-do, group 2Gangwon-do, 3Chungcheong-do, group 2, 3, i-th 1, and j=Posthoc comparison: ij means that the group j-th group had a significant difference (i, === Gyeongsang-do, group 6Jeju-do).4 Jeolla-do, group 5=== b)middle-high, group 4, group 3middle-lowhigh); all means low income, group 21, 2, 3, 4; group 1Posthoc comparison: ij means that the i-th group and j-th group had a significant difference (i, j=====
that all pairs of groups had a significant difference. NAR, nutrient adequacy ratio; ND, nutrient density; yr
, year; NBLSS, national basic livelihood security supply; NDLS, national dietary life supply.
to 29, and ≥65 years. The age group with the lowest NAR was 14 to 19 years in Chungcheong-do and Jeju-do, and the age group with the lowest ND was 20 to 29 years in Je- ju-do (Table 2).
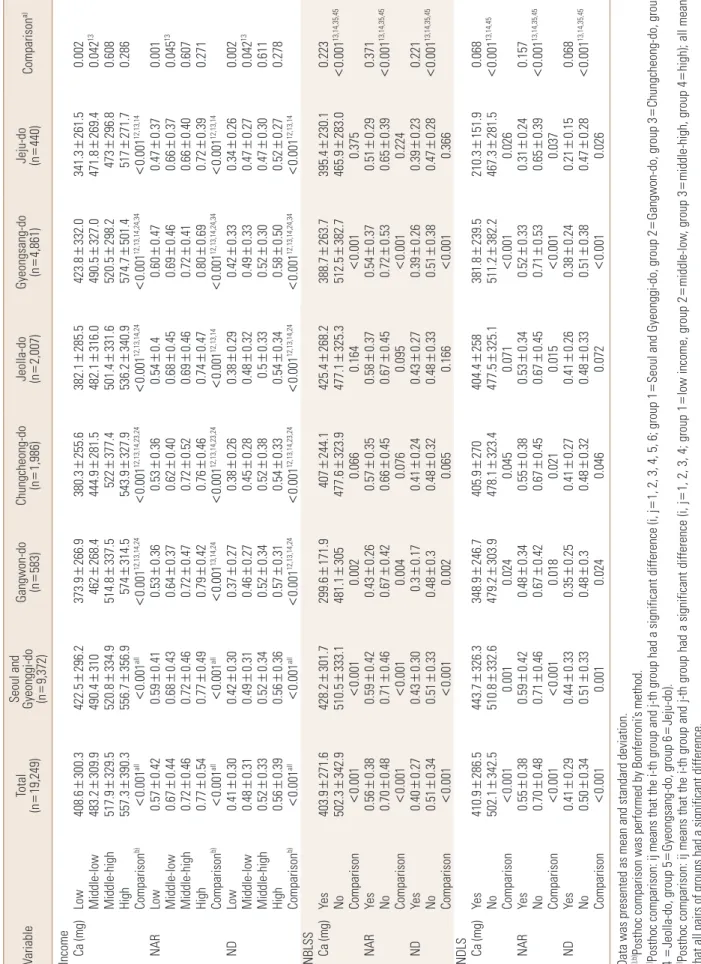
3. Comparison of calcium intake status by the SES
In terms of household income, calcium intake and dietary quality of calcium were lowest in the low household income group; however, as the household income increased, the calcium intake or dietary quality of calcium also tended to increase. The low household income group in Jeju-do show- ed the lowest NAR and ND, whereas the high household income group in Gyeongsang-do showed the highest NAR and ND. When analyzed in terms of the national basic live- lihood security supply, the recipient groups showed no sig- nificant difference in calcium intake and dietary quality by region. However, in the case of the recipients of the basic livelihood security supply in Gangwon-do, the average cal- cium intake was very low (299.6 mg). In terms of being a recipient of the dietary life supply, the calcium intake and dietary quality of calcium in the recipient group was low.
The average calcium intake of such recipient group in Jeju- do was 210.3 mg, the lowest among all intakes by variable;
moreover, their NAR was also very low (0.31; Table 3).
4. Comparison of the lowest calcium intake status by region
The lowest calcium intake variables and the calcium in- takes ratio versus the recommended calcium intake by re- gion are presented in Figure 1. The average age of subjects with the lowest calcium intake variables was 61.6±5.3 years, and the ratio of average calcium intake to the recommend- ed calcium intake was shown to be 48.7%. The calcium in- takes were shown to be lowest in the low household in- come groups for Seoul and Gyeonggi-do, Chungcheong- do, and Jeolla-do, in the basic livelihood security supply recipient group for Gangwon-do, and in the dietary life supply recipient groups for Gyeongsang-do and Jeolla-do (Fig. 1).
DISCUSSION
Calcium intake is very important from the nutritional perspective. In some recent studies, the lack of adequate calcium intake of children and young adults, rather than middle-aged persons, has been pointed out as an issue.
[13] In fact, as an inadequate calcium intake of infants and children may result in insufficient calcification of bone there- by delaying normal growth and leading to the early onset of osteoporosis in later adulthood, the importance of suffi- cient calcium intake is highly emphasized.[14] In the Unit- ed States, a diet habit change initiative designed to increase the calcium intake of American people has been driven at the national level.[15] The age group of 20 to 29 years among the subjects of this study had a low average calcium intake, whereas the age group of 14 to 19 years had a low NAR, showing a difference. Both age groups showed significant differences in calcium intake and NAR by region. These re- sults were similar to the calcium intake reported by Choi et al.,[16] and were consistent with the results of a study by Chung,[17] showing that the rate of insufficient calcium intake was highest in youths aged 12 to 19 years. It is nec- essary to develop practical measures to increase the calci- um intake of adolescents, who have the highest calcium requirements, in view of the fact that the calcium intake of adolescents remains insufficient.
A balanced diet is related to the intake of a variety of foods and to dietary quality. As the diversity of diet is in- Fig. 1. Factors showed the lowest calcium intake by region. *Calcium
intake. †Calcium intakes ratio vs. the Korean recommended calcium allowance. NBLSS, national basic livelihood security supply; NDLS, national dietary life supply.
Gangwon-do
Gyeongsang-do NBLSS [Yes]
(299.7 mg) (43%) Income [Low]
(422.5 mg)*
(59%)†
Income [Low]
(380.3 mg) (53%) Chungcheong-do
Seoul and Gyeonggi-do
NDLS [Yes]
(381.8 mg) (52%) Income [Low]
(382.1 mg) (54%)
NDLS [Yes]
(210.4 mg) (31%) Jeju-do Jeolla-do
creased, the quality of nutrition may also increase. There- fore, the quality of diet that influences the nutritional sta- tus may need to be evaluated according to economic con- ditions. Kim [18] reported that the most important factor affecting Koreans’ food nutrient intake patterns was found to be monthly household income and educational level.
The socioeconomic factors used in this study included house- hold income, and being recipients of the national basic livelihood security supply and national dietary life supply;
it was found that the calcium intake by income level ob- served in this study was lower compared with the results of a study by Moon and Kim.[19] The national basic liveli- hood security scheme is a public aid system and is a social safety net in which a salary set by the relevant law is paid to applicants whose household income does not meet the minimum cost of living.[20] The dietary life supply program is somewhat a duplicate of the basic livelihood security scheme with regard to the baseline conditions. The recipi- ents of the two government-operated systems were found to have a lower calcium intake than nonrecipients, and the calcium intake of the subjects in this study was found to be lower when compared with 421 mg, the calcium intake of the scheme recipients resulting from a survey conduct- ed by the Korea Rural Economic Institute.[21] The percent- age of individuals who were undernourished among the recipients of the basic livelihood security supply was 28.7%.
Although food expenses accounted for the highest propor- tion of the living expenses paid to the recipients, the prob- lem of undernourishment remains unresolved because the actual form of benefit provision is consolidated and money for food is being spent for other uses. According to a report by the Korea Rural Economic Institute,[21] the calcium in- take of the recipients of the basic livelihood security sup- ply was severely lacking at only 53.7% of the recommend- ed amount, and their intake levels of meat and milk were low. While the major source of calcium is milk and dairy products, previous reports have indicated that lower in- come levels are associated with a significantly lower intake of dairy products in Koreans.[22] This study found that the calcium intake rate in the recipients of the basic livelihood security supply was approximately 56%, still showing no improvement. Interestingly, recipients of non-basic liveli- hood security supply showed significant differences by re- gion, which is presumed to be affected by demographic factors including age and household number. Therefore,
diverse nutrition support systems may need to be selec- tively operated.
This study has limitations. First, sex or age factors were not adjusted in comparisons depending on economic level by region. In addition, this study was done to assess a sin- gle nutrient rather than being a comprehensive nutrient assessment, and not to thoroughly investigate the preva- lence of diseases associated with excessive or deficient cal- cium intake. However, in conclusion, it was found that the calcium intake of Korean people was still insufficient com- pared with the recommended calcium intake, and the cal- cium intake of young adults, elderly people, and those in the low-income bracket was markedly low. Moreover, there were great deviations in calcium intakes by region. It is thou- ght that selective and aggressive nutrition support policy should be devised for nutritionally vulnerable groups by region, and that continuous and diverse studies are required.
REFERENCES
1. Metz JA, Anderson JJ, Gallagher PN Jr. Intakes of calcium, phosphorus, and protein, and physical-activity level are related to radial bone mass in young adult women. Am J Clin Nutr 1993;58:537-42.
2. Suleiman S, Nelson M, Li F, et al. Effect of calcium intake and physical activity level on bone mass and turnover in healthy, white, postmenopausal women. Am J Clin Nutr 1997;66:937-43.
3. Kraft MD. Phosphorus and calcium: a review for the adult nutrition support clinician. Nutr Clin Pract 2015;30:21-33.
4. Bryant RJ, Cadogan J, Weaver CM. The new dietary refer- ence intakes for calcium: implications for osteoporosis. J Am Coll Nutr 1999;18:406s-12s.
5. Kris-Etherton PM, Grieger JA, Hilpert KF, et al. Milk prod- ucts, dietary patterns and blood pressure management. J Am Coll Nutr 2009;28 Suppl 1:103s-19s.
6. Thys-Jacobs S. Micronutrients and the premenstrual syn- drome: the case for calcium. J Am Coll Nutr 2000;19:220-7.
7. Ministry of Health & Welfare and Family Affairs, Korea Cen- ter for Disease Control & Prevention. Korea health statis- tics 2013: Korea national health and nutrition examina- tion survey (KNHANES VI-1). Seoul: Ministry of Health &
Welfare; 2014.
8. Koo SM, Seo DG, Park YJ, et al. Association between con- sumption of milk and dairy products, calcium and ribofla-
vin, and periodontitis in Korean adults: using the 2007- 2010 Korea National Health and Nutrition Examination Surveys. J Nutr Health 2014;47:258-67.
9. Nitzan Kaluski D, Basch CE, Zybert P, et al. Calcium intake in preschool children--a study of dietary patterns in a low socioeconomic community. Public Health Rev 2001;29:71- 83.
10. Mayén AL, Marques-Vidal P, Paccaud F, et al. Socioecono- mic determinants of dietary patterns in low- and middle- income countries: a systematic review. Am J Clin Nutr 2014;
100:1520-31.
11. Mark S, Lambert M, O'Loughlin J, et al. Household income, food insecurity and nutrition in Canadian youth. Can J Pub- lic Health 2012;103:94-9.
12. Lim H, Cho G, Kim S. Evaluation of nutrient intake and diet quality of gastric cancer patients in Korea. Nutr Res Pract 2012;6:213-20.
13. Han JS, Kim JH. Calcium intake and cognition on calcium of adolescents in Busan area. J Korean Soc Food Sci Nutr 2002;31:1026-34.
14. Kim TY, Kim HS. Comparison of calcium intake status among elementary students by participation in the school milk program. J Korean Soc Food Cult 2009;24:106-15.
15. Leung CW, Ding EL, Catalano PJ, et al. Dietary intake and dietary quality of low-income adults in the Supplemental Nutrition Assistance Program. Am J Clin Nutr 2012;96:977-
88.
16. Choi MK, Sung CJ, Kim MH. Relation among calcium in- take, bone metabolism parameters, serum protein and lipids of female college students in Chungnam. J Korean Diet Assoc 2000;6:108-16.
17. Chung CE. Ready-to-eat cereal consumption enhances milk and calcium Intake in Korean population from 2001 Korean national health and nutrition survey. Korean J Nutr 2006;39:786-94.
18. Kim Y. Food and nutrient consumption patterns of Korean adults by socioeconomic status. Korean J Community Nutr 2001;6:645-56.
19. Moon HK, Kim EG. Nutrient intake patterns of Koreans by the economic status using 1998 Korean national health and nutrition survey. Korean J Nutr 2003;36:1061-70.
20. Oh SY, Hong MJ. Food insecurity is associated with dietary intake and body size of Korean children from low-income families in urban areas. Eur J Clin Nutr 2003;57:1598-604.
21. Lee KI, Hwang YJ, Lee DS, et al. Strategic approach toward vitalizing food assistance programs. Seoul: Korea Rural Economic Institute; 2012.
22. Lee HJ, Cho JI, Lee HS, et al. Intakes of dairy products and calcium and obesity in Korean adults: Korean National Heal- th and Nutrition Examination Surveys (KNHANES) 2007- 2009. PLoS One 2014;9:e99085.