INTRODUCTION
Fatigue is “a persistent, subjective sense of tiredness related to cancer or cancer treatment that interferes with usual func- tioning” [1]. This is one of the most frequent symptoms of cancer [2]; some studies report prevalence rates of 70% to 100% of cancer patients affected by cancer-related fatigue [3-6]. About 30% of cancer survivors report fatigue even years after the treatment [7,8]. Cancer-related fatigue often remains undetected by
health professionals, and physicians often under estimate its prevalence and impact [9].
Though the importance of fatigue is generally accepted, little is known about the patterns of fatigue over the course of treatment. Singer et al. [10] report a general increase of fatigue during the hospital stay (from admission to discharge) and thereafter a decrease over the next half-year, with very similar patterns for women suffering from breast, ovaries, cervix, endometrium, and vulva cancer. Even if studies report changes of mean values during and after treatment, those studies generally do not report the frequencies of individual patterns or the temporal stability of the fatigue assessments. Furthermore, only few studies compared the fatigue scores of cancer patients with adjusted reference values from the general population.
There are numerous questionnaires available for measur-
The course of fatigue in patients with gynecologic and breast cancer
Marie Vollrath1, Markus Zenger1, Susanne Singer2, Jens Einenkel3, Andreas Hinz1
1Department of Medical Psychology and Medical Sociology, University of Leipzig, Leipzig; 2Institute of Medical Biometry, Epidemiology and Informatics, University of Mainz, Mainz; 3Department of Gynecology and Obstetrics, University of Leipzig, Leipzig, Germany
Received Mar 26, 2013, Revised Apr 23, 2013, Accepted May 3, 2013 Correspondence to Andreas Hinz
Department of Medical Psychology and Medical Sociology, University of Leipzig, Philipp-Rosenthal-Street 55, 04103 Leipzig, Germany. Tel: +49-341- 9718820, Fax: +49-341-9718809, E-mail: [email protected]
Objective: The objective of this study is to examine the course of fatigue in female cancer patients during the first months after treatment.
Methods: We examined a sample of 110 patients suffering from gynecological or breast cancer. Fatigue was assessed with two questionnaires, the Multidimensional Fatigue Inventory (MFI) and the fatigue scale of the quality of life questionnaire European Organisation for Research and Treatment of Cancer (EORTC QLQ-C30). Participants were tested during their stay in the hospital (t1), two weeks after discharge (t2), and three months after discharge (t3).
Results: Fatigue in the patients’ sample was markedly higher than the general population reference values. At t1, the effect sizes are d=0.81 (MFI) and d=1.21 (EORTC QLQ-C30 fatigue scale). Age and tumor stage had no significant influence on fatigue, but patients with a long time since diagnosis had higher fatigue levels than patients with a shorter time since diagnosis. From t1 to t3, fatigue mean scores decreased. The correlations between the t1 and the t3 fatigue scores were weak, with correlation coefficients of only about 0.30.
Conclusion: Though the mean scores of fatigue, averaged across all patients, decreased over the first three months, the individual courses could not be predicted from the t1 score.
Keywords: Change, Fatigue, Psychological wellbeing, Psycho-oncology, Quality of life
ing fatigue. A recent systematic review [11] identified and compared 40 of these that are specific to cancer-related fatigue. Among the most often used instruments are the Multidimensional Fatigue Inventory (MFI) [12] and the fatigue scale of the quality of life questionnaire European Organisa- tion for Research and Treatment of Cancer (EORTC QLQ-C30) [13]. In this study, we used and compared both of these. The aims of this study were 1) to describe the course of fatigue in cancer patients suffering from breast cancer and gynecologi- cal cancer, 2) to identify factors that predict fatigue, 3) to assess the relationship between the two fatigue scales (MFI and EORTC QLQ-C30 fatigue scale), and 4) to determine the temporal stability of fatigue.
MATERIALS AND METHODS 1. Sample of cancer patients
Between September 2007 and November 2008, a sample of 215 patients treated for gynecological and breast cancer was examined in the Department of Gynecology and Obstetrics at a major German university. Criteria for inclusion were: mini- mum age of 18 years, histologically proven carcinoma, and sufficient command of the German language. Information on potential study participants was obtained from the hospital’
s internal electronic registration system. Trained interviewers introduced the potential participants to the objectives of the study and asked them to give informed consent. The examina- tion included three time points: during the patients’ hospital stay (t1), two weeks after discharge (t2), and three months (t3) after discharge from hospital. The t2 and t3 examinations were conducted by mail. The most frequent cancer types in this examination were: cervix uteri (n=49), breast (n=19), and ovary (n=16). Further details are given in Table 1. In this study there was no management strategy for fatigue in the protocol.
The treatment and the psychosocial support was as usual. The study was approved by the Ethics Committee of the Leipzig University.
2. Sample of the general population
In order to compare the mean values of the patients with mean scores derived from the general population, we selected a subsample of women with a nearly equal age distribution who had taken part in a representative survey, conducted in 1998. The sample size of this subsample was n=968, with a mean age of 53.8 years. Normative data from the total sample (n=2,037) are already published for the MFI [14] and for the fatigue scale of the EORTC QLQ-C30 [15].
3. Questionnaires
Sociodemographic and cancer-related parameters were obtained, and the following questionnaires were adopted.
1) Multidimensional Fatigue Inventory
The MFI was developed to assess fatigue in cancer patients
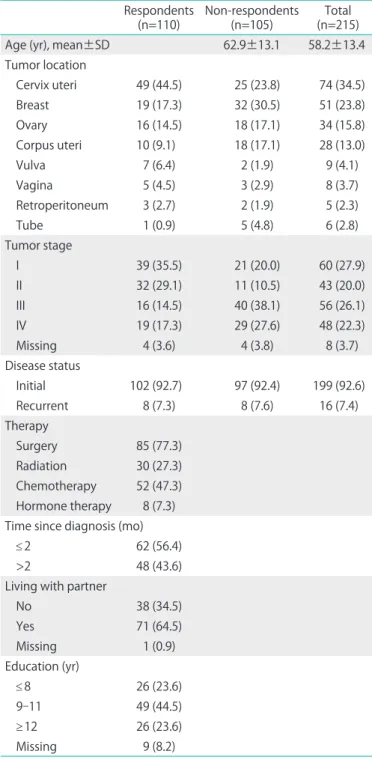
Table 1. Sociodemographic and cancer related characteristics of the study population
Respondents
(n=110) Non-respondents
(n=105) Total
(n=215)
Age (yr), mean±SD 62.9±13.1 58.2±13.4
Tumor location
Cervix uteri 49 (44.5) 25 (23.8) 74 (34.5)
Breast 19 (17.3) 32 (30.5) 51 (23.8)
Ovary 16 (14.5) 18 (17.1) 34 (15.8)
Corpus uteri 10 (9.1) 18 (17.1) 28 (13.0)
Vulva 7 (6.4) 2 (1.9) 9 (4.1)
Vagina 5 (4.5) 3 (2.9) 8 (3.7)
Retroperitoneum 3 (2.7) 2 (1.9) 5 (2.3)
Tube 1 (0.9) 5 (4.8) 6 (2.8)
Tumor stage
I 39 (35.5) 21 (20.0) 60 (27.9)
II 32 (29.1) 11 (10.5) 43 (20.0)
III 16 (14.5) 40 (38.1) 56 (26.1)
IV 19 (17.3) 29 (27.6) 48 (22.3)
Missing 4 (3.6) 4 (3.8) 8 (3.7)
Disease status
Initial 102 (92.7) 97 (92.4) 199 (92.6)
Recurrent 8 (7.3) 8 (7.6) 16 (7.4)
Therapy
Surgery 85 (77.3) Radiation 30 (27.3) Chemotherapy 52 (47.3) Hormone therapy 8 (7.3) Time since diagnosis (mo)
≤2 62 (56.4)
>2 48 (43.6)
Living with partner
No 38 (34.5)
Yes 71 (64.5)
Missing 1 (0.9)
Education (yr)
≤8 26 (23.6)
9-11 49 (44.5)
≥12 26 (23.6)
Missing 9 (8.2)
[12] and has good psychometric properties [16,17]. It includes the subscales general fatigue, physical fatigue, mental fatigue, reduced motivation, and reduced activity. Each subscale consists of four items with five possible answers. The resulting scores are within the range from 4 to 20. Although the original test authors did not explicitly recommend summarizing the five subscales to arrive at a total score, doing this is useful for reliably assessing general fatigue levels [18]. In this study, we used the cut-off 57+ for the description of high levels of fatigue [18]. According to previous papers on MFI cut-offs, this cut-off falls at the 75th percentile [10,19]. The German version of the MFI was validated in a large sample of cancer patients [10].
2) EORTC QLQ-C30
The fatigue scale of the 30-item EORTC QLQ-C30 [13] con- sists of three items, each with four answer options. One item example is the question “Were you tired?,” with the possible answers “not at all,” “a little,” “quite a bit,” and “very much”. All scales of the EORTC QLQ-C30 are linearly transformed to reach the scale range 0-100.
In addition to the instruments measuring fatigue, we also used the following questionnaires: the Hospital Anxiety and Depression Scale (HADS) [20], the Life Orientation Test (LOT-R) [21], the quality of life instrument SF-8 [22], and the life satisfaction questionnaire (FLZ) [23].
4. Data analysis
Effect sizes d were calculated according to Cohen [24] to assess group mean differences between patients and controls (general population). Significance tests of the group differ-
ences were performed with t-tests. Pearson correlations were used to express the association among the fatigue scales and between fatigue scales at different time points. Statistics were calculated with PWSW ver. 18 (SPSS Inc., Chicago, IL, USA).
RESULTS
Sociodemographic and clinical data of the sample are presented in Table 1. Data from 110 patients, 51% of the potentially eligible 215 patients, were available at t1. At the following time points, this number changed to 96 (t2) and 104 (t3) (Fig. 1).
1. The course of fatigue from t1 to t3
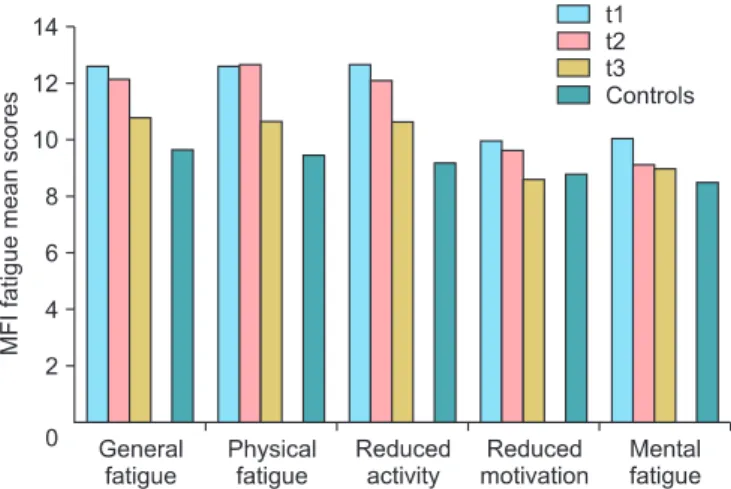
Fatigue mean scores are given in Table 2. Measured with the MFI, fatigue diminishes from t1 to t3, but the mean values of the patients remain higher than the mean score of the general population. Fig. 1 illustrates that the decline is similar for all five subscales of the MFI. Measured with the fatigue scale of the EORTC QLQ-C30, there is a small increase from t1 to t2, fol- lowed by a decline at t3. As with the MFI, the patients’ mean scores, even at t3, remain higher than those of the general population. All mean score differences between the patients and the controls are statistically significant with p<0.001. The effect sizes of the differences between the patients and the control group (CG) are as follows: MFI total score: d (patients- t1, CG)=0.81; d (patients-t2, CG)=0.71; d (patients-t3, CG)=0.33;
the corresponding effect sizes of the EORTC fatigue subscale are: d (patients-t1, CG)=1.21; d (patients-t2, CG)=1.36, and d (patients-t3, CG)=1.06.
Since the sample comprised multiple tumor locations, we also calculated fatigue mean scores for the largest homog- enous subsample (patients with cervix uteri cancer, n=49). The mean scores for t1, t2 and t3 were as follows: 59.6, 56.2, and 50.3 (MFI sum score) and 53.1, 53.7 and 47.7 (EORTC QLQ-C30 fatigue mean score).
Fig. 1. Multidimensional Fatigue Inventory (MFI) fatigue mean scores for patients and controls (general population). t1, stay at hospital; t2, two weeks after discharge; t3, three months after discharge.
Table 2. Mean values of the MFI (total score) and the fatigue scale of the EORTC QLQ-C30
Variable, mean±SD
Patients
Controls
t1 t2 t3
MFI sum score 57.2±17.0 55.5±16.1 49.3±16.5 43.8±16.5 EORTC fatigue 48.9±33.0 52.5±23.4 45.5±25.3 20.7±23.4 EORTC QLQ-C30, fatigue scale of the quality of life questionnaire Eu- ropean Organisation for Research and Treatment of Cancer; MFI, Mul- tidimensional Fatigue Inventory; t1, stay at hospital; t2, two wk after discharge; t3, three mo after discharge.
2. The influence of age, tumor stage, and time since diagnosis on fatigue
Age has no significant influence on fatigue in the patient sample. Younger women report slightly more fatigue on all scales of the MFI and the EORTC QLQ-C30, but none of these differences reach the 5% significance level.
Tumor stage does not significantly affect fatigue either. The mean scores of stages 1 and 2 are slightly (non-significantly) lower than those of stages 3 and 4.
Time since diagnosis is related to fatigue in the following way. If the time since diagnosis is long (>2 months), the fatigue scores of reduced activity and reduced motivation are significantly higher than in patients with a shorter time since diagnosis.
Since there were only eight patients with recurrent tumors, we only report their fatigue mean values (for t1, t2, and t3, respectively) without statistical analysis: 54.1, 55.2, and 48.6 (MFI sum score) and 50.0, 50.0, and 42.9 (EORTC QLQ-C30 fatigue mean score) (Table 3).
3. Correlations among the fatigue scales
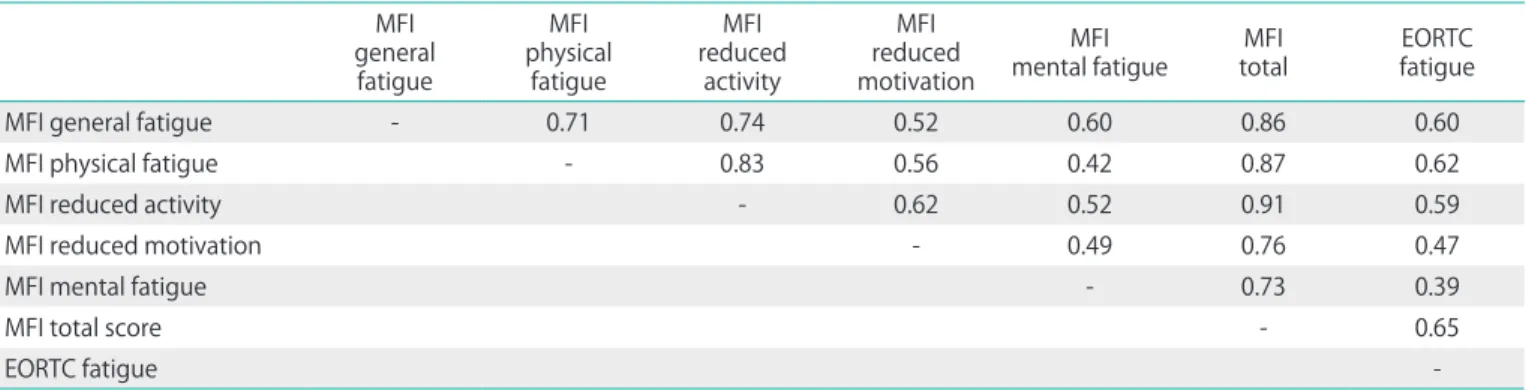
Table 4 shows that all subscales of the MFI are positively interrelated, with correlation coefficients between 0.42 and 0.83. The association between the EORTC fatigue scale and the MFI total score is high (r=0.65). All correlations in Table 4 are statistically significant with p<0.01.
4. Relationship between fatigue and other psychological scales
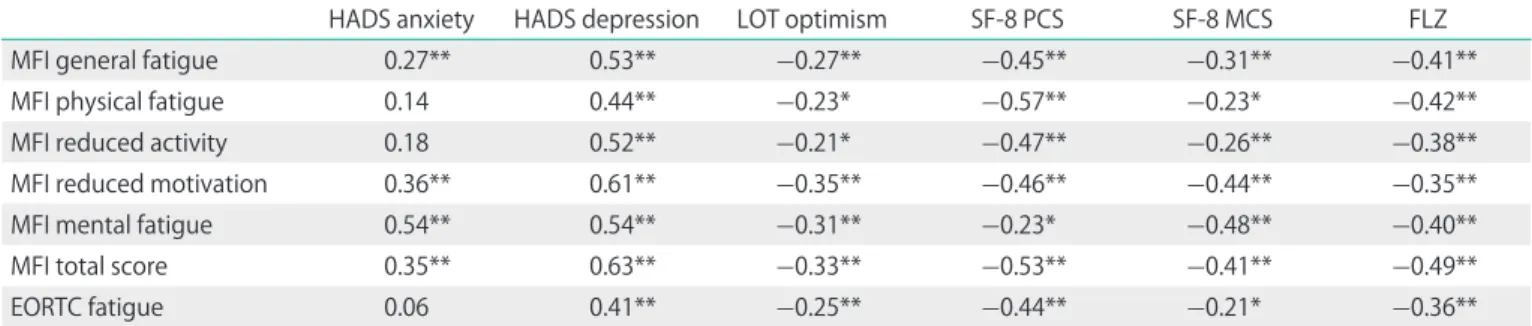
Among the questionnaires used in this study, depression (HADS) is most strongly associated with fatigue; the relation- ship is highest for the MFI total score (Table 5). Fatigue is associated with the physical component PCS of the FS-8 more strongly than with the mental component MCS.
5. Temporal stability of the fatigue scales and changes of individual fatigue levels
The correlations between t1 and t3 (3 month interval) are about 0.30 for the MFI total score and the EORTC fatigue
Table 3. Fatigue mean scores (t1). Differences with regard to age, tumor stage, and time since diagnosis
Age (yr) Stage Time since diagnosis (mo)
<54 ≥54 p-value I-II III-IV p-value ≤2 >2 p-value
MFI general fatigue 12.7 11.9 0.380 11.7 13.2 0.066 11.8 12.9 0.178
MFI physical fatigue 12.8 12.2 0.460 12.2 12.9 0.490 11.8 13.2 0.099
MFI reduced activity 13.1 12.2 0.291 12.3 13.0 0.469 11.8 13.5 0.039*
MFI reduced motivation 10.1 9.7 0.646 10.0 9.6 0.532 9.1 10.8 0.023*
MFI mental fatigue 10.7 9.3 0.087 10.0 9.7 0.656 10.0 10.1 0.921
MFI total score 59.4 55.1 0.242 56.0 58.4 0.578 54.3 60.7 0.061
EORTC fatigue 53.5 44.2 0.151 44.0 56.5 0.072 44.3 54.9 0.096
EORTC, European Organisation for Research and Treatment of Cancer; MFI, Multidimensional Fatigue Inventory.
*p<0.05.
Table 4. Correlations among the fatigue scales at t1 generalMFI
fatigue
physical MFI fatigue
reduced MFI activity
reduced MFI motivation
mental fatigueMFI MFI
total EORTC
fatigue
MFI general fatigue - 0.71 0.74 0.52 0.60 0.86 0.60
MFI physical fatigue - 0.83 0.56 0.42 0.87 0.62
MFI reduced activity - 0.62 0.52 0.91 0.59
MFI reduced motivation - 0.49 0.76 0.47
MFI mental fatigue - 0.73 0.39
MFI total score - 0.65
EORTC fatigue -
All correlation coefficients are statistically significant with p<0.01.
EORTC, European Organisation for Research and Treatment of Cancer; MFI, Multidimensional Fatigue Inventory.
score, corresponding to 9% explained variance (Table 6). The correlations are higher between adjacent time points (t1-t2 and t2-t3), the highest coefficients appearing between t2 and t3 (all r coefficients greater than 0.5).
When the temporal stability was described in terms of changes between the dichotomous MFI fatigue categories, the following frequencies were obtained. Of the patients who participated both at t1 and t3 (n=98), 51 had no fatigue at t1. The majority of these (34 patients, 67%) remained in this category and 17 patients (33%) reported fatigue at t3. Of the 47 patients categorized as fatigued at t1, 23 patients (49%) remained fatigued, and 24 patients (51%) no longer reported fatigue at t3. That is, 42% of the patients changed their fatigue category from t1 to t3. The corresponding percentages from adjacent time points were 37% (t1 to t2) and 28% (t2 to t3).
Since there are no cut-offs for the EORTC QLQ-C30 fatigue scale, such frequencies cannot be calculated for this scale.
DISCUSSION
Cancer patients’ mean fatigue levels are high. Both question-
naires, the MFI and the Fatigue scale of the EORTC QLQ-C30, confirmed that at t1, during the patients’ hospital stay, the fatigue level was about one standard deviation higher than the levels of the general population. The MFI mean score at t1 (M=57.2) is nearly identical to the cutoff (57), indicating that almost every other patient suffers from fatigue according to this criterion. This result is similar to those obtained in other studies [10,19].
Since the MFI comprises five scales, it is possible to detect the fatigue domains most responsible for this high fatigue level. Fig. 1 shows that the differences between the patients and the controls are large for the physical facets of fatigue (general fatigue, physical fatigue and reduced activity), while the mental facets (reduced motivation and mental fatigue) are less affected. Lower fatigue levels are found three months after hospital discharge. This is in contrast to the results of a recent study [25] that found an increase of fatigue with time. This difference may be due to the higher percentage of patients receiving chemotherapy and radiotherapy in the latter examination.
Tumor stage had no statistically significant influence on fatigue, though patients with stages III and IV showed slightly Table 5. Correlations between fatigue scales and other constructs
HADS anxiety HADS depression LOT optimism SF-8 PCS SF-8 MCS FLZ
MFI general fatigue 0.27** 0.53** -0.27** -0.45** -0.31** -0.41**
MFI physical fatigue 0.14 0.44** -0.23* -0.57** -0.23* -0.42**
MFI reduced activity 0.18 0.52** -0.21* -0.47** -0.26** -0.38**
MFI reduced motivation 0.36** 0.61** -0.35** -0.46** -0.44** -0.35**
MFI mental fatigue 0.54** 0.54** -0.31** -0.23* -0.48** -0.40**
MFI total score 0.35** 0.63** -0.33** -0.53** -0.41** -0.49**
EORTC fatigue 0.06 0.41** -0.25** -0.44** -0.21* -0.36**
EORTC, European Organisation for Research and Treatment of Cancer; FLZ, questions on life satisfaction; HADS, Hospital Anxiety and Depression Scale; LOT, Life Orientation Test; MCS, mental component summary; MFI, Multidimensional Fatigue Inventory; PCS, physical component summary.
*p<0.05, **p<0.01.
Table 6. Temporal stability of the fatigue scales
t1-t2 t1-t3 t2-t3
r p-value r p-value r p-value
MFI general fatigue 0.40 <0.001 0.34 <0.001 0.54 <0.001
MFI physical fatigue 0.27 0.011 0.24 0.017 0.60 <0.001
MFI reduced activity 0.20 0.057 0.15 0.131 0.60 <0.001
MFI reduced motivation 0.41 <0.001 0.40 <0.001 0.64 <0.001
MFI mental fatigue 0.41 <0.001 0.41 <0.001 0.63 <0.001
MFI total score 0.39 <0.001 0.30 0.005 0.67 <0.001
EORTC fatigue 0.46 <0.001 0.29 0.005 0.55 <0.001
EORTC, European Organisation for Research and Treatment of Cancer; MFI, Multidimensional Fatigue Inventory; t1, stay at hospital; t2, two weeks after discharge; t3, three months after discharge.
higher mean scores than patients with stage I or II in most fatigue dimensions. Unfortunately, the sample sizes were too small for more detailed analyses. A study with cancer survivors [19] also failed to detect statistically significant relationships between tumor stage and fatigue (measured with the MFI), while in a larger sample Singer et al. [10] found highest fatigue scores (MFI general fatigue scale) for patients with stage IV, followed by stage I. The eight patients with recurrent disease in our study had similar fatigue levels as the patients with initial diseases, but statistical conclusions cannot be derived from this small sample.
The decline of fatigue over the course of the examination was more pronounced when fatigue was measured with the MFI than with EORTC QLQ-C30. It remains uncertain what the reasons for this are, but one should be aware that the results could vary from one fatigue assessment instrument to the next. The correlation between the two fatigue scales, MFI sum score and the Fatigue scale of the EORTC QLQ-C30, is r=0.65;
the corresponding r2=0.42 indicating that one instrument explains less than 50% of the variance of the other question- naire. From a psychometric view, one might assume that the 20-item instrument MFI has better psychometric properties than the 3-item instrument EORTC QLQ-C30 Fatigue scale.
The correlations with the other questionnaires, given in Table 5, indicate a higher convergent validity of the MFI sum score, but the criterion validity, the ability to distinguish between cancer patients and the general population (Table 2), is similar for both questionnaires.
The most important result of the study was the low associa- tion between the fatigue scores at the different time points.
While Fig. 1 might suggest that the fatigue decline over the three months interval is valid for each patient, the low correla- tions between the t1 and the t3 values prove that it is nearly impossible to predict t3 fatigue value based on the t1 values obtained in the hospital. Both fatigue questionnaires show a correlation r (t1, t3) of about 0.30, indicating that less than 10% (r2=0.09) of the t3 variance is explained by the t1 value.
The similarity of the correlations (0.29 and 0.30) for the two questionnaires indicates a certain degree of generalizability of this result. About every third patient who was not fatigued at t1 (MFI≤57) reaches the fatigue criterion (57+) at t3. On the other hand, every second patient characterized as not fatigued at t1 will move into the other category by t3.
The association between t2 and t3, however, is much stron- ger, with correlations in the range of 0.6. That means, that it is better to predict the fatigue level of three months later with that of two weeks after discharge. Fatigue levels appear to be more fluid in the 14 days immediately following hospital discharge than they are in the 10 weeks after that. It is difficult
to compare this result with other studies since most studies only report mean score changes, which do not even hint at the amount of change experienced at the individual level.
Some limitations of this study should be mentioned. Not all patients filled in the questionnaire at t1, t2, and t3. If we had restricted our analysis to those patients with complete data sets, patients with a bad prognosis would have had a lower chance of being included in the sample. This would have led to a bias towards over-optimistic evaluations of the fatigue levels. For comparisons between both questionnaires and correlations with other questionnaires, it was useful to include all available patients. Furthermore, in our sample patients with very high fatigue levels may be underrepresented. We assume that the fatigue mean score would be even higher if all eligible patients had taken part. The cut-off value used in this study may be a matter of debate. Therefore, the comparison between patients and the general population was performed on the basis of mean scores.
Which fatigue scale can be recommended? Both scales used in this paper were of similar psychometric quality. Recently, an EORTC research group developed a new 13-item fatigue questionnaire that can be used in combination with the EORTC QLQ-C30 [26]. However, it is also helpful to have nor- mative data for the fatigue instruments to assess the global burden of fatigue in patient groups. For the EORTC QLQ-C30, a difference of 10 is often assumed to be clinically important [27]; the difference between the patients’ values at t1 and the mean score of the general population (diff=28.2) is nearly three times the value of this threshold.
Physicians should be aware that their impression of the patients’ fatigue state in the hospital is not a sufficient basis for making a prognosis about how fatigued they will feel in a three months time.
CONFLICT OF INTEREST
No potential conflict of interest relevant to this article was reported.
REFERENCES
1. Mock V, Atkinson A, Barsevick A, Cella D, Cimprich B, Cleeland C, et al. NCCN Practice Guidelines for Cancer-Related Fatigue.
Oncology (Williston Park) 2000;14:151-61.
2. Bruera E, Yennurajalingam S. Challenge of managing cancer- related fatigue. J Clin Oncol 2010;28:3671-2.
3. Ahlberg K, Ekman T, Gaston-Johansson F, Mock V. Assessment and management of cancer-related fatigue in adults. Lancet
2003;362:640-50.
4. Curt GA. Impact of fatigue on quality of life in oncology patients.
Semin Hematol 2000;37(4 Suppl 6):14-7.
5. Maughan TS, James RD, Kerr DJ, Ledermann JA, McArdle C, Seymour MT, et al. Comparison of survival, palliation, and quality of life with three chemotherapy regimens in metastatic colorectal cancer: a multicentre randomised trial. Lancet 2002;359:1555-63.
6. Weis J. Cancer-related fatigue: prevalence, assessment and treat- ment strategies. Expert Rev Pharmacoecon Outcomes Res 2011;
11:441-6.
7. Cella D, Davis K, Breitbart W, Curt G; Fatigue Coalition. Cancer- related fatigue: prevalence of proposed diagnostic criteria in a United States sample of cancer survivors. J Clin Oncol 2001;19:
3385-91.
8. Ruffer JU, Flechtner H, Tralls P, Josting A, Sieber M, Lathan B, et al.
Fatigue in long-term survivors of Hodgkin's lymphoma; a report from the German Hodgkin Lymphoma Study Group (GHSG). Eur J Cancer 2003;39:2179-86.
9. Vogelzang NJ, Breitbart W, Cella D, Curt GA, Groopman JE, Horning SJ, et al. Patient, caregiver, and oncologist perceptions of cancer-related fatigue: results of a tripart assessment survey.
The Fatigue Coalition. Semin Hematol 1997;34(3 Suppl 2):4-12.
10. Singer S, Kuhnt S, Zwerenz R, Eckert K, Hofmeister D, Dietz A, et al. Age- and sex-standardised prevalence rates of fatigue in a large hospital-based sample of cancer patients. Br J Cancer 2011;105:445-51.
11. Seyidova-Khoshknabi D, Davis MP, Walsh D. Review article:
a systematic review of cancer-related fatigue measurement questionnaires. Am J Hosp Palliat Care 2011;28:119-29.
12. Smets EM, Garssen B, Bonke B, De Haes JC. The Multidimensional Fatigue Inventory (MFI) psychometric qualities of an instrument to assess fatigue. J Psychosom Res 1995;39:315-25.
13. Aaronson NK, Ahmedzai S, Bergman B, Bullinger M, Cull A, Duez NJ, et al. The European Organization for Research and Treatment of Cancer QLQ-C30: a quality-of-life instrument for use in international clinical trials in oncology. J Natl Cancer Inst 1993;85:365-76.
14. Schwarz R, Krauss O, Hinz A. Fatigue in the general population.
Onkologie 2003;26:140-4.
15. Schwarz R, Hinz A. Reference data for the quality of life questionnaire
EORTC QLQ-C30 in the general German population. Eur J Cancer 2001;37:1345-51.
16. Hagelin CL, Wengstrom Y, Runesdotter S, Furst CJ. The psy- chometric properties of the Swedish Multidimensional Fatigue Inventory MFI-20 in four different populations. Acta Oncol 2007;46:97-104.
17. Smets EM, Garssen B, Cull A, de Haes JC. Application of the multidimensional fatigue inventory (MFI-20) in cancer patients receiving radiotherapy. Br J Cancer 1996;73:241-5.
18. Hinz A, Fleischer M, Brahler E, Wirtz H, Bosse-Henck A. Fatigue in patients with sarcoidosis, compared with the general population.
Gen Hosp Psychiatry 2011;33:462-8.
19. Kuhnt S, Ernst J, Singer S, Ruffer JU, Kortmann RD, Stolzenburg JU, et al. Fatigue in cancer survivors-prevalence and correlates.
Onkologie 2009;32:312-7.
20. Zigmond AS, Snaith RP. The hospital anxiety and depression scale. Acta Psychiatr Scand 1983;67:361-70.
21. Scheier MF, Carver CS, Bridges MW. Distinguishing optimism from neuroticism (and trait anxiety, self-mastery, and self- esteem): a reevaluation of the Life Orientation Test. J Pers Soc Psychol 1994;67:1063-78.
22. Ware JE, Kosinski M, Dewey JE, Gandek B. How to score and interpret single-item health status measures: a manual for users of the SF-8TM Health Survey. Lincoln, RI: QualityMetric Incorporated;
2001.
23. Henrich G, Herschbach P. Questions on life satisfaction (FLZM): a short questionnaire for assessing subjective quality of life. Eur J Psychol Assess 2000;16:150-9.
24. Cohen J. Statistical power analysis for the behavioral sciences.
2nd ed. Hillsdale, NJ: Erlbaum; 1988.
25. Gerber LH, Stout N, McGarvey C, Soballe P, Shieh CY, Diao G, et al. Factors predicting clinically significant fatigue in women follo- wing treatment for primary breast cancer. Support Care Cancer 2011;19:1581-91.
26. Weis J, Arraras JI, Conroy T, Efficace F, Fleissner C, Gorog A, et al.
Development of an EORTC quality of life phase III module measuring cancer-related fatigue (EORTC QLQ-FA13). Psychooncology 2013;22:
1002-7.
27. Osoba D. What has been learned from measuring health-related quality of life in clinical oncology. Eur J Cancer 1999;35:1565-70.