ABSTRACT
Background: Children today are exposed to various media devices, and their usage of these is increasing. Prior studies have outlined forms of harm this can potentially cause. However, there has been little empirical research on the use of media devices among preschool children in Asia. The aim of this study was to examine and analyze longitudinal trends in media device use among Korean preschool children, focusing on the frequency of engagement, time spent with, and ownership of media devices, delineated by sex.
Methods: Four hundred parents of children aged 2–5 years were invited to enroll. The baseline assessment, Wave 1, was conducted between December 2015 and June 2016, and follow-up assessments, Wave 2 and Wave 3, were conducted annually for the following 2 years. Time of media use, frequency of media use, and ownership of media devices (TV, tablet PCs, and smartphones) were investigated.
Results: Ownership of tablet PCs increased significantly between Wave 1 and Wave 3 for boys and girls (corrected P < 0.001). Frequency of media use increased significantly between Wave 1 and Wave 3 only in boys' use of tablet PCs (mean difference 0.8 day/wk). Time of media use increased significantly between Wave 1 and Wave 3 for both sexes in all devices, measured by mean difference on weekdays and weekends (TV by 0.6 and 0.7 hr/day, tablet PCs by 0.6 and 0.8 hr/day, and smartphones by 0.4 and 0.4 hr/day). Children spent more time using media devices during weekends than on weekdays.
Conclusion: This study observed an increase in the tendency of media device use among preschool children in Korea. The patterns of use indicate that paying attention to the types of devices children use is needed, as well as vigilance on weekends.
Keywords: Digital Media; Media Use; Trend, Preschool Children
INTRODUCTION
These days, media devices (television, smartphones, tablets, computers, etc.) play an important role in children's lives.1 According to a report of Kabali et al.,2 in 2013, 76.6%
of children aged 2–4 years used a device daily, while daily screen time among children age of 12 in China increased significantly from 10% in 1997 to 40% in 2006.3 In Korea, 38%
of children who are under-11months old use screen media and spend about 2.4 hours per
Original Article
Received: Jul 2, 2019 Accepted: Sep 3, 2019 Address for Correspondence:
Yunmi Shin, MD
Department of Psychiatry, Ajou University School of Medicine, 164 World cup-ro, Yeongtong-gu, Suwon 16499, Republic of Korea.
E-mail: [email protected]
© 2019 The Korean Academy of Medical Sciences.
This is an Open Access article distributed under the terms of the Creative Commons Attribution Non-Commercial License (https://
creativecommons.org/licenses/by-nc/4.0/) which permits unrestricted non-commercial use, distribution, and reproduction in any medium, provided the original work is properly cited.
ORCID iDs Dong Yun Lee
https://orcid.org/0000-0002-3678-9862 Hyun Woong Roh
https://orcid.org/0000-0002-1333-358X Seong-Ju Kim
https://orcid.org/0000-0003-1364-9960 Eun-Jin Park
https://orcid.org/0000-0003-4046-1517 Heejeong Yoo
https://orcid.org/0000-0003-0521-2718 Sooyeon Suh
https://orcid.org/0000-0003-0644-8634 Yunmi Shin
https://orcid.org/0000-0001-9880-4004 Funding
This research was supported by a grant from the Korean Mental Health Technology R&D
Dong Yun Lee ,1 Hyun Woong Roh ,1 Seong-Ju Kim ,1 Eun-Jin Park ,2 Heejeong Yoo ,3 Sooyeon Suh ,4 and Yunmi Shin 1
1Department of Psychiatry, Ajou University School of Medicine, Suwon, Korea
2Department of Psychiatry, Inje University Ilsan Paik Hospital, Goyang, Korea
3 Department of Psychiatry, Seoul National University Bundang Hospital, Seoul National University College of Medicine, Seongnam, Korea
4Department of Psychology, Sungshin Women's University, Seoul, Korea
Trends in Digital Media Use in Korean Preschool Children
Psychiatry & Psychology
Project, Ministry of Health & Welfare, Republic of Korea (HL19C0012).
Disclosure
The authors have no potential conflicts of interest to disclose
Author Contributions
Conceptualization: Lee DY, Shin Y. Data curation: Park EJ, Yoo H. Formal analysis:
Kim SJ, Roh HW. Funding acquisition: Shin Y. Investigation: Shin Y, Park EJ, Yoo H.
Methodology: Kim SJ, Roh HW. Supervision:
Shin Y. Validation: Roh HW. Writing - original draft: Lee DY, Shin Y. Writing - review & editing:
Shin Y.
Data Availability Statement Data from the K-CURE study are available upon request to researchers who meet the criteria for access to confidential information.
Access to data is permitted by Korea Institute for Health and Social Affairs and requests to access data may be submitted to Yun Mi Shin, MD.
day engaging with media devices.4 Concerns have been raised about associations between exposure to media devices and interference in caregiver-child relationship as well as the well- being of children. In fact, it has been reported that excessive screen use is related to impulse control, executive functioning, flexible thinking, and emotional regulation.5 Emotional and behavioral problems like anxiety, depression and somatization were associated with mobile device overuse in elementary school children.6 Exposure to both violent and educational media such as films rated 18 and PBS Kids are linked to relational aggression in girls and physical aggression in boys. Suicide attempts, depression and ADHD-related behavior have also been associated to screen time. Research also shows that exposure to media in childhood results in aggressive behavior that persists into adolescence and adulthood.7 For these reasons, the American Academy of Pediatrics recommends discouraging any screen time for children under the age of 2 years.8
There is increasing evidence that young children interact with media such as TV differently than older children.9 Nevertheless, recent studies on children's use of media devices mainly focus on school children and adolescents.10 Because exposure to digital screen devices (e.g., tablet computers and smartphones) is relatively recent, it is difficult to assess young children's media usage.11 Therefore, it is important to recognize the usage patterns of young children to inform and guide early and adequate interventions such as the American Academy of Pediatrics screen time guidelines.8
In spite of recent striking changes in the accessibility and availability of media devices, few scientific studies have assessed trends in screen time behaviors. The available data and findings are inconsistent regarding trends.12 one study stated that time for television viewing and total media use among adolescents over the past 50 years has been stable, while another study reported that time spent viewing television has decreased but has been replaced by an increase in computer use over the last decade. As such, it is also crucial to monitor trends in media use in order to develop effective interventions.13
In addition, a few studies have shown that exposure to media differs between boys and girls.14 Research by Cui et al.3 reported that boys were 1.41 times more likely to spend over 2 hours per day on screen time than girls. However, some studies reported no association between child’s sex and screen time.15 It is necessary to confirm any differences according to sex in longitudinal or age group-based research of media exposure.
In response to these demands, the first long-term observational prospective cohort study has started for understanding of the use of media devices for children in Korea. As part of the cohort, we carry out this study for investigating trends of the use of media devices among 2- to 5-year-old children by sex. The objective of the present study was to examine time trends of frequency, time and ownership of media devices in Korean young children according to the sex. We aim to clarify for Korean boys and girls aged 2- to 5-year-old the direction of trends over a time frame of 3 years from 2015 to 2017.
METHODS
Study sample
The Kids Cohort for Understanding of Internet Addiction Risk Factors in Early Childhood (K-CURE) study is the first long-term observational prospective cohort study investigating
the causes and effects of internet-related diseases and disorders in Korea. This study was carried out as a part of the K-CURE study and proceeded with data from Wave 1 to Wave 3.
We invited caregivers (mostly mothers) to participate in a self-administered survey on children's usage of various media platforms, as well as the mental health of children and their caregivers. The caregivers made a voluntary visit to a community center for child mental health located in Suwon, Sungnam, or Goyang, all of which are major cities in the most populous province of Korea. The baseline assessment; Wave 1, was conducted between December 2015 and July 2016, the follow-up assessment; Wave 2, was conducted between January 2016 and September 2017 and the follow-up assessment; Wave 3, was conducted between May 2017 and June 2018. In the first Wave of the survey, 400 caregivers of 2- to 5-year-old children were enrolled. The average age (months) of children in Wave 1 was 46 months, and in Wave 2 and Wave 3, 59 months and 72 months, respectively. In an effort to maintain contact with K-CURE study participants, we sent individual reports annually via mail, and we periodically sent text messages about general contents via cell phone to the participants.
Measures
Respondents were asked to report whether they had the following media devices: television, smartphone, tablet PC. Respondents were also asked to report the average time children spent using media and their frequency of media use over a month. Response options for the average amount of time per day on media use were “none,” “less than 1 hour,” “1–3 hours,” “3–5 hours,” and “5 hours and up” in the first Wave of the survey. For the second Wave of the survey, we used the self-filling question for the amount of time spent using media. To define this categorical variable as a continuous variable, we recoded “none” to
“0,” “less than 1 hour” to “0.5,” “1-3 hours” to “2,” “3–5 hours” to “4,” and “5 hours and up”
to “6.” The answers for time spent on media use were divided into weekdays and weekends.
Response categories for the frequency of media use were “never,” “less than once a week,”
“1–2 days a week,” “3–4 days a week,” “5–6 days a week,” and “almost every day.” To define this categorical variable as a continuous variable, we recoded “never” to “0,” “less than once a week” to “0.5,” “1–2 days a week” to “1.5,” “3–4 days a week” to “3.5,” “5–6 days a week” to
“5.5,” and “almost every day” to “7.”
Statistical analysis
Descriptive statistics were used to explore the data. Categorical variables were compared using the χ2 test for each sex. Cochran's Q test was performed on datasets that failed the Shapiro-Wilk test for normality. Cochran's Q test was performed to compare the ownership of media devices (at Wave 1, Wave 2, and Wave 3). Post-hoc analysis for ownership was conducted with McNemar test. Friedman test was performed on datasets that failed the Shapiro-Wilk test for normality. Friedman test was performed to compare the frequency and time of media use (at Wave 1, Wave 2, and Wave 3). Post-hoc analysis for media use was conducted with Wilcoxon signed rank test. A P value < 0.05 was considered statistically significant. SPSS software version 20.0 (SPSS Inc., Chicago, IL, USA) was used for all statistical analyses.
Ethics statement
The study was approved by the Institutional Review Board (IRB) at the Ajou University School of Medicine (AJIRB-SBR-SUR-14-378). Informed consent was obtained from all participants when they were enrolled.
RESULTS
Participant's demographics
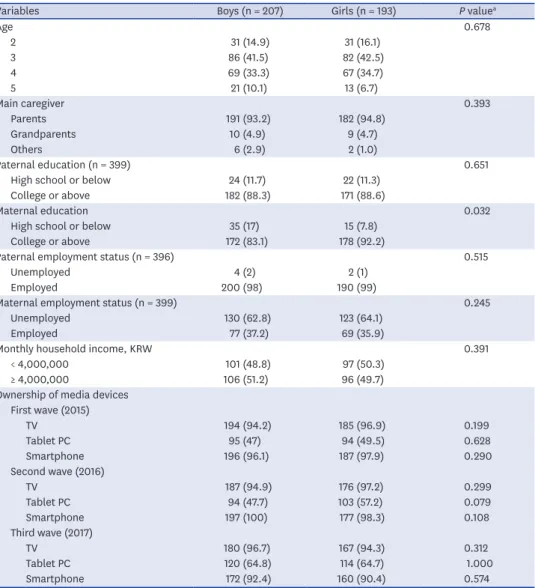
The demographic data are shown in Table 1. We invited 400 children aged 2–5 years to participate in the study, and analyzed the demographic data according to sex. There was no statistically significant difference between the two groups in most areas, except for maternal education (P < 0.032). Almost all the children (93.2% in boys and 94.8% in girls) were primarily cared for by their parents. Most of the parents had a college degree, and half of them had a monthly household income of above KRW 4,000,000, which is about the national average household income in Korea (KRW 4,222,533) in 2015. Most participants owned TVs (94.2% in boys and 96.9% in girls) and smartphones (96.1% in boys and 97.9% in girls), while tablet PCs (47% in boys and 49.5% in girls) were significantly less common. However, when comparing three-year ownership ratios by device, there was an increasing tendency in only the tablet PC category for both sexes. In a post-hoc analysis to identify changing
Table 1. Baseline characteristics of the study participants (n = 400)
Variables Boys (n = 207) Girls (n = 193) P valuea
Age 0.678
2 31 (14.9) 31 (16.1)
3 86 (41.5) 82 (42.5)
4 69 (33.3) 67 (34.7)
5 21 (10.1) 13 (6.7)
Main caregiver 0.393
Parents 191 (93.2) 182 (94.8)
Grandparents 10 (4.9) 9 (4.7)
Others 6 (2.9) 2 (1.0)
Paternal education (n = 399) 0.651
High school or below 24 (11.7) 22 (11.3)
College or above 182 (88.3) 171 (88.6)
Maternal education 0.032
High school or below 35 (17) 15 (7.8)
College or above 172 (83.1) 178 (92.2)
Paternal employment status (n = 396) 0.515
Unemployed 4 (2) 2 (1)
Employed 200 (98) 190 (99)
Maternal employment status (n = 399) 0.245
Unemployed 130 (62.8) 123 (64.1)
Employed 77 (37.2) 69 (35.9)
Monthly household income, KRW 0.391
< 4,000,000 101 (48.8) 97 (50.3)
≥ 4,000,000 106 (51.2) 96 (49.7)
Ownership of media devices First wave (2015)
TV 194 (94.2) 185 (96.9) 0.199
Tablet PC 95 (47) 94 (49.5) 0.628
Smartphone 196 (96.1) 187 (97.9) 0.290
Second wave (2016)
TV 187 (94.9) 176 (97.2) 0.299
Tablet PC 94 (47.7) 103 (57.2) 0.079
Smartphone 197 (100) 177 (98.3) 0.108
Third wave (2017)
TV 180 (96.7) 167 (94.3) 0.312
Tablet PC 120 (64.8) 114 (64.7) 1.000
Smartphone 172 (92.4) 160 (90.4) 0.574
Values are presented as number (%).
aAnalysis of χ2-test for categorical variables.
patterns over time, ownership of tablet PCs was seen to increase significantly (Wave 1 vs.
Wave 3 for both sex; corrected P < 0.001, Table 2).
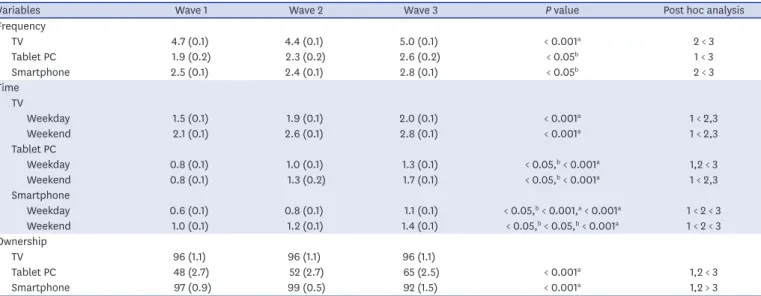
Changes in frequency, time and ownership of media use from Wave 1 to Wave 3 In Table 3, consistent changes of median frequency were only found in tablet PCs. In a post- hoc analysis to identify changing patterns over time, the median frequency had increased significantly in tablet PCs (Wave 1 vs. Wave 3; corrected P = 0.018) (Table 3). Table 3 shows that median time spent on media device use changed significantly year by year in each subgroup (TV, tablet PC, and smart phone) on both weekends and weekdays. In a post-hoc analysis to identify changing patterns over time, the median time spent was seen to increase significantly in each subgroup (TV, tablet PC, and smart phone). In Table 3, consistent changes of ownership were only found in tablet PCs. In a post-hoc analysis to identify changing patterns over time, ownership of tablet PCs was seen to increase significantly (Wave 1 vs. Wave 3; corrected P < 0.001) (Table 3).
Changes in frequency of media use from wave 1 to wave 3 stratified by sex In Table 4, the number of respondents can be seen to be less than the ownership ratio of the device. This is because not all respondents engaged in all three Waves of the study.
However, the value N is similar to the ownership ratio of each device. Table 4 shows that, for
Table 2. Changes in ownership of media devices from Wave 1 to Wave 3 stratified by sex
Variables Wave 1 Wave 2 Wave 3 P value Post hoc analysis
Girls
TV 97 (1.3) 97 (1.3) 94 (1.8)
Tablet PC 48 (3.8) 57 (3.8) 65 (3.6) < 0.05,a < 0.001b 1,2 < 3
Smartphone 98 (1.0) 98 (1.0) 91 (2.2) < 0.001,b < 0.05a 1,2 < 3
Boys
TV 94 (1.7) 95 (1.7) 97 (1.3)
Tablet PC 48 (3.7) 48 (3.7) 65 (3.6) < 0.001b 1,2 < 3
Smartphone 96 (1.5) 100 (0.0) 92 (2.0)
Data are expressed as mean ± standard deviation and analyzed by Cochran's Q test followed by McNemar test at post-hoc analysis.
aCorrected P < 0.05; bcorrected P < 0.01.
Table 3. Changes in frequency, time and ownership of media use from Wave 1 to Wave 3
Variables Wave 1 Wave 2 Wave 3 P value Post hoc analysis
Frequency
TV 4.7 (0.1) 4.4 (0.1) 5.0 (0.1) < 0.001a 2 < 3
Tablet PC 1.9 (0.2) 2.3 (0.2) 2.6 (0.2) < 0.05b 1 < 3
Smartphone 2.5 (0.1) 2.4 (0.1) 2.8 (0.1) < 0.05b 2 < 3
Time TV
Weekday 1.5 (0.1) 1.9 (0.1) 2.0 (0.1) < 0.001a 1 < 2,3
Weekend 2.1 (0.1) 2.6 (0.1) 2.8 (0.1) < 0.001a 1 < 2,3
Tablet PC
Weekday 0.8 (0.1) 1.0 (0.1) 1.3 (0.1) < 0.05,b < 0.001a 1,2 < 3
Weekend 0.8 (0.1) 1.3 (0.2) 1.7 (0.1) < 0.05,b < 0.001a 1 < 2,3
Smartphone
Weekday 0.6 (0.1) 0.8 (0.1) 1.1 (0.1) < 0.05,b < 0.001,a < 0.001a 1 < 2 < 3
Weekend 1.0 (0.1) 1.2 (0.1) 1.4 (0.1) < 0.05,b < 0.05,b < 0.001a 1 < 2 < 3
Ownership
TV 96 (1.1) 96 (1.1) 96 (1.1)
Tablet PC 48 (2.7) 52 (2.7) 65 (2.5) < 0.001a 1,2 < 3
Smartphone 97 (0.9) 99 (0.5) 92 (1.5) < 0.001a 1,2 > 3
Data for frequency and time are expressed as mean ± standard deviation and analyzed by Friedman test followed by Wilcoxon signed rank test at post-hoc analysis.
Data for the ownership are expressed as mean ± standard deviation and analyzed by Cochran's Q test followed by McNemar test at post-hoc analysis.
aCorrected P < 0.05; bcorrected P < 0.01.
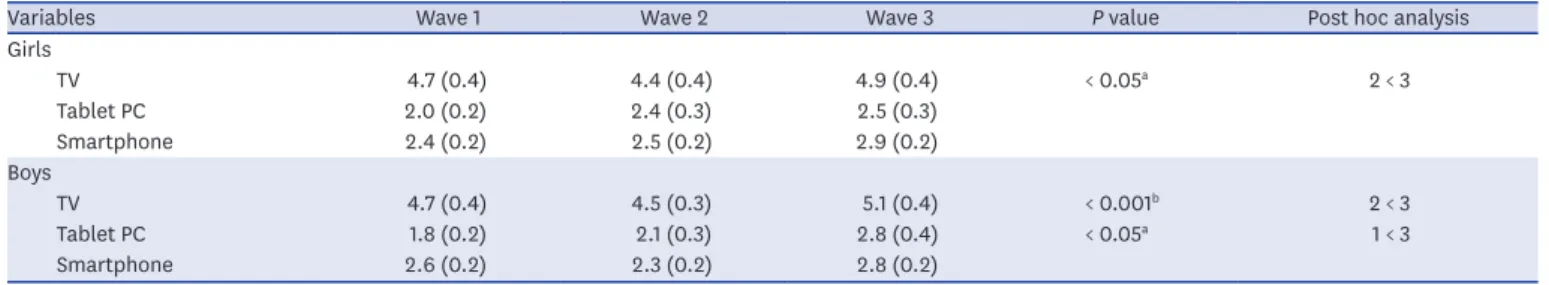
boys, consistent changes of median frequency were only found in tablet PCs. In the post- hoc analysis to identify possible change over time for tablet PCs, the median frequency had increased significantly (Wave 1 vs. Wave 3; corrected P = 0.03) (Table 4). Additionally, the greatest increase in median frequency of media device use for boys was in the category of the tablet PC, from 1.8 days per week in Wave 1, to 2.1 days per week in Wave 2, and 2.8 days per week in Wave 3. Although frequency of tablet-PC use and smart-phone use for girls increased consistently, there were no statistically significant group differences. The greatest increase in median frequency for girls was use of the tablet PC from 2.0 days per week in Wave 1, to 2.4 days per week in Wave 2, and 2.5 days per week in Wave 3.
Changes in time of media use from wave 1 to wave 3 stratified by sex In Table 5, the number of respondents differs from the ownership ratio for the same reason as for Table 4. Table 5 shows that median time spent on media device use changed significantly year by year in each subgroup (TV, tablet PC, and smart phone) on both weekends and weekdays for boys. In the post-hoc analysis to identify changing patterns, the median time spent was seen to increase significantly (TV on weekdays and weekends:
Wave 1 vs. Wave 3, corrected P < 0.001; tablet PC on weekdays: Wave 1 vs. Wave 3, corrected P = 0.009; tablet PC on weekends: Wave 1 vs. Wave 3, corrected P < 0.001; smartphone on Table 4. Changes in frequency of media use from Wave 1 to Wave 3 stratified by sex
Variables Wave 1 Wave 2 Wave 3 P value Post hoc analysis
Girls
TV 4.7 (0.4) 4.4 (0.4) 4.9 (0.4) < 0.05a 2 < 3
Tablet PC 2.0 (0.2) 2.4 (0.3) 2.5 (0.3)
Smartphone 2.4 (0.2) 2.5 (0.2) 2.9 (0.2)
Boys
TV 4.7 (0.4) 4.5 (0.3) 5.1 (0.4) < 0.001b 2 < 3
Tablet PC 1.8 (0.2) 2.1 (0.3) 2.8 (0.4) < 0.05a 1 < 3
Smartphone 2.6 (0.2) 2.3 (0.2) 2.8 (0.2)
Data are expressed as mean ± standard deviation and analyzed by Friedman test followed by Wilcoxon signed rank test at post-hoc analysis.
aCorrected P < 0.01; bcorrected P < 0.05.
Table 5. Changes in time of media use from Wave 1 to Wave 3 stratified by sex
Variables Wave 1 Wave 2 Wave 3 P value Post hoc analysis
Girls TV
Weekday 1.4 (0.1) 1.6 (0.1) 1.8 (0.2) < 0.001a 1 < 3
Weekend 1.9 (0.2) 2.5 (0.2) 2.6 (0.2) < 0.001a 1 < 2,3
Tablet PC
Weekday 0.7 (0.1) 1.0 (0.2) 1.2 (0.2) < 0.05b 1 < 3
Weekend 0.9 (0.2) 1.5 (0.3) 1.5 (0.3) < 0.05b 1 < 2,3
Smartphone
Weekday 0.5 (0.1) 0.7 (0.1) 0.9 (0.1) < 0.001a 1 < 3
Weekend 0.8 (0.1) 1.1 (0.1) 1.3 (0.1) < 0.001a 1 < 2,3
Boys TV
Weekday 1.5 (0.1) 2.1 (0.2) 2.3 (0.2) < 0.001a 1 < 2,3
Weekend 2.2 (0.2) 2.7 (0.2) 2.9 (0.2) < 0.001a 1 < 2,3
Tablet PC
Weekday 0.8 (0.2) 0.9 (0.2) 1.5 (0.3) < 0.001a 1,2 < 3
Weekend 0.8 (0.1) 1.1 (0.2) 1.8 (0.3) < 0.001a 1 < 3
Smartphone
Weekday 0.7 (0.1) 0.9 (0.1) 1.3 (0.1) < 0.001a 1,2 < 3
Weekend 1.1 (0.1) 1.3 (0.1) 1.5 (0.1) < 0.05b 1 < 3
Data are represented as mean ± standard deviation and analyzed by Friedman test followed by Wilcoxon signed rank test at post-hoc analysis.
aCorrected P < 0.01; bcorrected P < 0.05
weekdays: Wave 1 vs. Wave 3, corrected P < 0.001; smartphone on weekends: Wave 1 vs. Wave 3, corrected P = 0.012, respectively). The greatest increase in time spent on media devices for boys was the tablet PC on weekends from 0.8 hours per day in Wave 1, to 1.1 hours per day in Wave 2, and up to 1.8 hours per day in Wave 3. Time spent on the use of the tablet PCs on weekends in Wave 3 more than doubled as compared to Wave 1. Similarly, for girls, the median time spent on devices changed significantly year by year in each subgroup (TV, tablet PC, and smart phone) and on both weekends and weekdays. In the post-hoc analysis, the median time spent was also seen to increase significantly (TV on weekdays: Wave 1 vs. Wave 3, corrected P = 0.009; TV on weekends: Wave 1 vs. Wave 3, corrected P < 0.001; tablet PC on weekdays: Wave 1 vs. Wave 3, corrected P = 0.042; tablet PC on weekends: Wave 1 vs. Wave 3, corrected P = 0.039; smartphone on weekdays and weekend: Wave 1 vs. Wave 3, corrected P <
0.001; respectively). Likewise, the greatest increase in time spent on devices for girls was also on the tablet PC on weekends from 0.9 hours per day in Wave 1, to 1.5 hours per day in Wave 2, and up to 1.5 hours per day in Wave 3. Meanwhile, in each Wave, there was a tendency for the median time spent on devices by both sexes and for all devices to be longer on weekends than on weekdays.
DISCUSSION
This study examined longitudinal trends in media device use by young children in Korea.
Media use of young children in Korea has become similar to those in other countries. Just as the average daily TV watching time of 2-year-old child in Korea was 1.21 hours,16 it was 1.2 to 1.5 hours per day of children in Czech and 1.04 hours per day of children 2 to 4 years old in USA.17,18 In addition, the percent of children aged 2 to 5 years using mobile devices every day in Korea was 16.9% and the percent of children aged 0 to 8 years in USA was 17%.18,19
Our findings show that time spent on media device use increased significantly from Wave 1 to Wave 3 for both sexes. The most striking trend in categories of devices used was the tablet PC, which showed the greatest increase in both time and frequency of media device used for both sexes. Ownership levels of tablet PCs also increased significantly from Wave 1 to Wave 3 for both boys and girls, with no significant changes in ownership levels of TV and smartphones.
These findings are consistent with previous studies of young children' exposure to media.
It has been reported that a positive association between screen media use and a child's age exists.15 Some researchers have shown that the use of any media increased by 9.3 min/day for every 1-month increase in age.20 Consequently, the use of the tablet PC has increased dramatically from 52% in 2011 to 75% in 2013 among young children.21 Moreover, the most popular device in the USA has been seen to be the tablet PC, owned by two-thirds of all children aged 4.5 The proportion of tablet PC ownership in Germany doubled between 2012 and 2013. Furthermore, research shows that ownership of smartphones in Germany increased from 0% in 2009 to 72% in 2013,13 which is contrary to our results. This is because smart devices became rapidly popular in Korea; the ownership of TVs and smartphones was already at 90% in 2015, which is when our research began. Potential reasons for the correlation between increased screen-time and increasing age includes the ownership of devices.20 Considering that ownership of only the tablet PC as a category of media device increased significantly, and the tablet PCs media usage increased the most, the increase in media device use may be associated with the ownership of media devices. Of course, other reasons could also be related to increased media device use; for instance, as certain devices
require a certain level of cognitive and physical functioning, a child's development level by age also affects media use.22 Higher use of mobile devices among parents was more likely to relate to higher use of mobile devices among children.20 There has been little empirical research on the use of media devices among infants and toddlers; studies on Asia are, in particular, very limited.19 Therefore, more studies on interaction between ownership of media devices and media usage are necessary to understand and confirm these findings.
The current study also found that unlike the category of time spent using media devices, there were few significant differences in the frequency of media device use from Wave 1 to Wave 3 among both sexes, except for the category of tablet PC for boys. Although the median frequency of TV use for both sexes increased significantly from Wave 2 to Wave 3, there were no consistent changes from Wave 1 to Wave 3.
Contrary to our results, the frequency in use of media devices is increasing among children in the USA, Argentina, and France. The frequency of tablet PC use was 20% in 2013 and 36.2% in 2015 in the USA.5 However, based on a study of 450 children aged 5–40 months from France, frequency of screen use is not likely to relate to age in any straightforward way.23 According to the Common Sense 2013 report18, frequency of use is likely to change dramatically when children enter the educational system. Because our study was aimed at young children, the lack of significant differences in frequency might be considered as a characteristic of preschool children.
Our study shows that there was no difference in trends between boys and girls. Both sexes showed a significant increase in the time spent on devices, but there was no significant difference recorded in frequency of use. Other researchers have reported similar findings showing that screen time for young children under 36 months had no association with a child's sex.15 Previous research has also found that sex has no association with screen time in preschool children.20 However, unlike research involving young children, many studies involving older children and adolescents show that girls are more sedentary than boys.24 Given this discrepancy, the approach to researching preschoolers and older children needs to be different.
In addition, this study shows a tendency for children to spend more time on media devices during weekends than on weekdays. This result is similar to other studies as screen-time behavior differed substantially over the week, with 97% and 86% of young children engaging in more than 1 hour of screen-time per day on weekends and weekdays.25 In the Czech Republic, children spent more than 78 minutes on media devices during weekends and less than 1 hour during weekdays.17 A study conducted in the UK also found that time spent on media devices by 5- to 6-year-old children was much higher on weekends than on weekdays.26 These findings indicate that parents need to be careful about children’s use of media devices during the weekend, when usage increases.
Our findings have several limitations that must be mentioned. We used a parent survey, which is vulnerable to a social desirability bias. The findings may not be generalizable because of the largely homogenous socioeconomic backgrounds of participants. In the analysis of trends, we did not consider broad factors such as media content, environmental factors, and parental factors; for example, some studies indicate that the relation between cognitive development and media use is content dependent.27 In addition, the analysis of weekends versus weekdays relates only to the time spent on use of media devices and not
the frequency of media device use, because we did not distinguish between weekends and weekdays for frequency in the first year of research.
One of the strengths of our study is the homogenous population, so that there is no difference in characteristics between boys and girls except for maternal education. Even so, studies reported that maternal education was unclearly associated with screen time among children aged 0–36 months.15 In addition, for three consecutive years, we conducted similar surveys for the same group. In a small number of clinical studies on the use of media devices in young children, especially in Korea, we show the longitudinal trends of media devices and the link between ownership and trends.
This study investigated trends in the use of media devices among preschool-aged children.
Increasing tendencies in the time spent on media device use was found for both sexes, but not in frequency of media use, and no significant difference in trends according to sex was recorded. Research has also shown that tablet PC usage has increased the most, while ownership of only the tablet PC increased significantly. As such, focusing on the tablet PC as a key media device might be an important goal in intervention to reduce screen time.
Our findings indicate that during the weekend, time spent on media device use was longer than during weekdays for each Wave, confirming again the key differences in use between weekdays and weekends. This study provides the basis for future interventions to guide proper media device use among young children. Future studies are needed to develop guidelines for young children that consider the various influencing factors listed here.
REFERENCES
1. Strasburger VC, Hogan MJ, Mulligan DA, Ameenuddin N, Christakis DA, Cross C, et al. Children, adolescents, and the media. Pediatrics 2013;132(5):958-61.
PUBMED | CROSSREF
2. Kabali HK, Irigoyen MM, Nunez-Davis R, Budacki JG, Mohanty SH, Leister KP, et al. Exposure and use of mobile media devices by young children. Pediatrics 2015;136(6):1044-50.
PUBMED | CROSSREF
3. Cui Z, Hardy LL, Dibley MJ, Bauman A. Temporal trends and recent correlates in sedentary behaviours in Chinese children. Int J Behav Nutr Phys Act 2011;8(1):93.
PUBMED | CROSSREF
4. Lee KS, Jung SJ, Kim MS. The influence of infants'(1–3 years) visual media overindulgence on their general, emotional and social development. Korean J Dev Psychol 2015;28(1):117-32.
5. Kılıç AO, Sari E, Yucel H, Oğuz MM, Polat E, Acoglu EA, et al. Exposure to and use of mobile devices in children aged 1–60 months. Eur J Pediatr 2019;178(2):221-7.
PUBMED | CROSSREF
6. Baek HW, Shin YM, Shin KM. Emotional and behavioral problems related to smartphone overuse in elementary school children. J Korean Neuropsychiatr Assoc 2014;53(5):320-6.
CROSSREF
7. Hogan MJ, Strasburger VC. Media and prosocial behavior in children and adolescents. In: Nucci L, Narvaez D, editors. Handbook of Moral and Character Education. Mahwah, NJ: Lawrence Erlbaum; 2008, 537-53.
8. Brown A; Council on Communications and Media. Media use by children younger than 2 years. Pediatrics 2011;128(5):1040-5.
PUBMED | CROSSREF
9. Mistry KB, Minkovitz CS, Strobino DM, Borzekowski DL. Children's television exposure and behavioral and social outcomes at 5.5 years: does timing of exposure matter? Pediatrics 2007;120(4):762-9.
PUBMED | CROSSREF
10. Rideout V. Parents, Media and Public Policy: a Kaiser Family Foundation Survey. Menlo Park, CA: The Henry J.
Kaiser Family Foundation; 2004.
11. Holloway D, Green L, Livingstone S. Zero to Eight: Young Children and Their Internet Use. London: EU Kids Online; 2013.
12. Nelson MC, Neumark-Stzainer D, Hannan PJ, Sirard JR, Story M. Longitudinal and secular trends in physical activity and sedentary behavior during adolescence. Pediatrics 2006;118(6):e1627-34.
PUBMED | CROSSREF
13. Bucksch J, Inchley J, Hamrik Z, Finne E, Kolip P; HBSC Study Group Germany. Trends in television time, non-gaming PC use and moderate-to-vigorous physical activity among German adolescents 2002–2010.
BMC Public Health 2014;14(1):351.
PUBMED | CROSSREF
14. Pate RR, Mitchell JA, Byun W, Dowda M. Sedentary behaviour in youth. Br J Sports Med 2011;45(11):906-13.
PUBMED | CROSSREF
15. Duch H, Fisher EM, Ensari I, Harrington A. Screen time use in children under 3 years old: a systematic review of correlates. Int J Behav Nutr Phys Act 2013;10(1):102.
PUBMED | CROSSREF
16. Byeon H, Hong S. Relationship between television viewing and language delay in toddlers: evidence from a Korea national cross-sectional survey. PLoS One 2015;10(3):e0120663.
PUBMED | CROSSREF
17. Sigmundová D, Sigmund E, Badura P, Vokáčová J, Trhlíková L, Bucksch J. Weekday-weekend patterns of physical activity and screen time in parents and their pre-schoolers. BMC Public Health 2016;16(1):898.
PUBMED | CROSSREF
18. Common Sense Media. Zero to Eight: Children's Media Use in America 2013. San Francisco, CA: Common Sense Media; 2013.
19. Chang HY, Park EJ, Yoo HJ, Lee JW, Shin Y. Electronic media exposure and use among toddlers. Psychiatry Investig 2018;15(6):568-73.
PUBMED | CROSSREF
20. Paudel S, Jancey J, Subedi N, Leavy J. Correlates of mobile screen media use among children aged 0–8: a systematic review. BMJ Open 2017;7(10):e014585.
PUBMED | CROSSREF
21. Dennison BA, Erb TA, Jenkins PL. Television viewing and television in bedroom associated with overweight risk among low-income preschool children. Pediatrics 2002;109(6):1028-35.
PUBMED | CROSSREF
22. Park S, Chang HY, Park EJ, Yoo H, Jo W, Kim SJ, et al. Maternal depression and children's screen overuse. J Korean Med Sci 2018;33(34):e219.
PUBMED | CROSSREF
23. Cristia A, Seidl A. Parental reports on touch screen use in early childhood. PLoS One 2015;10(6):e0128338.
PUBMED | CROSSREF
24. Downing KL, Hinkley T, Salmon J, Hnatiuk JA, Hesketh KD. Do the correlates of screen time and sedentary time differ in preschool children? BMC Public Health 2017;17(1):285.
PUBMED | CROSSREF
25. Berglind D, Tynelius P. Objectively measured physical activity patterns, sedentary time and parent- reported screen-time across the day in four-year-old Swedish children. BMC Public Health 2017;18(1):69.
PUBMED | CROSSREF
26. Jago R, Thompson JL, Sebire SJ, Wood L, Pool L, Zahra J, et al. Cross-sectional associations between the screen-time of parents and young children: differences by parent and child gender and day of the week. Int J Behav Nutr Phys Act 2014;11(1):54.
PUBMED | CROSSREF
27. Domingues-Montanari S. Clinical and psychological effects of excessive screen time on children. J Paediatr Child Health 2017;53(4):333-8.
PUBMED | CROSSREF