826 https://doi.org/10.9713/kcer.2019.57.6.826
PISSN 0304-128X, EISSN 2233-9558
Bubble-Point Measurement of Binary Mixture for the CO
2+ Caprolactone Acrylate System in High Pressure
Jong-Dae Jeong and Hun-Soo Byun†
Department of Chemical and Biomolecular Engineering, Chonnam National University, Yeosu, Jeonnam 59626, Korea (Received 8 July 2019; Received in revised form 31 July 2019; accepted 6 August 2019)
Abstract − Experimental data of phase equilibrium is reported for caprolactone acrylate in supercritical carbon dioxide.
Bubble-point data was measured by synthetic method at temperatures ranging from (313.2 to 393.2) K and pressures up to 55.93 MPa. In this research, the solubility of carbon dioxide for the (carbon dioxide+ caprolactone acrylate) system decreases as temperature increases at a constant pressure. The (carbon dioxide+ caprolactone acrylate) system exhibits type-I phase behavior. The experimental result for the (carbon dioxide+ caprolactone acrylate) system was correlated with Peng-Robinson equation of state using mixing rule. The critical property of caprolactone acrylate was predicted with the Joback and Lyderson method.
Key words: Caprolactone acrylate, Carbon dioxide, Phase behavior, Bubble-point, Pressure-composition
1. Introduction
Caprolactone acrylate is a low viscosity, high active, low volatility, low skin irritation monomer for use in free radical polymerization.
This monomer is used for the performance properties as a good adhesion, good chemical resistance, good weatherability, high flexibility, high impact strength and low shrinkage, and applications as pressure sensitive adhesives, chemical intermediates and coatings [1]. Especially, phase equilibrium data on caprolactone acrylate plays an essential role in polymer and polymerization processes.
Thermodynamic data for binary mixture of the acrylate group containing supercritical carbon dioxide plays an important role in the separation processes, fine chemical industry, polymerization condition and industrial application [2-5]. So far, our laboratory has reported various experimental data on the bubble-point, dew-point and critical- point behavior of binary mixtures containing supercritical carbon dioxide [6,7]. Supercritical carbon dioxide has a quadrupole moment, no dipole moment, and low dielectric constant. Carbon dioxide has been widely used as an eco-friendly solvent because it is inexpensive, nonflammable, and nontoxic. Also, itis a good solvent with low molecular weight in nonpolar molecules. Therefore, phase behavior information for the carbon dioxide + solute mixtures is required for practical uses.
Phase behavior data for the carbon dioxide + acrylate system were reported by Yoon and Byun [8], Cho et al. [9] and Jang et al. [10].
Yoon and Byun [8] presented the experimental data of phase behavior for the binary systems of heptafluorobutyl acrylate and heptafluorobutyl
methacrylate under carbon dioxide at high pressure. Cho et al. [9]
reported high-pressure phase behavior of tri-ethylene glycol dimethacrylate and tetra-ethylene glycol dimethacrylate in supercritical carbon dioxide at temperatures ranging from 303.2 to 363.2 K and pressure up to 27 MPa. Jang et al. [10] presented phase behavior measurements for the binary mixture of carbon dioxide + neopentyl glycol diacrylate and carbon dioxide + neopentyl glycol dimethacrylate systems at high pressure at temperatures from 313.2 K to 348.2 K and pressures up to 25.28 MPa using a static apparatus.
The major point of this work was to obtain high-pressure experimental data for (carbon dioxide + caprolactone acrylate) mixture by investigating mixtures of carbon dioxide with a component. The experimental data for the carbon dioxide + caprolactone acrylate system obtained in this work was correlated with the Peng-Robinson equation of state [11]
using mixing rule including two adjustable parameters. The critical pressure, critical temperature and acentric factor of caprolactone acrylate were estimated by the Joback and Lydersen method with group contributions [12].
2. Experimental Section
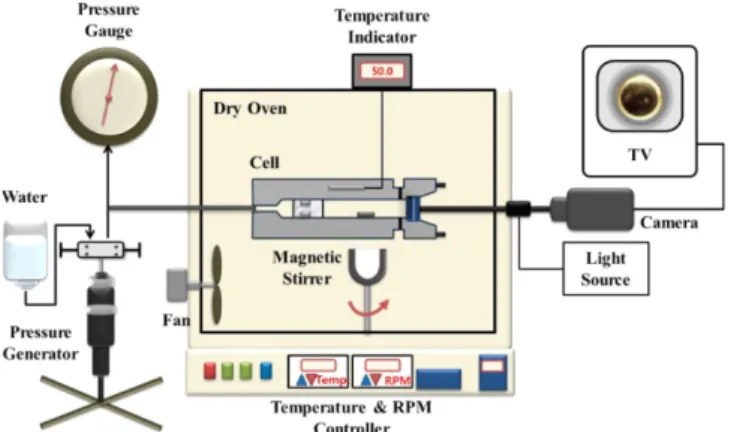
Apparatus and Procedure Fig. 1 shows a schematic of the high pressure experimental apparatus, variable-volume view cell used for the phase equilibria measurement [13,14]. A high-pressure, variable- volume view cell (6.2 cm outer diameter × 1.59 cm inner diameter), a working volume of ~28 cm3, was used to obtain the phase behavior curves; it is capable of operating up to a pressure of 70.0 MPa. The front cap section of the cell is fitted with a (1.9 cm thick × 1.9 cm diameter) a sapphire window (GT Advanced Technology, USA) which enabled us to observe the phases inside the cell. The sapphire window is sealed by an O-ring and backup ring placed around the diameter of window. The mixture in the cell was compressed to the desired
†To whom correspondence should be addressed.
E-mail: [email protected]
This is an Open-Access article distributed under the terms of the Creative Com- mons Attribution Non-Commercial License (http://creativecommons.org/licenses/by- nc/3.0) which permits unrestricted non-commercial use, distribution, and reproduc- tion in any medium, provided the original work is properly cited.
pressure by moving a piston located within the cell. The piston (2.54 cm length) was moved using water pressurized by a high pressure generator (HIP, model 37-5.75-60). The pressure of the mixture was measured with a Heise gauge (Dresser Ind., model CM-53920, 0 to 34.0 MPa) accurate to ±0.02 MPa. The temperature of the cell, which is typically maintained to within ±0.2 K, was measured using a platinum-resistance thermometer (Thermometrics Corp., Class A) and a digital multimeter (Yokogawa, model 7563, accurate to ±0.005%). The mixture inside the cell can be viewed on a video monitor using a camera coupled to a borescope (Olympus Corp., model F100-038-000-50) placed against the outside of the sapphire window. Typically, supercritical carbon dioxide is added to the cell to within (0.7~5.0) ±0.003 g using a high pressure cylinder. The monomer is loaded into the cell to within (4.4~11.1)
±0.002 g using a syringe after the empty cell is purged several times with carbon dioxide and nitrogen to remove traces of air and organic matter.
At a fixed temperature, the solution in the cell is compressed to a single phase. The inside of the solution is maintained in the single phase region at the desired temperature for at least 30~40 min for the cell to reach phase equilibrium. The pressure is then slowly decreased until a second phase appears. A bubble point pressure is obtained when small vapor bubbles appear first in the cell.
2-1. Materials
Caprolactone acrylate (> 0.90 mass fraction purity, CAS RN 110489-05-9, C9H14O4) used in this work was obtained from Scientific Polymer Products, Inc. (Ontario, NY 14519, USA). A component was used without further purification in the experiments. Carbon dioxide (> 0.999 mass fraction purity) was obtained from Deokyang Gases Co. and used as received. The specifications of all chemicals used in the experiment are summarized in Table 1.
3. Results and Discussion
High pressure phase behavior data for the caprolactone acrylate in supercritical carbon dioxide was measured, and the experimental uncertainty was estimated to be ±0.02 MPa and ±0.24 K for a given loading of the cell [15,16]. The standard uncertainties of caprolactone acrylate mole fractions were estimated to be ±0.0025 [17].
Fig. 2 and Table 2 show the experimental pressure-composition (P, x) isotherms at T = (313.2, 333.2, 353.2, 373.2 and 393.2) K, and pressures from (4.21 to 55.93) MPa for the (carbon dioxide + caprolactone acrylate) system. Three phases were not observed at five temperatures.
As shown in Fig. 2, the P-x isotherms are consistent with those expected for a type-I behavior [18,19]. The solubility of carbon dioxide decreases as temperatures shift higher under a constant pressure.
Then, the solubility pressure increases as the temperature increases at the mole fraction of caprolactone acrylate ≥ 0.097.
In this research, the experimental result was correlated with the Peng-Robinson equation of state. The Peng-Robinson equation of state [11] is as follows:
(1)
(2)
(3)
(4) (5)
(
a T) ( ( ) )
P RT
V b V V b b V b
= −
− + + −
( )
0.457235( )
2 2c cT R T
a T p
= α
0.077796 c
c
b RT
= p
( )
T ⎡1(
1 Tr0.5)
⎤2α = + κ −⎣ ⎦
0.37464 1.54226 0.26992 2
κ = + ω − ω
Fig. 1. Schematic of high-pressure apparatus.
Fig. 2. Plot of pressure against mole fraction that compares the experimental data (symbols) of the (carbon dioxide + caprolac- tone acrylate) system. , 313.2 K; , 333.2 K; , 353.2 K;
, 373.2 K; , 393.2 K.
Table 1. Specifications of the chemicals used
Chemical name Mass fraction purity Source CAS RN
CO2 >0.999 Daesung Ind. Gases Co. 124-38-9
Caprolactone acrylate >0.900 Scientific Polymer Products, Inc. 110489-05-9
where Tc, pc, Tr and ω are the critical temperature, critical pres- sure, reduced temperature (T/Tc) and acentric factor of the pure component, respectively. The Peng-Robinson equation of state was used with the following mixing rules:
(6)
(7) (8) (9) In the rule, kij and hij are binary interaction parameters and aii and bii are pure component parameters [11]. Objective function (OBF) and root mean squared relative deviation (RMSD) percent of this calculation are defined by
(10)
(11)
Marquardt [20] was used to optimize the objective function. Table 3 lists the pure component critical temperatures (Tc), critical pres- sures (Pc), and the acentric factors (ω) for carbon dioxide [12], caprolactone acrylate [12] used with the Peng-Robinson equation of state. The boiling points were obtained by the Scientific Polymer Products Co., Ltd. [21]. The property of caprolactone acrylate was calculated by the Joback group-contribution method [12].
Fig. 3 shows the comparison between the experimental results of the (carbon dioxide + caprolactone acrylate) system and calculated values obtained using the Peng-Robinson equation at 353.2 K. The binary interaction parameters of the Peng-Robinson equation of state were fitted with the experimental data at 353.2 K. The optimized
∑∑
= i j i j ij
mix xxa
a
( ) (
1/2 ij)
jj ii
ij aa 1 k
a = −
∑∑
= i j i j ij
mix xxb
b
(
ij)
jj ii
ij=0.5(b +b)1−η b
2
exp
∑
exp ⎟⎟⎠
⎞
⎜⎜
⎝
⎛ −
= N
i
cal
P P OBF P
( )
% OBF 100RMSD = ND ×
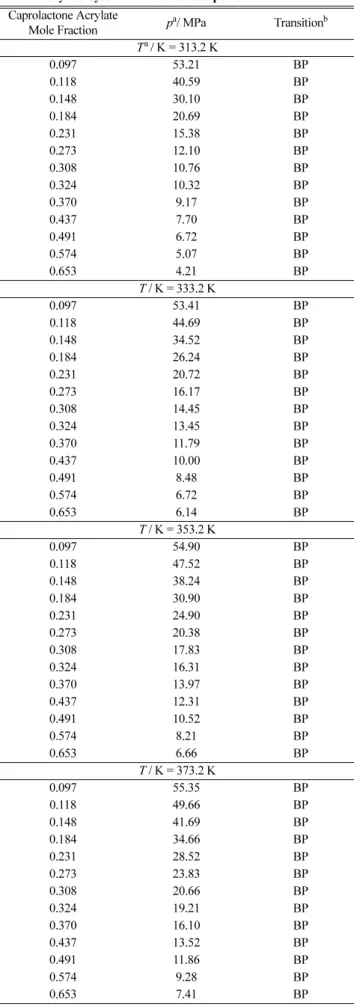
Table 2. Experimental Data for the Carbon Dioxide + Caprolactone Acrylate System. BP is a bubble-point
Caprolactone Acrylate
Mole Fraction pa/ MPa Transitionb Ta / K = 313.2 K
0.097 53.21 BP
0.118 40.59 BP
0.148 30.10 BP
0.184 20.69 BP
0.231 15.38 BP
0.273 12.10 BP
0.308 10.76 BP
0.324 10.32 BP
0.370 9.17 BP
0.437 7.70 BP
0.491 6.72 BP
0.574 5.07 BP
0.653 4.21 BP
T / K = 333.2 K
0.097 53.41 BP
0.118 44.69 BP
0.148 34.52 BP
0.184 26.24 BP
0.231 20.72 BP
0.273 16.17 BP
0.308 14.45 BP
0.324 13.45 BP
0.370 11.79 BP
0.437 10.00 BP
0.491 8.48 BP
0.574 6.72 BP
0.653 6.14 BP
T / K = 353.2 K
0.097 54.90 BP
0.118 47.52 BP
0.148 38.24 BP
0.184 30.90 BP
0.231 24.90 BP
0.273 20.38 BP
0.308 17.83 BP
0.324 16.31 BP
0.370 13.97 BP
0.437 12.31 BP
0.491 10.52 BP
0.574 8.21 BP
0.653 6.66 BP
T / K = 373.2 K
0.097 55.35 BP
0.118 49.66 BP
0.148 41.69 BP
0.184 34.66 BP
0.231 28.52 BP
0.273 23.83 BP
0.308 20.66 BP
0.324 19.21 BP
0.370 16.10 BP
0.437 13.52 BP
0.491 11.86 BP
0.574 9.28 BP
0.653 7.41 BP
Table 2. Continued Caprolactone Acrylate
Mole Fraction pa/ MPa Transitionb T / K = 393.2 K
0.097 55.93 BP
0.118 51.35 BP
0.148 44.31 BP
0.184 37.24 BP
0.231 31.41 BP
0.273 27.07 BP
0.308 22.93 BP
0.324 22.17 BP
0.370 17.93 BP
0.437 14.83 BP
0.491 13.03 BP
0.574 10.38 BP
0.653 7.90 BP
aStandard uncertainties are u(T) = 0.2 K, u(p) = 0.04 MPa and u(x) = 0.0025
bBP: Bubble-point
parameter value of the Peng-Robinson equation of state for the (carbon dioxide + caprolactone acrylate) system was kij = 0.116 and hij = 0.066
(experimental data points: 13; RMSD: 23.9%).
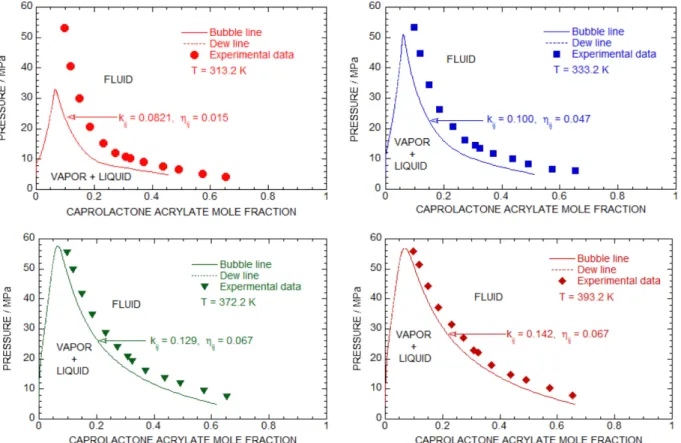
Fig. 4 compares the experimental results with calculated (P-x) isotherms at temperatures of (313.2, 333.2, 373.2 and 393.2) K for the (carbon dioxide + caprolactone acrylate) system using the optimized kij and hij values determined at each temperatures. As shown in Fig.
4, obtained were well-fitted data with the Peng-Robinson equation using adjustable mixture parameters for the (carbon dioxide + caprolactone acrylate) system. The five temperatures using two parameters determined at 353.2 K, RMSD for the (carbon dioxide + caprolactone acrylate) system became too high when the parameters were applied to this system. So it is necessary to obtain the optimized parameters for each temperature to decrease RMSD (see Table 4). The curves calculated by the Peng-Robinson equation of state did not demonstrate three phases at five temperatures. As shown in Fig. 4, it is plotted the pressures against mole fraction in order to compare the experimental data (symbols) of the (carbon dioxide + caprolactone acrylate) system with calculations (solid lines) obtained with the Peng-Robinson equation of state using optimum parameters (kij and ηij) at each temperature. Here, the number for experimental data is 13 at each temperature. In comparison, the experimental data and calculated curve show poor agreement at four
Fig. 4. Plot of the pressure against the mole fraction, comparing the experimental data (symbols) of the (carbon dioxide + caprolactone acry- late) system with calculations (solid lines) obtained with the Peng-Robinson equation of state using optimized kij and ηij at each tem- perature: , 313.2 K; , 333.2 K; , 373.2 K; , 393.2 K.
Fig. 3. Plot of pressure against mole fraction that compares the experi- mental data (symbols) of the (carbon dioxide + caprolactone acrylate) system with calculation obtained from the Peng-Rob- inson equation of state with kij and ηij set equal to zero (blue solid lines), kij = 0.065, ηij = 0.045 (carbon dioxide + caprolac- tone acrylate) (red solid lines) at 353.2 K.
Table 3. The properties of pure component in carbon dioxide and caprolactone acrylate
Compounds Mw Chemical Structure Tb / K Tc / K pc / MPa ω
Carbon Dioxide 44.01 O=C=O 304.2 7.38 0.225
Caprolactone Acrylate 345.41 C17H28O7 539.2a 663.4 1.45 1.149
aScientific Polymer Products Co., Ltd.
temperatures. This poor agreement is due to error of boiling point and critical properties. According to the calculated result, the critical mixture curve showed type-I.
4. Conclusions
The P-x isotherm data of (carbon dioxide + caprolactone acrylate) system was studied using a variable-volume view cell with static- type apparatus. Phase equilibrium data was measured in synthetic method in a temperatures of (313.2 ≤ T ≤ 393.2) K and pressures of (4 < P < 56) MPa. The (carbon dioxide + caprolactone acrylate) mixtures did not exhibit three phases at five temperatures. The Peng- Robinson equation of state is capable of properly predicting the phase behavior for the system using two temperature-independent mixture interaction parameters. The agreement between calculated and experimental curves was poor for using two optimized parameters obtained with the Peng-Robinson equation of state at each temperature.
The linear curves for two binary interaction parameters (kij and ηij) against the temperatures show reasonable tendency.
Acknowledgments
This research was supported by Basic Science Research Program through the National Research Foundation of Korea (NRF) funded by the Ministry of Education (Grant No. NRF-2016R1D1A1B04931921).
Nomenclatures
a, b : parameter in the Peng-Robinson equation of state
k : binary interaction parameter in the Peng-Robinson equation of state
P : pressure [MPa]
T : temperature [K]
R : universal gas constant x : mole fraction of liquid V : molar volume [cm3/mol]
Greek letters
α : parameter in the Peng-Robinson equation of state κ : parameter in the Peng-Robinson equation of state
η : binary interaction parameter in the Peng-Robinson equation of state
ω : acentric factor Subscripts
i, j : component identifiers c : critical property r : reduced property mix : mixture exp : experiment cal : calculation
References
1. https://www.ulprospector.com/en/la/Adhesives/Detail/2097/46197/
SR495B
2. Yeo, S. D. and Kiran, E., “Formation of Polymer Particles with Supercritical Fluids: A Review,” J. of Supercritical Fluids, 34, 287-308(2005).
3. McHugh, M. A. and Krukonis, V. J., Supercritical Fluid Extraction, 2nd ed., Butterworth-Heinemann, Stoneham, 1994.
4. Yim, J. H., Choo, Y. S. and Byun, H. S., “Phase Behaviour for the (CO2+1-butyl-2-pyrrolidone) and (CO2+1-octyl-2-pyrrolidone) Sys- tems at Temperatures from (313.2 to 393.2) K and Pressures up to 28 MPa,” J. of Chemical Thermodynamics, 130, 140-146(2019).
5. Cho, S. H., Lee, B. S. and Byun, H. S., “Phase Behaviors for the Tetrahydrofurfuryl Methacrylate and Poly(tetrahydrofurfuryl methac- rylate) in Supercritical Carbon Dioxide,” J. of CO2 Utilization, 25, 39-45(2018).
6. Lee, H., Jeong, J. D. and Byun, H. S., “Phase Equilibrium of Binary Mixture for the (Carbon Dioxide + 1-Phenyl-2-Pyrrolidone) Sys- tem at High Pressure,” Korean Chemical Engineering Research, 56(5), 732-737(2018).
7. Byun, H. S. and Rhee, S. Y., “Phase Equilibria Measurement of Binary Mixtures for Triethylene Glycol Dimethacrylate and Triethylene Glycol Diacrylate in Supercritical CO2,” Korean J. of Chemical Engineering, 34(4), 1170-1176(2017).
8. Yoon, Y. D. and Byun, H. S., “Experimental Measurement and Correlation of Phase Behavior for the CO2 + Heptafluorobutyl Acrylate and CO2 + Heptafluorobutyl Methacrylate Systems at High Pressure,” Korean J. of Chemical Engineering, 31, 522-527 (2014).
9. Cho, D. W., Shin, J., Bae, W., Kim, H., Lee, J. H. and Shin, M. S.,
“High-pressure Phase Behavior of Tri-ethylene Glycol Dimethac- rylate and Tetra-ethylene Glycol Dimethacrylate in Supercritical Carbon Dioxide,” Fluid Phase Equilibria, 319, 37-41(2012).
10. Jang, Y. S., Kim, S. H., Yoo, K. P. and Byun, H. S., “Phase Behav- ior Measurement for the Binary Mixture of CO2+ Neopentyl Glycol Diacrylate and CO2+ Neopentyl Glycol Dimethacry- late Systems at High Pressure,” Fluid Phase Equilibria, 302, 234-240(2011).
11. Peng, D. Y. and Robinson, D. B., “A New Two-Constant Equation of State,” Ind. Eng. Chem. Fundam., 15, 59-63(1976).
12. Poling, B. E., Prausnitz, J. M. and O’Connell, J. P., The Properties of Liquids and Gases, 5thed., McGraw-Hill, New York, 2001.
13. Lee, B. S., Yeo, W. H. and Byun, H. S., “Phase Behavior for the Poly(phenyl methacrylate) and Phenyl Methacrylate in Supercritical Carbon Dioxide and Dimethyl Ether,” J. Chem. Eng. Data, 62, Table 4. Data of kij and ηij parameters and the value of RMSD against
temperature for the (carbon dioxide + caprolactone acrylate) system with the Peng-Robinson equation of state
T / K kij ηij RMSD (%)
313.2 0.0821 0.015 -
333.2 0.100 0.047 -
353.2 0.116 0.066 29.8
373.2 0.129 0.067 25.7
393.2 0.142 0.067 18.7
1876-1883(2017).
14. Byun, H. S., “Phase Equilibria Measurement of Binary Mixture for the Propoxylated Neopentyl Glycol Diacrylate in Supercritical Carbon Dioxide,” Korean Chemical Engineering Research, 54, 206-212(2016).
15. Chirico, R. D., Frenkel, M., Diky, V. V., Marsh, K. N. and Wil- hoit, R. C., “ThermoML-An XML-Based Approach for Storage and Exchange of Experimental and Critically Evaluated Ther- mophysical and Thermochemical Property Data. 2. Uncertain- ties,” J. of Chemical Engineering Data, 48, 1344-1359(2003).
16. Yoon, S. D. and Byun, H. S., “Phase Behaviour for the (Carbon Dioxide + 1,3-Butanediol Diacrylate) and (Carbon Dioxide +1,3- Butanediol Dimethacrylate) Systems at Elevated Pressures and
Temperatures,” J. of Chemical Thermodynamics, 71, 91-97(2014).
17. Jang, Y. S. and Byun, H. S., “Cloud-Point and Bubble-Point Mea- surement for the Poly(2-butoxyethyl acrylate) + Cosolvent Mixture and 2-Butoxyethyl Acrylate in Supercritical Fluid Solvents,” J.
of Chemical and Engineering Data, 59, 1391-1399(2014).
18. Scott, R. L. and van Konynenburg, P. B., “Static Properties of Solu- tions — van der Waals and Related Models for Hydrocarbon Mixtures,” Discuss. Faraday Soc., 49, 87-97(1970).
19. Rowlinson, J. S. and Swinton, F. L., Liquid and Liquid Mixtures, 3rd ed., Butterworth, Boston, 1982.
20. Kuester, J. L. and Mize, J. H., Optimization Techniques with Fortran, McGraw-Hill, New York, 1973.
21. https://scientificpolymer.com/shop/caprolactone-acrylate-2/.