D I A B E T E S & M E T A B O L I S M J O U R N A L
This is an Open Access article distributed under the terms of the Creative Commons Attribution Non-Commercial License (https://creativecommons.org/licenses/by-nc/4.0/) which permits unrestricted non-commercial use, distribution, and reproduction in any medium, provided the original work is properly cited.
Sex-, Age-, and Metabolic Disorder-Dependent
Distributions of Selected Inflammatory Biomarkers among Community-Dwelling Adults
So Mi Jemma Cho1,2, Hokyou Lee2,3, Jee-Seon Shim4, Hyeon Chang Kim2,4
Departments of 1Public Health, 2Preventive Medicine, 3Internal Medicine, 4Cardiovascular and Metabolic Diseases Etiology Research Center, Yonsei University College of Medicine, Seoul, Korea
Background: Inflammatory cytokines are increasingly utilized to detect high-risk individuals for cardiometabolic diseases. How- ever, with large population and assay methodological heterogeneity, no clear reference currently exists.
Methods: Among participants of the Cardiovascular and Metabolic Diseases Etiology Research Center cohort, of community- dwelling adults aged 30 to 64 without overt cardiovascular diseases, we presented distributions of tumor necrosis factor (TNF)-α and -β, interleukin (IL)-1α, -1β, and 6, monocyte chemoattractant protein (MCP)-1 and -3 and high sensitivity C-reactive protein (hsCRP) with and without non-detectable (ND) measurements using multiplex enzyme-linked immunosorbent assay. Then, we compared each markers by sex, age, and prevalence of type 2 diabetes mellitus, hypertension, and dyslipidemia, using the Wilcox- on Rank-Sum Test.
Results: In general, there were inconsistencies in direction and magnitude of differences in distributions by sex, age, and preva- lence of cardiometabolic disorders. Overall, the median and the 99th percentiles were higher in men than in women. Older par- ticipants had higher TNF-α, high sensitivity IL-6 (hsIL-6), MCP-1, hsCRP, TNF-β, and MCP-3 median, after excluding the NDs.
Participants with type 2 diabetes mellitus had higher median for all assayed biomarkers, except for TNF-β, IL-1α, and MCP-3, in which the medians for both groups were 0.00 due to predominant NDs. Compared to normotensive group, participants with hy- pertension had higher TNF-α, hsIL-6, MCP-1, and hsCRP median. When stratifying by dyslipidemia prevalence, the comparison varied significantly depending on the treatment of NDs.
Conclusion: Our findings provide sex-, age-, and disease-specific reference values to improve risk prediction and diagnostic per- formance for inflammatory diseases in both population- and clinic-based settings.
Keywords: Biomarkers; Cardiovascular diseases; Inflammation; Metabolic diseases
Corresponding author: Hyeon Chang Kim https://orcid.org/0000-0001-7867-1240 Department of Preventive Medicine, Yonsei University College of Medicine, 50-1 Yonsei-ro, Seodaemun-gu, Seoul 03722, Korea
E-mail: [email protected]
INTRODUCTION
The utility of inflammatory biomarker assays for detecting in- dividuals at high-risk for cardiovascular and metabolic diseas- es has become increasingly prevalent in clinical and research settings [1-5]. In adjunct to the conventional chemistry and imaging tests, these biomarkers aid in predicting or diagnosing cardiovascular and metabolic diseases in the context of an ap-
propriate clinical presentation [6-8].
Considering that the major contribution of inflammatory mechanisms to cardiometabolic diseases has been repeatedly emphasized, many efforts are continuously being made to dis- cover novel markers and assay methodologies. In particular, cytokines/chemokines are critical in homeostatic trafficking and positioning of immune cells in response to inflammation [9-11]; they trigger and modify intracellular signaling path- https://doi.org/10.4093/dmj.2019.0119
pISSN 2233-6079 · eISSN 2233-6087
ways, thereby orchestrating innate and adaptive immune re- sponses [12].
Of many, interleukin (IL), monocyte chemotactic proteins (MCP) and tumor necrosis factors (TNF) are critical to macro- phagic inhibition [13]. They activate growth factors, stimulate procoagulant activity, and suppress antithrombotic pathways in endothelial cells [6]. By measuring their expression in athero- sclerotic lesions, previous studies have observed the association between the aforementioned biomarkers and cardiometabolic outcomes, such as type 2 diabetes mellitus (T2DM), myocardial infarction (MI) and more [14-16]. However, particularly with the advent of newer assay methodologies and large population heterogeneity, no clear consensus exists regarding the universal reference range. Moreover, little is known about the distribution of these biomarkers across healthy community population.
To address this knowledge gap, the objective of this study was to determine distributions of selected inflammatory bio- markers among middle-aged Koreans. Then, we compared their descriptive statistics by sex, age, and metabolic disorders, including T2DM, hypertension and dyslipidemia.
METHODS
Approvals and participant consent
As part of the ethical committee process, the Cardiovascular and Metabolic Diseases Etiology Research Center (CMERC) Study has been approved by the Institutional Review Boards of Severance Hospital, Yonsei University Health System, Seoul, Korea (4-2013-0661) and Ajou University Hospital, Suwon, Korea (AJIRB-BMR-SUR-13-272). Written informed consent has been obtained from all participants prior to the baseline survey. Participants were ensured that they can withdraw from the study at any time, regardless of its cause, without any reper- cussions.
Study population
The CMERC cohort is a multi-centered, prospective, observa- tional study of community-dwelling population residing in Seoul and capital regions in Republic of Korea [17]. The par- ticipants are between the age of 30 to 64 years and without his- tory overt cardiovascular diseases (CVDs), recent history of malignant cancer and autoimmune or chronic inflammatory diseases. In the present study, among 8,108 participants who have undergone baseline examination between 2013 and 2018, 4,058 participants (excluding two with missing variables) from
Center 1 underwent high sensitivity C-reactive protein (hsCRP) measurements. Among them, a random subset of participants enrolled between 2013 to 2015 underwent additional measure- ments via multiplex enzyme-linked immunosorbent assay (ELISA) assay, including TNF-α, TNF-β, IL-1α, IL-1β, hsIL- 1β, IL-6, hsIL-6, MCP-1, and MCP-3. The varying number of measurements for each biomarker was due to different num- ber of non-detectable (ND) measurements, requiring higher sensitivity analyses.
Data collection
Overnight-fasting blood samples were obtained in the morn- ing. All biomarker assays were performed in accordance to standard protocols at a single laboratory (Seoul Clinical Labo- ratory R&D Center, Seoul, Korea).
hsCRP
We collected bubble-free serum samples in plastic containers and allowed them to clot for at least 30 minutes before centrif- ugation for 10 minutes at 1,000×g. Then, we aliquot and stored the samples below –20°C. During the sample preparation, we allowed all regents to warm to room temperature, premixed beat bottle for 30 seconds, vortexed for 1 minute and centri- fuged thoroughly prior to use. No samples were frozen nor thawed for multiple times.
The samples were measured by the immunoturbidimetric CRP-N Assay LA CRP-S Nittobo D-Type high sensitive assay (Nittobo, Tokyo, Japan). The samples were loaded and mea- sured using the latex-enhanced nephelometry technique on an automated analyzer ADVIA 1800 Chemistry System (Siemens Medical Sol., Malvern, PA, USA). The assays were based on the principle of particle-enhanced immunological agglutination method with a commercial test kit (N assay LA, CRP-S, Nitto- bo). A human CRP calibrator N assay LA CRP-S multi-point was employed to delineate the calibration curve.
The lower and upper detection limits of the hsCRP assay were 0.02 and 40 mg/dL, respectively. The functional sensitivi- ty of the hsCRP assay was 0.45 mg/dL. To calculate intra-assay variability, we repeated the pool serum assay 20 times; the ab- sorbance coefficient variability was less than 5%. Measurement was done in duplicates and any duplicates that were not within a three assay standard deviation from one another were re-run.
Cytokines and chemokines
The sample collection and preparation methods are the same
as the aforementioned hsCRP assay. We quantitatively deter- mined the steady state level of the circulating inflammatory cytokines/chemokines of interest: TNF-α, TNF-β, IL-1α, IL- 1β, IL-6, MCP-1, and MCP-3. Their serum concentrations were measured using a Milliplex MAP Human Cytokine/Che- mokine Multiplex Bead-based kit (Millipore, Burlington, MA, USA), with a 38-plex (HMCP3-MAG, HIL1A-MAG, HCY- IL1B-MAG, HCYIL6-MAG, HCYMCP1-MAG, HCYTNFA- MAG, HTNFB-MAG) Millipore Human Cytokine Panel Kits.
Specifically, 25 μL of serum was incubated with fluorescently labeled capture antibody-coated beads in a 96-well filter bot- tomed plate on a plate shaker overnight at 4°C. After incuba- tion, the sample bead mix was removed, and the plate was washed two times using a vacuum manifold. The beads were resuspended in sheath fluid for 5 minutes on the plate shaker.
Distinctly colored bead sets of 500 5.6-Nm polystyrene micro- spheres or 80 6.45-μm magnetic microspheres were created, each of which was coated with a distinctive capture antibody.
After an analyte from the sample was captured by the bead, a biotinylated detection antibody was introduced and incubated on a plate shaker at room temperature for 30 minutes. The re- action mixture was incubated with streptavidin-phycoerythrin (Streptavidin-PE) conjugate to complete the reaction on the surface of each microsphere.
The Luminex Bio-Plex 100 analyzer (MAGPIX) identified individual microsphere, and the results were quantified based on fluorescent reporter signals using Luminex xPONENT ac- quisition software, Milliplex Analyst 5.1. We analyzed the me- dian fluorescence intensity (MFI) using a 5-parameter logistic or spline curve-fitting method to calculate cytokine/chemo- kines concentrations in each sample. The Luminex MAGPIX instrument was calibrated with the MAGPIX Calibration Kit (EMD Millipore Catalog #40-049), and the performance was verified with the MAGPIX Performance Verification Kit (EMD Millipore Catalog #40-050).
All assays were performed by the same operator according to the manufacturers’ instructions. For quality assurance, each sample was run twice, and the mean derived for each sample was used as the index value. Additionally, we reconstituted two kit-supplied quality control (#1, 2) with 250 μL of deionized water to run on each plate in duplicate. After inverting the vial several times, we allowed the vial to sit for 5 to 10 minutes, and then transferred the controls to appropriately labeled polypro- pylene microfuge tubes. We confirmed the samples to fall within the expected range in accordance with the kit-specific
protocols provided by Millipore. Less than 0.5% cross-reactivi- ty and interference were observed.
High sensitivity cytokines
The sample collection and preparation methods are the same as the aforementioned cytokine/chemokine assay. Here, the samples underwent a 2-fold dilution, maintaining a 125 μL of sample and 125 μL of Calibrator Diluent RD6-40 ratio, respec- tively.
We quantitatively determined the steady state level of the circulating inflammatory cytokines of interest: hsIL-1 and hsIL-6. Their serum concentrations were modulated using Milliplex MAP Human High Sensitivity Cytokine/Chemokine Base kit A (Millipore, Billerica, Burlington, USA) on a 96-well filter bottomed plate. Analyte-specific antibodies were pre- coated onto color-coded magnetic microparticles. Microparti- cles, standards, and samples were pipetted into wells, and the immobilized antibodies captured the analytes of interest. After washing away unbound substances, corresponding biotinylat- ed antibody cocktail was added to each well. After a thorough wash, Streptavidin-PE conjugate was added to each well. A fi- nal wash removed residual unbound conjugate, and the mic- roparticles were resuspended in buffer. The Luminex Bio-Plex 100 analyzer (MAGPIX) identified individual microsphere, and the results were quantified based on fluorescent reporter signals within 90 minutes of the run. The results were analyzed using Luminex xPONENT acquisition software, Milliplex An- alyst 5.1.
To calculate a 4-fold dilution for the remaining levels, we re- ferred to the standard concentrations provided by the manu- facturer. We averaged the duplicate reading for each standard and sample, and subtracted the average blank MFI using a 5-parameter spline curve-fitting method. Since the samples were diluted, the concentration read from the standard curve were multiplied by the corresponding dilution factor. The Lu- minex MAGPIX instrument was calibrated with the MAGPIX Calibration Kit (EMD Millipore Catalog #40-049), and its per- formance was verified with the MAGPIX Performance Verifi- cation Kit (EMD Millipore Catalog #40-050).
Similar to the aforementioned cytokine and chemokine as- say, we employed the manufacturer-recommended quality control (#11). Likewise, less than 0.5% cross-reactivity and in- terference were observed.
Data for each kit was analyzed with strict adherence to the manufacturers’ guidelines. The proportion of the samples that
had both readings within the accepted recovery range (between 70% and 130%) was determined. The reproducibility of the dif- ferent multiplex methods was evaluated by describing the lim- its of agreement between duplicates in range for each combina- tion of method and analyte using the Bland-Altman test.
Type 2 diabetes mellitus
Fasting plasma glucose levels were measured using colorime- try method (ADVIA1800 Auto Analyzer; Siemens Medical Sol.), and glycosylated hemoglobin (HbA1c) measurements were obtained via high-performance liquid chromatography (Variant II Turbo Hemoglobin Testing System; Bio-Rad., Her- cules, CA, USA). T2DM was defined based on the Korean Clinical Practice Guidelines for T2DM [18]: participants with fasting glucose level ≥126 mg/dL, HbA1c ≥6.5% or current use of oral glucose-lowering drugs or insulin injection were considered to have T2DM.
Hypertension
Blood pressure was measured using a single-arm automated oscillometric device (HEM-7080; Omron Health, Matsusaka, Japan). Information regarding hypertension treatment was ob- tained via self-report. Hypertension was defined according to the 2013 Korean Society of Hypertension guidelines for the management of hypertension [19], equivalent to the Eight Joint National Committee guidelines [20]: participants with a mean systolic blood pressure (SBP) ≥140 mm Hg, diastolic blood pressure (DBP) ≥90 mm Hg or currently using antihy- pertensive medications were considered to have hypertension.
Dyslipidemia
Total cholesterol (TC), triglycerides (TG), high-density lipo- protein cholesterol (HDL-C), and low-density lipoprotein cho- lesterol (LDL-C) levels were analyzed enzymatically with an ADVIA 1800 Auto Analyzer. Dyslipidemia was defined based on the Korean Dyslipidemia Diagnosis criteria [21], equivalent to Adult Treatment Panel III (ATP III) guidelines [22]. Hyper- cholesterolemia was defined as TC ≥240 mg/dL; hypertriglyc- eridemia was defined as TG ≥200 mg/dL; hypoalphalipopro- teinemia was defined as HDL-C <40 mg/dL; hyper-LDL-cho- lesterolemia was defined as LDL-C ≥160 mg/dL. Having any one type of the aforementioned cholesterol abnormality or current intake of lipid-lowering was regarded as prevalent dys- lipidemia.
Statistical analysis
We defined the minimum, median, 75th, 90th, 95th, 99th per- centile, maximum and mean levels for each biomarker using a non-parametric procedure. We presented distribution statistics of each inflammatory marker with and without NDs below the mechanical detection threshold. We additionally stratified by sex, age, T2DM, hypertension and dyslipidemia prevalence, and compared using Wilcoxon rank-sum test. No detectable outliers were excluded in the analysis to preserve the natural integrity of the cohort characteristics. All statistical analyses were performed using SAS version 9.4 (SAS Institute Inc., Cary, NC, USA).
RESULTS
A total of 4,058 participants underwent hsCRP measurements between 2013 and 2018 (Fig. 1). Among them, 1,285 partici- pants whom enrolled in the CMERC study between 2013 and 2015, also underwent TNF-α, IL-1α, IL-1β, IL-6, and MCP-1 and three measurements. Additionally, we assayed hsIL-6 and hsIL-1β from 819 participants and TNF-β from 466 partici- pants. TNF-α, IL-1α, IL-1β, IL-6, and MCP-3 had varying number of NDs.
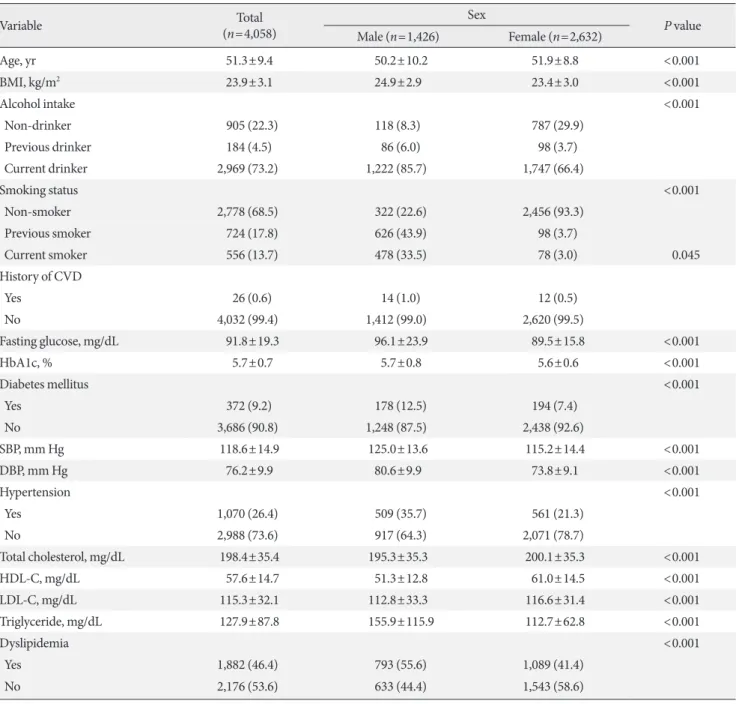
At baseline, 35.1% of the participants were male, with mean age of 51.3 years (Table 1). In terms of prevalence of cardio- metabolic disorder, 372 participants had T2DM (9.2%), 1,070 participants had hypertension (26.4%) and 1,882 participants had dyslipidemia (46.4%). Lifestyle factors (i.e., current smok- ing and drinking status), anthropometric measurements (i.e.
body mass index) and biomarkers related to CVD risk differed significantly by sex.
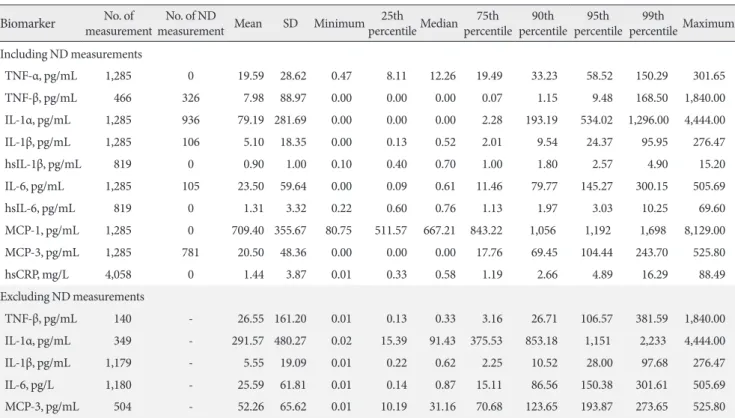
Table 2, Supplementary Tables 1-4, and Supplementary Figs 1-15 illustrate the distribution of each inflammatory biomark- er, including and excluding NDs. Five biomarkers had varying proportion of NDs: TNF-β (70.0%), IL-1α (72.8%), IL-1β (8.3%), IL-6 (8.2%), and MCP-3 (60.8%). In general, the de- scriptive statistics with and without NDs were different when comparing their respective median and upper percentiles. The overall skewedness to right primarily resulted from upper out- liers and zero coding of the NDs.
Table 3 illustrates the Spearman’s rank correlation coeffi- cient. Overall, the markers showed weak to moderate positive association among each other. The exceptions are as follows:
MCP-1 and TNF-β (r=–0.13), IL-1α and hsIL-6 (r=–0.04), and MCP-1 and MCP-3 (r=–0.01) showed weak yet negative
associations, which persisted even after excluding NDs.
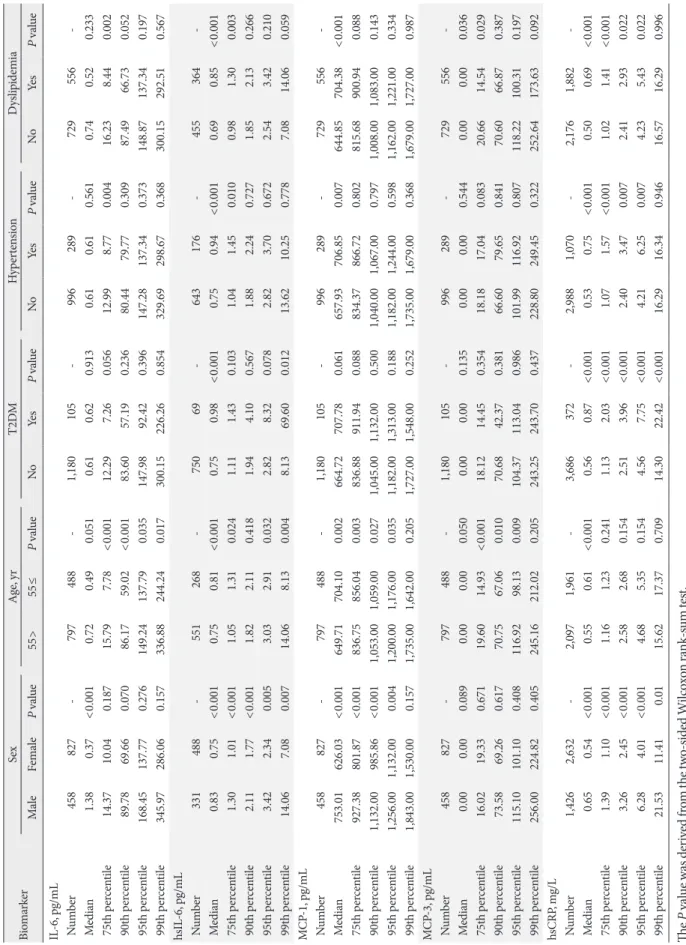
For all biomarkers, the median and the 99th percentiles were higher in male than in female regardless of NDs (Tables 4 and 5). For example, the median and the 99th percentile IL-6 values were 1.38 and 345.97 pg/mL in male and 0.37 and 280.06 pg/
mL in female, respectively (P<0.001). Such sex-difference ex- tended in high sensitivity analysis, where the median and the 99th percentile hsIL-6 values were 0.83 and 14.06 pg/mL in men and 0.75 and 7.08 pg/mL in women, respectively. Other
IL, TNF and MCP subtypes demonstrated similar trend.
When stratifying by the population median age of approxi- mately 55 years, the older group had significantly higher hsIL- 6, MCP-1 and hsCRP median (Tables 4 and 5). In contrast, the median value for hsIL-1β was higher in the younger group.
Furthermore, the 99th percentile value for hsIL-6 was also markedly higher in the younger group, even after excluding the NDs.
The distributions of the examined markers differed by the presence of each cardiometabolic disorder. Participants with T2DM had higher median for all assayed biomarkers, except for TNF-β, IL-1α, and MCP-3, in which the medians for both groups were 0.00 due to predominant NDs (Table 4). However, when excluding the NDs, the medians for IL-1α and MCP-3 were lower in participants with T2DM than their counterpart (35.24 pg/mL vs. 103.37 pg/mL and 29.85 pg/mL vs. 31.34 pg/
mL, respectively), but the differences were statistically insignif- icant (Table 5). The 99th percentile values for TNF-β, IL-1α, IL-1β, hsIL-1β, hsIL-6, and hsCRP were higher in participants with T2DM, when considering NDs into account.
Compared to the normotensive group, participants with hy- pertension had higher median TNF-α, hsIL-6, MCP-1, and hsCRP and 99th percentile TNF-β, MCP-3, and hsCRP values.
These differences generally persisted even after excluding NDs.
Participants with elevated lipid levels had higher median TNF-α, IL-1β, hsIL-1β, hsIL-6, MCP-1, and hsCRP values than those within normal cholesterol range. However, when examining distributions without NDs, participants without dyslipidemia had higher median TNF-β, IL-1α, IL-6, and MCP-3 levels. In terms of the 99th percentile, participants with dyslipidemia had higher IL-1α, hsIL-1β, hsIL-6, and MCP-1 levels, and such difference remained after excluding NDs.
DISCUSSION
In this middle-aged community-dwelling Korean population, we presented the distributions of varying groups of inflamma- tory biomarkers, which were distinctive by sex, age and preva- lence of cardiometabolic disorders. No explicit recommenda- tions nor universal reference range currently exist for these cy- tokines/chemokines, owing to insufficient evidence from the general population. Without existing manufacturer-recom- mended 99th percentile nor referent range, we illustrated their distributions detected in relatively healthy population without any data refinement. These results have important clinical im- Fig. 1. Flow diagram of the study inclusion criteria. CMERC,
Cardiovascular and Metabolic Disease Etiology Research Cen- ter; TNF, tumor necrosis factor; IL, interleukin; hsIL, high sen- sitivity interleukin; MCP, monocyte chemoattractant protein;
hsCRP, high sensitivity C-reactive protein.
8,108 CMERC participants, 2013−2018
4,060 Study center 1 participant
4,048 Study center 2 participants without inflammatory biomarker measurements
Participants with missing measurement on
select inflammatory biomarkers:
2,775 TNF-α 3,594 TNF-β 2,775 IL-1α 2,775 IL-1β 3,241 hsIL-1β 2,775 IL-6 3,241 hsIL-6 2,775 MCP-1 2,775 MCP-3 2 hsCRP Participants with measurement
on select inflammatory biomarkers:
1,285 TNF-α 466 TNF-β 1,285 IL-1α 1,285 IL-1 β 819 hsIL-1β 1,285 IL-6 819 hsIL-6 1,285 MCP-1 1,285 MCP-3 4,058 hsCRP
Table 1. General characteristics of the study participants by sex (n=4,058)
Variable Total
(n=4,058)
Sex P value
Male (n=1,426) Female (n=2,632)
Age, yr 51.3±9.4 50.2±10.2 51.9±8.8 <0.001
BMI, kg/m2 23.9±3.1 24.9±2.9 23.4±3.0 <0.001
Alcohol intake <0.001
Non-drinker 905 (22.3) 118 (8.3) 787 (29.9)
Previous drinker 184 (4.5) 86 (6.0) 98 (3.7)
Current drinker 2,969 (73.2) 1,222 (85.7) 1,747 (66.4)
Smoking status <0.001
Non-smoker 2,778 (68.5) 322 (22.6) 2,456 (93.3)
Previous smoker 724 (17.8) 626 (43.9) 98 (3.7)
Current smoker 556 (13.7) 478 (33.5) 78 (3.0) 0.045
History of CVD
Yes 26 (0.6) 14 (1.0) 12 (0.5)
No 4,032 (99.4) 1,412 (99.0) 2,620 (99.5)
Fasting glucose, mg/dL 91.8±19.3 96.1±23.9 89.5±15.8 <0.001
HbA1c, % 5.7±0.7 5.7±0.8 5.6±0.6 <0.001
Diabetes mellitus <0.001
Yes 372 (9.2) 178 (12.5) 194 (7.4)
No 3,686 (90.8) 1,248 (87.5) 2,438 (92.6)
SBP, mm Hg 118.6±14.9 125.0±13.6 115.2±14.4 <0.001
DBP, mm Hg 76.2±9.9 80.6±9.9 73.8±9.1 <0.001
Hypertension <0.001
Yes 1,070 (26.4) 509 (35.7) 561 (21.3)
No 2,988 (73.6) 917 (64.3) 2,071 (78.7)
Total cholesterol, mg/dL 198.4±35.4 195.3±35.3 200.1±35.3 <0.001
HDL-C, mg/dL 57.6±14.7 51.3±12.8 61.0±14.5 <0.001
LDL-C, mg/dL 115.3±32.1 112.8±33.3 116.6±31.4 <0.001
Triglyceride, mg/dL 127.9±87.8 155.9±115.9 112.7±62.8 <0.001
Dyslipidemia <0.001
Yes 1,882 (46.4) 793 (55.6) 1,089 (41.4)
No 2,176 (53.6) 633 (44.4) 1,543 (58.6)
Values are presented as mean±standard deviation or number (%). P value was derived from the independent t-test, the Wilcoxon rank-sum test, or chi-square test.
BMI, body mass index; CVD, cardiovascular disease; HbA1c, glycosylated hemoglobin; SBP, systolic blood pressure; DBP, diastolic blood pres- sure; HDL-C, high-density lipoprotein cholesterol; LDL-C, low-density lipoprotein cholesterol.
plications that are almost certainly relevant to the application of all modern multiplex assays to both epidemiologic and clin- ical studies.
hsCRP
Previous literature in this field has noted heterogeneous distri-
butions and reference ranges derived from their own study population. In a Chinese population, the median hsCRP was 0.99 mg/L in the middle-aged group and 1.76 mg/L in the el- derly group without gender difference [23]. In a Thai adult population, the hsCRP concentration ranged from 0.2 to 7.9 mg/L without significant sex- nor age-differences [24]. Despite
the different numerical range, our hsCRP measurements uni- formly demonstrated significant right-skewed distribution, with older and participants with any of the cardiometabolic
disorders embodying higher median. hsCRP is known to in- crease with wide range of both acute and chronic infections, tissue necrosis, neoplasia, insulin resistance, obesity, smoking, Table 2. Distribution of inflammatory biomarkers in total participants (n=4,058)
Biomarker measurementNo. of No. of ND
measurement Mean SD Minimum 25th percentile Median 75th
percentile 90th
percentile 95th
percentile 99th
percentile Maximum Including ND measurements
TNF-α, pg/mL 1,285 0 19.59 28.62 0.47 8.11 12.26 19.49 33.23 58.52 150.29 301.65
TNF-β, pg/mL 466 326 7.98 88.97 0.00 0.00 0.00 0.07 1.15 9.48 168.50 1,840.00
IL-1α, pg/mL 1,285 936 79.19 281.69 0.00 0.00 0.00 2.28 193.19 534.02 1,296.00 4,444.00
IL-1β, pg/mL 1,285 106 5.10 18.35 0.00 0.13 0.52 2.01 9.54 24.37 95.95 276.47
hsIL-1β, pg/mL 819 0 0.90 1.00 0.10 0.40 0.70 1.00 1.80 2.57 4.90 15.20
IL-6, pg/mL 1,285 105 23.50 59.64 0.00 0.09 0.61 11.46 79.77 145.27 300.15 505.69
hsIL-6, pg/mL 819 0 1.31 3.32 0.22 0.60 0.76 1.13 1.97 3.03 10.25 69.60
MCP-1, pg/mL 1,285 0 709.40 355.67 80.75 511.57 667.21 843.22 1,056 1,192 1,698 8,129.00
MCP-3, pg/mL 1,285 781 20.50 48.36 0.00 0.00 0.00 17.76 69.45 104.44 243.70 525.80
hsCRP, mg/L 4,058 0 1.44 3.87 0.01 0.33 0.58 1.19 2.66 4.89 16.29 88.49
Excluding ND measurements
TNF-β, pg/mL 140 - 26.55 161.20 0.01 0.13 0.33 3.16 26.71 106.57 381.59 1,840.00
IL-1α, pg/mL 349 - 291.57 480.27 0.02 15.39 91.43 375.53 853.18 1,151 2,233 4,444.00
IL-1β, pg/mL 1,179 - 5.55 19.09 0.01 0.22 0.62 2.25 10.52 28.00 97.68 276.47
IL-6, pg/L 1,180 - 25.59 61.81 0.01 0.14 0.87 15.11 86.56 150.38 301.61 505.69
MCP-3, pg/mL 504 - 52.26 65.62 0.01 10.19 31.16 70.68 123.65 193.87 273.65 525.80
ND, non-detectable; SD, standard deviation; TNF, tumor necrosis factor; IL, interleukin; hsIL, high sensitivity interleukin; MCP, monocyte che- moattractant protein; hsCRP, high sensitivity C-reactive protein.
Table 3. Spearman’s correlation among inflammatory biomarkers (n=4,058)
Biomarker TNF-α TNF-β IL-1α IL-1β hsIL-1β IL-6 hsIL-6 MCP-1 MCP-3 hsCRP
TNF-α 1.00 0.03 0.30c 0.26c 0.21c 0.46c 0.14c 0.32c 0.28c 0.19c
TNF-β 0.43c 1.00 0.25c 0.26c NA 0.27c NA –0.13b 0.35c 0.03
IL-1α 0.27c 0.11 1.00 0.44c 0.01 0.48c –0.04 0.03 0.29c 0.01
IL-1β 0.30c 0.42c 0.31c 1.00 0.23c 0.42c 0.10b 0.12c 0.43c 0.04
hsIL-1β 0.21c NA –0.06 0.23c 1.00 0.10b 0.45c 0.17c 0.06 0.11b
IL-6 0.47c 0.39c 0.38c 0.42c 0.04 1.00 0.15c 0.12c 0.39c 0.15c
hsIL-6 0.14c NA –0.01 0.10b 0.45c 0.10b 1.00 0.21c 0.01 0.41c
MCP-1 0.32c 0.16 0.12a 0.15c 0.17c 0.11b 0.21c 1.00 –0.01 0.13c
MCP-3 0.35c 0.48c 0.30c 0.59c 0.04 0.33c –0.01 0.10a 1.00 0.05
hsCRP 0.19c 0.16 –0.01 0.03 0.11b 0.14c 0.41c 0.13c 0.06 1.00
The correlation coefficient was obtained from Spearman's rank correlation. The upper right coefficients are obtained from biomarkers including non-detectable (ND) measurements. The lower left coefficients are obtained from biomarkers excluding ND measurements.
TNF, tumor necrosis factor; IL, interleukin; hsIL, high sensitivity interleukin; MCP, monocyte chemoattractant protein; hsCRP, high sensitivity C-reactive protein; NA, not available.
aP<0.05, bP<0.01, cP<0.001.
Table 4. Distribution of inflammatory biomarkers by sex, age, and prevalence of type 2 diabetes mellitus, hypertension and dyslipidemia, including NDs (n=4,058) BiomarkerSexAge, yrT2DMHypertensionDyslipidemia MaleFemaleP value55>55≤P valueNoYesP valueNoYesP valueNoYesP value TNF-α, pg/mL Number458827-797488-1,180105-996289-729556- Median14.5111.17<0.00112.2412.320.88912.1514.040.02712.2312.520.42812.1212.570.101 75th percentile23.4217.03<0.00120.6118.67<0.00119.3620.590.76619.6619.150.05018.7220.310.969 90th percentile39.9928.850.01135.8429.44<0.00133.1533.510.79833.8231.500.04233.5632.830.387 95th percentile76.1254.160.10767.3548.440.00258.4964.580.98959.3653.920.24066.4650.830.041 99th percentile157.74139.540.405158.96135.100.205157.14101.240.252157.74150.290.788209.14112.730.025 TNF-β, pg/mL Number127339-246220-43036-353113-274192- Median0.000.000.3520.000.00<0.0010.000.000.1490.000.000.5660.000.000.115 75th percentile0.000.070.0150.200.00<0.0010.070.000.1190.070.010.0860.130.030.002 90th percentile1.311.090.4401.310.500.2761.124.400.8760.983.900.3862.030.580.088 95th percentile9.4810.190.53911.337.490.5139.1810.190.5719.1811.330.75514.443.900.035 99th percentile178.9492.260.244125.54168.500.601125.541,840.000.40192.26381.590.088178.9492.260.237 IL-1α, pg/mL Number458827-797488-1,180105-996289-729556- Median0.000.000.0480.000.000.1170.000.000.1300.000.000.4360.000.000.021 75th percentile8.330.040.0303.770.00<0.0012.670.000.1302.750.030.0136.580.000.003 90th percentile249.77186.250.492196.83159.730.003206.7046.690.015197.47123.820.155280.3382.64<0.001 95th percentile647.87496.050.107544.72470.970.009555.84117.210.032543.18530.100.373644.42371.130.011 99th percentile1,380.001,191.000.1571,270.001.380.000.8761,296.00458.640.8541,311.001,135.000.3681,269.001,380.000.589 IL-1β, pg/mL Number458827-797488-1,180105-996289-729556- Median0.690.45<0.0010.660.40<0.0010.520.680.4780.550.480.1330.520.530.814 75th percentile2.631.670.0012.471.26<0.0012.031.570.1222.031.830.0162.121.850.034 90th percentile10.969.090.38210.646.42<0.00110.005.310.0349.3811.970.6839.0910.340.975 95th percentile32.9924.130.57232.9915.86<0.00124.439.270.67824.4924.170.37324.4924.370.591 99th percentile143.3281.310.405101.6771.660.06886.97125.570.43797.6871.660.36897.6881.030.567 hsIL-1β, pg/mL Number331488-551268-75069-643176-455364- Median0.700.60<0.0010.700.600.3100.640.720.1530.660.640.6960.620.670.221 75th percentile1.200.90<0.0011.001.00<0.0011.031.080.7641.031.050.1900.981.070.573 90th percentile2.001.50<0.0011.801.800.0031.722.490.2081.741.900.5911.601.940.265 95th percentile3.301.980.0022.242.610.3222.322.720.2922.332.560.6362.102.560.547 99th percentile6.503.900.0074.705.320.8164.896.470.8405.323.770.0724.896.280.908 (Continued to the next page)
BiomarkerSexAge, yrT2DMHypertensionDyslipidemia MaleFemaleP value55>55≤P valueNoYesP valueNoYesP valueNoYesP value IL-6, pg/mL Number458827-797488-1,180105-996289-729556- Median1.380.37<0.0010.720.490.0510.610.620.9130.610.610.5610.740.520.233 75th percentile14.3710.040.18715.797.78<0.00112.297.260.05612.998.770.00416.238.440.002 90th percentile89.7869.660.07086.1759.02<0.00183.6057.190.23680.4479.770.30987.4966.730.052 95th percentile168.45137.770.276149.24137.790.035147.9892.420.396147.28137.340.373148.87137.340.197 99th percentile345.97286.060.157336.88244.240.017300.15226.260.854329.69298.670.368300.15292.510.567 hsIL-6, pg/mL Number331488-551268-75069-643176-455364- Median0.830.75<0.0010.750.81<0.0010.750.98<0.0010.750.94<0.0010.690.85<0.001 75th percentile1.301.01<0.0011.051.310.0241.111.430.1031.041.450.0100.981.300.003 90th percentile2.111.77<0.0011.822.110.4181.944.100.5671.882.240.7271.852.130.266 95th percentile3.422.340.0053.032.910.0322.828.320.0782.823.700.6722.543.420.210 99th percentile14.067.080.00714.068.130.0048.1369.600.01213.6210.250.7787.0814.060.059 MCP-1, pg/mL Number458827-797488-1,180105-996289-729556- Median753.01626.03<0.001649.71704.100.002664.72707.780.061657.93706.850.007644.85704.38<0.001 75th percentile927.38801.87<0.001836.75856.040.003836.88911.940.088834.37866.720.802815.68900.940.088 90th percentile1,132.00985.86<0.0011,053.001,059.000.0271,045.001,132.000.5001,040.001,067.000.7971,008.001,083.000.143 95th percentile1,256.001,132.000.0041,200.001,176.000.0351,182.001,313.000.1881,182.001,244.000.5981,162.001,221.000.334 99th percentile1,843.001,530.000.1571,735.001,642.000.2051,727.001,548.000.2521,735.001,679.000.3681,679.001,727.000.987 MCP-3, pg/mL Number458827-797488-1,180105-996289-729556- Median0.000.000.0890.000.000.0500.000.000.1350.000.000.5440.000.000.036 75th percentile16.0219.330.67119.6014.93<0.00118.1214.450.35418.1817.040.08320.6614.540.029 90th percentile73.5869.260.61770.7567.060.01070.6842.370.38166.6079.650.84170.6066.870.387 95th percentile115.10101.100.408116.9298.130.009104.37113.040.986101.99116.920.807118.22100.310.197 99th percentile256.00224.820.405245.16212.020.205243.25243.700.437228.80249.450.322252.64173.630.092 hsCRP, mg/L Number1,4262,632-2,0971,961-3,686372-2,9881,070-2,1761,882- Median0.650.54<0.0010.550.61<0.0010.560.87<0.0010.530.75<0.0010.500.69<0.001 75th percentile1.391.10<0.0011.161.230.2411.132.03<0.0011.071.57<0.0011.021.41<0.001 90th percentile3.262.45<0.0012.582.680.1542.513.96<0.0012.403.470.0072.412.930.022 95th percentile6.284.01<0.0014.685.350.1544.567.75<0.0014.216.250.0074.235.430.022 99th percentile21.5311.410.0115.6217.370.70914.3022.42<0.00116.2916.340.94616.5716.290.996 The P value was derived from the two-sided Wilcoxon rank-sum test. ND, non-detectable; T2DM, type 2 diabetes mellitus; TNF, tumor necrosis factor; IL, interleukin; hsIL, high sensitivity interleukin; MCP, monocyte chemoattractant protein; hsCRP, high sensitivity C-reactive protein.
Table 4. Continued