Endocrinol Metab 2014;29:312-319
http://dx.doi.org/10.3803/EnM.2014.29.3.312 pISSN 2093-596X · eISSN 2093-5978
Original Article
Age Is the Strongest Effector for the Relationship between Estimated Glomerular Filtration Rate and Coronary Artery Calcification in Apparently Healthy Korean Adults
Hyun Beom Chae1, Shin Yeoung Lee1, Nam Hee Kim1, Ki Joong Han1, Tae Hoon Lee1, Choel Min Jang1, Kyung Mo Yoo1, Hae Jung Park1, Min Kyung Lee1, Won Seon Jeon1, Se Eun Park1, Heui-Soo Moon2, Cheol-Young Park1, Won-Young Lee1, Ki-Won Oh1, Sung-Woo Park1, Eun-Jung Rhee1
Departments of 1Endocrinology and Metabolism, 2Neurology, Kangbuk Samsung Hospital, Sungkyunkwan University School of Medicine, Seoul, Korea
Background: Chronic kidney disease (CKD) is considered one of the most common risk factors for cardiovascular disease. Cor- onary artery calcification (CAC) is a potential mechanism that explains the association between renal function and cardiovascular mortality. We aimed to evaluate the association between renal function and CAC in apparently healthy Korean subjects.
Methods: A total of 23,617 participants in a health-screening program at Kangbuk Samsung Hospital were included in the study.
Estimated glomerular filtration rate (eGFR) was assessed using the Cockcroft-Gault equation. Coronary artery calcium score (CACS) was measured via multidetector computed tomography. Subjects were divided into three groups according to the CKD Staging system with eGFR grade: stage 1, eGFR ≥90 mL/min/1.73 m2; stage 2, eGFR 60 to 89 mL/min/1.73 m2; and stage 3, eGFR 30 to 59 mL/min/1.73 m2.
Results: The mean age of the participants was 41.4 years and the mean eGFR was 103.6±21.7 mL/min/1.73 m2. Hypertension and diabetes were noted in 43.7% and 5.5% of the participants, respectively. eGFR showed a weakly negative but significant as- sociation with CACS in bivariate correlation analysis (r=–0.076, P<0.01). Mean CACS significantly increased from CKD stage 1 to 3. The proportion of subjects who had CAC significantly increased from CKD stage 1 to 3. Although the odds ratio for CAC significantly increased from stage 1 to 3 after adjustment for confounding factors, this significance was reversed when age was included in the model.
Conclusion: In early CKD, renal function negatively correlated with the degree of CAC in Korean subjects. Age was the stron- gest effector for this association.
Keywords: Coronary artery calcification; Glomerular filtration rate; Renal insufficiency, chronic
Received: 9 March 2014, Revised: 20 April 2014, 13 May 2014, Accepted: 8 May 2014
Corresponding author: Eun-Jung Rhee
Department of Endocrinology and Metabolism, Kangbuk Samsung Hospital, Sungkyunkwan University School of Medicine, 29 Saemunan-ro, Jongno-gu, Seoul 110-746, Korea
Tel: +82-2-2001-2485, Fax: +82-2-2001-1588, E-mail: [email protected]
Copyright © 2014 Korean Endocrine Society
This is an Open Access article distributed under the terms of the Creative Com- mons Attribution Non-Commercial License (http://creativecommons.org/
licenses/by-nc/3.0/) which permits unrestricted non-commercial use, distribu- tion, and reproduction in any medium, provided the original work is properly cited.
INTRODUCTION
Cardiovascular disease (CVD) is a major clinical problem and the most common cause of morbidity and mortality in patients with chronic kidney disease (CKD) [1]. In CKD patients, the relative risk of mortality from CVD increases as the glomeru- lar filtration rate (GFR) decreases [2]. There are many factors involved in the development of CVD in CKD, including hy- perglycemia, hypertension, hyperlipidemia, inflammation, hy- percoagulability, uremic toxins, and ectopic calcification [3].
Vascular calcification strongly correlates with CVD mortal- ity and is a well-known pathophysiologic mechanism that ex- plains the association between renal function and cardiovascu- lar mortality [4]. Previous studies showed that renal dysfunc- tion is associated with higher coronary artery calcium score (CACS) in predialysis and dialysis CKD patients [5,6], while in some studies the association between impaired renal func- tion and coronary artery calcification (CAC) was not signifi- cant or was strongly attenuated after adjusting for cardiovas- cular risk factors [7]. A recent prospective study on data gener- ated from the Multi-Ethnic Study of Atherosclerosis (MESA) revealed that the association between CKD and CAC is medi- ated through a characteristic elevation in triglyceride (TG)-rich lipoproteins [8]. However, no studies on this issue have been performed on a large scale in the Korean population.
The aim of this study was to analyze the relationship be- tween renal function assessed by estimated glomerular filtration rate (eGFR) and CACS as detected by multi-detector computed tomography (MDCT) in apparently healthy Korean adults.
METHODS
Subjects
This cross-sectional study was a part of the Kangbuk Samsung Health Study, in which subjects participated in a medical health checkup program at the Health Promotion Center of Kangbuk Samsung Hospital, Sungkyunkwan University School of Medi- cine, Seoul, Korea. The purpose of the medical health checkup program is to promote the health of employees through regular medical checkups and to enhance early detection of existing diseases. Most of the examinees are employees and family members of various industrial companies from around the country.
The subjects participated in the medical checkup program from January 2010 to December 2011. We excluded subjects with a self-reported history of ischemic heart disease, isch-
emic stroke, subjects who were taking a statin or aspirin, and subjects with any missing data. Since few subjects had eGFR values lower than 60 mL/min/1.73 m2, subjects with eGFR
<30 mL/min/1.73 m2 were excluded from the study. These rigorous exclusions resulted in a final study population of 23,617 subjects.
The participants provided written informed consent for the use of health screening data in this study. The design, protocol, and the consent procedure of this study were reviewed and ap- proved by the Institutional Review Board of Kangbuk Sam- sung Hospital (KBS13120) and is in accordance with the Hel- sinki Declaration of 1975.
Anthropometric and laboratory measurements
Height and weight were measured twice and then averaged.
The body mass index (BMI) was calculated by dividing the weight (kg) by the square of the height (m). Blood pressure (BP) was measured using a standardized sphygmomanometer after 5 minutes of rest.
Serum calcium level was measured using the O-cresolphtha- lein complexone method (Hitachi Modular D2400, Roche, To- kyo, Japan). The hexokinase method was used to test fasting glucose concentrations (Hitachi Modular D2400). Fasting in- sulin concentrations were determined by electrochemilumines- cence immunoassay (Hitachi Modular E170, Roche). An enzy- matic calorimetric test was used to measure the total cholester- ol and TG concentrations. The selective inhibition method was used to measure the level of high density lipoprotein cholester- ol (HDL-C), and a homogeneous enzymatic calorimetric test was used to measure the level of low-density lipoprotein cho- lesterol. Serum high-sensitivity C-reactive protein levels were measured using a nephelometric assay with a BNII nephelom- eter (Dade Behring, Deerfield, IL, USA).
The presence of diabetes mellitus was determined by an- swers to the participants’ self-questionnaire and the diagnostic criteria of the American Diabetes Association [9]. The pres- ence of hypertension was defined as BP ≥140/90 mm Hg or presently taking antihypertensive medication, according to the criteria recommended by the seventh report of the Joint Na- tional Committee on prevention, detection, evaluation, and treatment of high BP (JNC 7) [10].
Smoking status was determined by the answers to the self- questionnaire. A smoker was defined as a subject who had ever smoked at least five packs of cigarettes in his life. Doing exercise was defined as regular exercise of moderate intensity ate least three times a week. Insulin resistance was measured
using the homeostatic model of the assessment of insulin re- sistance (HOMA-IR) and was obtained by applying the fol- lowing formula: HOMA-IR=fasting insulin (IU/mL)×fasting blood glucose (mmol/L)/22.5 [11].
Assessment of renal function
eGFR was calculated using the Cockcroft-Gault equation:
(140-age)×weight by kg×0.85 if female/(serum creatinine×
72). Subjects were divided into three groups according to the CKD staging system with eGFR grade: stage 1, eGFR ≥90 mL/min/1.73 m2; stage 2, eGFR 60 to 89 mL/min/1.73 m2; and stage 3, eGFR 30 to 59 mL/min/1.73 m2 [12].
Assessment of CAC
MDCT for CACS was undertaken by a 64-slice, spiral com- puted tomography scan (GE Health Care, Tokyo, Japan). The severity of CAC was assessed by the Agatston score: 0, 1 to 10, 11 to 100, 101 to 400, or 400 [13]. A total CACS was de- termined by the sum of the individual scores for the four major epicardial coronary arteries. A significant CAC was defined as CACS >0.
Statistical analysis
Because the distribution of calcium scores was skewed, we used the logarithmic transformation of the calcium scores and added 1 to all calcium scores to deal with values of zero as previously analyzed (Ln [CAC+1]) [14]. Pearson’s correlation analysis was used for bivariate correlation analyses between CACS+1, eGFR, and the variables of interest to more fully use the information contained in CACS. Comparison of the parameters between the subjects with or without CAC was an- alyzed by Student t test. Comparison of the parameters among the three groups divided by the stage of renal function was an- alyzed by a one-way analysis of variance. Binary logistic re- gression analyses were performed with other confounding variables included in the model. Significance was defined as P<0.05. All data were analyzed using SPSS version 18.0 (IBM Co., Armonk, NY, USA).
RESULTS
Study population
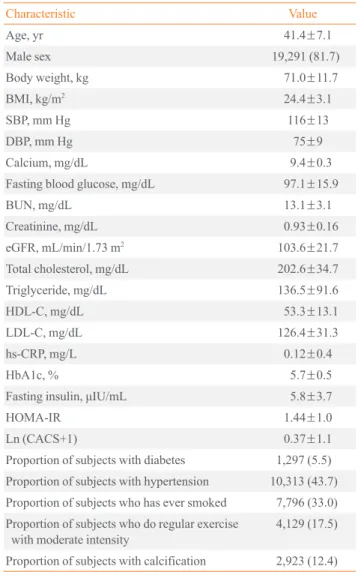
General characteristics of the participants are presented in Ta- ble 1. Mean age of the participants was 41.4 years (range, 23 to 89). The mean BMI value was 24.4 kg/m2, and 81.7% of the participants were male. Of the study population, 5.5% were
being treated for diabetes or satisfied the diagnostic criteria for diabetes, 43.7% were hypertensive, and 33.3% had smoked more than five total packs of cigarettes in his or her life. Only 12.4% of the study population had significant CAC (CACS
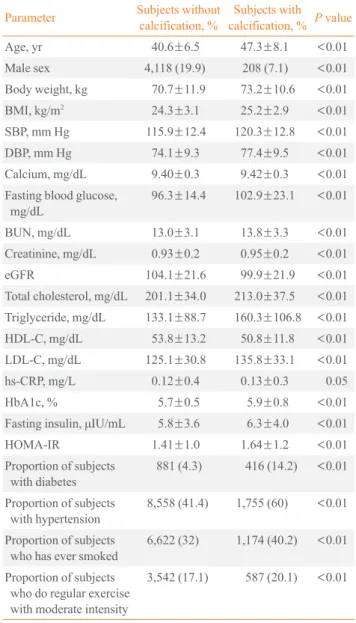
>0). Mean CACS significantly increased with age (data not shown). Compared with the subjects without calcification, the patients with calcification were older, were more obese with a higher BMI, and had higher systolic blood pressure (SBP) and diastolic BP. In addition, a greater number of these patients had a history of diabetes and hypertension (Table 2). Subjects with calcification had significantly lower eGFR values com-
Table 1. General Characteristics of the Participants (n=23,617)
Characteristic Value
Age, yr 41.4±7.1
Male sex 19,291 (81.7)
Body weight, kg 71.0±11.7
BMI, kg/m2 24.4±3.1
SBP, mm Hg 116±13
DBP, mm Hg 75±9
Calcium, mg/dL 9.4±0.3
Fasting blood glucose, mg/dL 97.1±15.9
BUN, mg/dL 13.1±3.1
Creatinine, mg/dL 0.93±0.16
eGFR, mL/min/1.73 m2 103.6±21.7
Total cholesterol, mg/dL 202.6±34.7
Triglyceride, mg/dL 136.5±91.6
HDL-C, mg/dL 53.3±13.1
LDL-C, mg/dL 126.4±31.3
hs-CRP, mg/L 0.12±0.4
HbA1c, % 5.7±0.5
Fasting insulin, μIU/mL 5.8±3.7
HOMA-IR 1.44±1.0
Ln (CACS+1) 0.37±1.1
Proportion of subjects with diabetes 1,297 (5.5) Proportion of subjects with hypertension 10,313 (43.7) Proportion of subjects who has ever smoked 7,796 (33.0) Proportion of subjects who do regular exercise
with moderate intensity 4,129 (17.5)
Proportion of subjects with calcification 2,923 (12.4) Values are expressed as mean±SD or number (%).
BMI, body mass index; SBP, systolic blood pressure; DBP, diastolic blood pressure; BUN, blood urea nitrogen; eGFR, estimated glomerular filtra- tion; HDL-C, high density lipoprotein cholesterol; LDL-C, low density li- poprotein cholesterol; hs-CRP, high-sensitivity C-reactive protein; HbA1c, glycated hemoglobin; HOMA-IR, homeostasis model assessment-insulin resistance; CACS, coronary artery calcium score.
pared with subjects without calcification (104.1±21.6 vs.
99.9±21.9, P<0.01).
Correlation of CACS and eGFR with variable parameters Bivariate correlation analyses were performed between CACS+1 and eGFR with multiple variables. Age showed the highest correlation with CACS+1 (r=0.327, P<0.01), and eGFR
Table 3. Bivariate Correlation between eGFR, Ln (CACS+1), and Parameters
Parameter Ln (CACS+1) eGFR
Ln (CACS+1) - –0.076a
eGFR –0.076a -
Age 0.327a –0.419a
Body weight 0.056a 0.649a
BMI 0.082a 0.573a
SBP 0.111a 0.174a
DBP 0.109a 0.156a
Calcium 0.016b –0.041a
Fasting blood glucose 0.146a 0.056a
BUN 0.081a –0.147a
Creatinine 0.045a –0.327a
Total cholesterol 0.095a 0.021a
Triglyceride 0.089a 0.209a
HDL-C –0.069a –0.220a
LDL-C 0.094a 0.063a
Hs-CRP 0.014b 0.045a
HbA1c 0.158a 0.050a
Insulin 0.039a 0.367a
HOMA-IR 0.071a 0.333a
eGFR, estimated glomerular filtration; CACS, coronary artery calci- um score; BMI, body mass index; SBP, systolic blood pressure; DBP, diastolic blood pressure; HDL-C, high density lipoprotein cholesterol;
LDL-C, low density lipoprotein cholesterol; hs-CRP, high-sensitivity C-reactive protein; HbA1c, glycated hemoglobin; HOMA-IR, homeo- stasis model assessment-insulin resistance.
aP<0.01; bP<0.05.
Table 2. Comparison of the Parameters between the Subjects with or without Coronary Artery Calcification (n=23,617)
Parameter Subjects without
calcification, % Subjects with calcification, % P value
Age, yr 40.6±6.5 47.3±8.1 <0.01
Male sex 4,118 (19.9) 208 (7.1) <0.01
Body weight, kg 70.7±11.9 73.2±10.6 <0.01
BMI, kg/m2 24.3±3.1 25.2±2.9 <0.01
SBP, mm Hg 115.9±12.4 120.3±12.8 <0.01
DBP, mm Hg 74.1±9.3 77.4±9.5 <0.01
Calcium, mg/dL 9.40±0.3 9.42±0.3 <0.01
Fasting blood glucose,
mg/dL 96.3±14.4 102.9±23.1 <0.01
BUN, mg/dL 13.0±3.1 13.8±3.3 <0.01
Creatinine, mg/dL 0.93±0.2 0.95±0.2 <0.01
eGFR 104.1±21.6 99.9±21.9 <0.01
Total cholesterol, mg/dL 201.1±34.0 213.0±37.5 <0.01 Triglyceride, mg/dL 133.1±88.7 160.3±106.8 <0.01
HDL-C, mg/dL 53.8±13.2 50.8±11.8 <0.01
LDL-C, mg/dL 125.1±30.8 135.8±33.1 <0.01
hs-CRP, mg/L 0.12±0.4 0.13±0.3 0.05
HbA1c, % 5.7±0.5 5.9±0.8 <0.01
Fasting insulin, μIU/mL 5.8±3.6 6.3±4.0 <0.01
HOMA-IR 1.41±1.0 1.64±1.2 <0.01
Proportion of subjects
with diabetes 881 (4.3) 416 (14.2) <0.01 Proportion of subjects
with hypertension 8,558 (41.4) 1,755 (60) <0.01 Proportion of subjects
who has ever smoked 6,622 (32) 1,174 (40.2) <0.01 Proportion of subjects
who do regular exercise with moderate intensity
3,542 (17.1) 587 (20.1) <0.01
Values are expressed as mean±SD or number (%).
BMI, body mass index; SBP, systolic blood pressure; DBP, diastolic blood pressure; BUN, blood urea nitrogen; eGFR, estimated glomerular filtra- tion; HDL-C, high density lipoprotein cholesterol; LDL-C, low density li- poprotein cholesterol; hs-CRP, high-sensitivity C-reactive protein; HbA1c, glycated hemoglobin; HOMA-IR, homeostasis model assessment-insulin resistance.
Fig. 1. Proportion of subjects with coronary artery calcification according to renal function stage.
Proportion of subjects with calcification (%)
40.00 30.00 20.00 10.00
0.00 Stage 1 Stage 2
Stages by renal function Stage 3 P<0.01
showed a slightly negative but significant association with CACS+1 (r=–0.076, P<0.01) (Table 3). Most of the parame- ters showed positive correlations with CACS+1 except HDL- C. Age showed a moderate negative correlation with eGFR (r=–0.419, P<0.01).
The relationship between renal function and coronary artery calcification
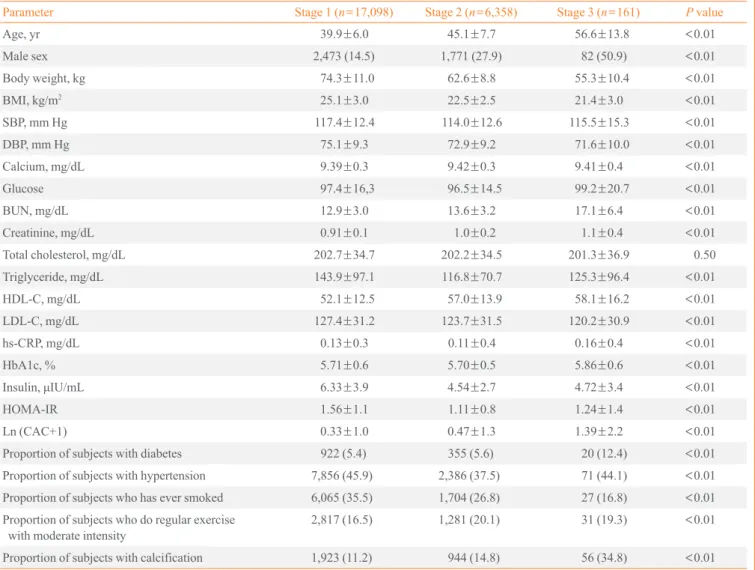
When mean CACS was compared among the CKD stages, the mean CACS significantly increased from stage 1 to 3 (stage 1, 0.33±1.0; stage 2, 0.47±1.3; and stage 3, 1.39±2.2; P<0.01) (Table 4). The proportion of subjects who had CAC signifi-
cantly increased from stage 1 to 3 (stage 1, 11.2%; stage 2, 14.8%; and stage 3, 34.8%; P<0.01) (Fig. 1).
When logistic regression analysis was performed with CAC as the dependent variable, and after adjusting for dependent variables including SBP, glucose, total cholesterol, TG, BMI, and gender, the odds ratio (OR) for CACS was 1.99 (95%
confidence interval [CI], 1.81 to 2.19; P<0.01) for the GFR stage 2 group and 8.58 (95% CI, 5.99 to 12.30; P<0.01) for the GFR stage 3 group, with the GFR stage 1 group being the reference group (Table 5). However, the OR significantly de- creased from stage 1 to 3 when age was included in the model.
Age was the strongest factor found to affect CAC.
Table 4. Comparison of Parameters among Groups Divided by Renal Function Stage
Parameter Stage 1 (n=17,098) Stage 2 (n=6,358) Stage 3 (n=161) P value
Age, yr 39.9±6.0 45.1±7.7 56.6±13.8 <0.01
Male sex 2,473 (14.5) 1,771 (27.9) 82 (50.9) <0.01
Body weight, kg 74.3±11.0 62.6±8.8 55.3±10.4 <0.01
BMI, kg/m2 25.1±3.0 22.5±2.5 21.4±3.0 <0.01
SBP, mm Hg 117.4±12.4 114.0±12.6 115.5±15.3 <0.01
DBP, mm Hg 75.1±9.3 72.9±9.2 71.6±10.0 <0.01
Calcium, mg/dL 9.39±0.3 9.42±0.3 9.41±0.4 <0.01
Glucose 97.4±16,3 96.5±14.5 99.2±20.7 <0.01
BUN, mg/dL 12.9±3.0 13.6±3.2 17.1±6.4 <0.01
Creatinine, mg/dL 0.91±0.1 1.0±0.2 1.1±0.4 <0.01
Total cholesterol, mg/dL 202.7±34.7 202.2±34.5 201.3±36.9 0.50
Triglyceride, mg/dL 143.9±97.1 116.8±70.7 125.3±96.4 <0.01
HDL-C, mg/dL 52.1±12.5 57.0±13.9 58.1±16.2 <0.01
LDL-C, mg/dL 127.4±31.2 123.7±31.5 120.2±30.9 <0.01
hs-CRP, mg/dL 0.13±0.3 0.11±0.4 0.16±0.4 <0.01
HbA1c, % 5.71±0.6 5.70±0.5 5.86±0.6 <0.01
Insulin, μIU/mL 6.33±3.9 4.54±2.7 4.72±3.4 <0.01
HOMA-IR 1.56±1.1 1.11±0.8 1.24±1.4 <0.01
Ln (CAC+1) 0.33±1.0 0.47±1.3 1.39±2.2 <0.01
Proportion of subjects with diabetes 922 (5.4) 355 (5.6) 20 (12.4) <0.01
Proportion of subjects with hypertension 7,856 (45.9) 2,386 (37.5) 71 (44.1) <0.01
Proportion of subjects who has ever smoked 6,065 (35.5) 1,704 (26.8) 27 (16.8) <0.01 Proportion of subjects who do regular exercise
with moderate intensity 2,817 (16.5) 1,281 (20.1) 31 (19.3) <0.01
Proportion of subjects with calcification 1,923 (11.2) 944 (14.8) 56 (34.8) <0.01
Values are expressed as mean±SD or number (%).
BMI, body mass index; SBP, systolic blood pressure; DBP, diastolic blood pressure; BUN, blood urea nitrogen; eGFR, estimated glomerular filtra- tion; HDL-C, high density lipoprotein cholesterol; LDL-C, low density lipoprotein cholesterol; hs-CRP, high-sensitivity C-reactive protein; HbA1c, glycated hemoglobin; HOMA-IR, homeostasis model assessment-insulin resistance; CAC, coronary artery calcification.
DISCUSSION
In this study, renal function assessed by eGFR negatively cor- related with coronary calcium score measured by MDCT based on data from Korean participants with normal to moder- ate renal dysfunction. When the subjects were divided into three groups according to the CKD staging system, the pro- portion of subjects with CAC significantly increased as kidney function deteriorated. In logistic regression analysis with CAC as the dependent variable, the OR for CAC increased as renal function deteriorated. However, these results were reversed when age was included in the model, suggesting that age was the strongest factor that affects CAC.
Several studies have revealed that age is the strongest factor for CAC. In a population-based study in older subjects, age, and male sex were the most important risk factors for coronary
calcification. Newman et al. [15] examined CAC in an elderly cohort over the age of 65 years. The key findings of this study were that the extent of CAC was strongly associated with age through the ninth decade in men and women and was associat- ed with CVD. However, the above-mentioned studies enrolled only elderly subjects and did not evaluate kidney function.
The association between CAC and age in relatively healthy young subjects remains unclear.
Numerous risk factors have been reported for vascular cal- cification in CKD [16]. Some factors are traditional, including aging, hypertension, diabetes or dyslipidemia, and others are nontraditional, such as hyperphosphatemia, secondary hyper- parathyroidism, low vitamin D, fibroblast growth factor 23, inflammation, and oxidative stress. Transformation of vascular smooth muscle cells into chondrocytes or osteoblast-like cells seems to be a key element in vascular calcification pathogene- sis [17]. Is seems likely that medial calcification is the main phenotypic change in CKD, and the subsequent arterial stiff- ness, even in nondialyzing CKD patients, might lead to in- creased CVD in CKD patients [18]. Vascular calcification could be the mechanistic explanation for increased CVD mor- tality in CKD patients, since increased vascular calcification reflects increased total CVD burden [19].
Several epidemiological studies reported the association be- tween decreasing kidney function and increased CAC. In the Dallas Heart Study, Kramer et al. [7] evaluated 2,660 partici- pants with a median age of 49 and observed a strong associa- tion between CKD and CAC among diabetic participants. In contrast, in the Framingham Heart Study, Fox et al. [20] evalu- ated 319 subjects with nearly normal kidney function and ob- served an association between a lower eGFR and a higher prevalence of CAC in an unadjusted analysis, but the associa- tion was attenuated after multivariate adjustment for cardio- vascular risk. Joosen et al. [21] investigated whether mild to moderate CKD is independently associated with coronary plaque burden beyond traditional cardiovascular risk factors.
Although decreasing renal function was associated with in- creasing extent and severity of coronary artery disease, mild to moderate CKD was not independently associated with coro- nary plaque burden after adjustment for traditional cardiovas- cular risk factors. In the MESA study, a representative cohort study using the largest CACS database, there was an increas- ing CAC incidence risk ratio as the eGFR decreased. This phe- nomenon was attenuated after adjusting for elevated TG-rich lipoprotein lipid phenotype, suggesting the role of lipid abnor- malities in the development of CAC in CKD patients [8]. In Table 5. Logistic Regression Analysis with CAC as the De-
pendent Variable
Variable OR 95% CI P value
Model 1
SBP 1.016 1.012–1.019 <0.01
Glucose 1.013 1.011–1.015 <0.01
TC 1.007 1.006–1.008 <0.01
Triglyceride 1.000 1.000–1.001 0.12
BMI 1.066 1.050–1.082 <0.01
Gender 0.360 0.309–0.420 <0.01
GFR stage 1 1.000 - <0.01
GFR stage 2 1.993 1.812–2.192 <0.01 GFR stage 3 8.584 5.993–12.297 <0.01 Model 2
Age 1.151 1.144–1.159 <0.01
SBP 1.013 1.009–1.017 <0.01
Glucose 1.008 1.006–1.011 <0.01
TC 1.007 1.006–1.008 <0.01
Triglyceride 1.000 1.000–1.001 0.05
BMI 1.036 1.019–1.053 <0.01
Gender 0.236 0.200–0.279 <0.01
GFR stage 1 1.000 - <0.01
GFR stage 2 0.796 0.714–0.888 <0.01
GFR stage 3 0.603 0.374–0.973 0.04
CAC, coronary artery calcification; OR, odds ratio; CI, confidence in- terval; SBP, systolic blood pressure; TC, total cholesterol; BMI, body mass index; GFR, glomerular filtration rate.
the Rotterdam study, El Barzouh et al. [14] evaluated 1,703 subjects with a median age of 70 years and observed that the association of CAC and GFR is affected by age. In our study, risk for CAC increased as renal function deteriorated from normal to moderate renal dysfunction. However, this signifi- cance disappeared as the model was adjusted for age, a result that is consistent with previous studies [14,20].
In another study performed on a Korean population, Cho et al. [22] evaluated the independent association between early CKD (stages 1 to 3a) with coronary atherosclerosis for 4,297 asymptomatic subjects. They showed that early CKD was an independent risk factor for coronary atherosclerosis, and the risk stratification for coronary atherosclerosis should be based on the presence of proteinuria rather than decreased eGFR within early CKD. Another study by Roy et al. [23] evaluated the relationship between CACS and stages of predialysis CKD and showed significantly increased risk for CAC compared with subjects with CKD. They suggested that mild and moder- ate predialysis CKD are independent risk factors for increased mean and incident CAC.
Our study had several limitations. First, this is a cross-sec- tional study; therefore, we cannot draw clear conclusions on the association of CKD and CAC from the results of our study.
Second, we had no data on patient dietary intake of calcium, vitamin D, or magnesium, which may affect CACS. Third, we only used the Cockcroft-Gault equation to estimate eGFR. Re- cent work showed that GFR estimated by the Modification of Diet in Renal Disease study equation or Chronic Kidney Dis- ease Epidemiology Collaboration equation overestimated GFR in stage 3 CKD when compared with the gold standard diethylene-triamine-pentaacetate method in the elderly [24].
Our study has strength in that we enrolled relatively healthy young subjects who participated in the medical health checkup program, and we showed that in this young population, age was the strongest factor that affects CAC as the kidney func- tion declines.
In conclusion, age had the strongest effect on the associa- tion between eGFR and the degree of CAC in young Korean subjects with relatively normal renal function. In the future, prospective studies are needed to determine the relationship between CAC and the occurrence of overt CVD events. Also, further study is needed to determine whether early and inten- sive intervention of CKD patients with CAC can lead to im- provement in rates of CVD morbidity and mortality.
CONFLICTS OF INTEREST
No potential conflict of interest relevant to this article was re- ported.
REFERENCES
1. Parfrey PS, Foley RN. The clinical epidemiology of cardi- ac disease in chronic renal failure. J Am Soc Nephrol 1999;
10:1606-15.
2. Go AS, Chertow GM, Fan D, McCulloch CE, Hsu CY.
Chronic kidney disease and the risks of death, cardiovas- cular events, and hospitalization. N Engl J Med 2004;351:
1296-305.
3. Shanahan CM. Mechanisms of vascular calcification in CKD-evidence for premature ageing? Nat Rev Nephrol 2013;9:661-70.
4. Raggi P, Boulay A, Chasan-Taber S, Amin N, Dillon M, Burke SK, Chertow GM. Cardiac calcification in adult he- modialysis patients. A link between end-stage renal disease and cardiovascular disease? J Am Coll Cardiol 2002;39:
695-701.
5. Braun J, Oldendorf M, Moshage W, Heidler R, Zeitler E, Luft FC. Electron beam computed tomography in the eval- uation of cardiac calcification in chronic dialysis patients.
Am J Kidney Dis 1996;27:394-401.
6. Russo D, Palmiero G, De Blasio AP, Balletta MM, An- dreucci VE. Coronary artery calcification in patients with CRF not undergoing dialysis. Am J Kidney Dis 2004;44:
1024-30.
7 Kramer H, Toto R, Peshock R, Cooper R, Victor R. Asso- ciation between chronic kidney disease and coronary artery calcification: the Dallas Heart Study. J Am Soc Nephrol 2005;16:507-13.
8. Lamprea-Montealegre JA, McClelland RL, Astor BC, Matsushita K, Shlipak M, de Boer IH, Szklo M. Chronic kidney disease, plasma lipoproteins, and coronary artery calcium incidence: the Multi-Ethnic Study of Atheroscle- rosis. Arterioscler Thromb Vasc Biol 2013;33:652-8.
9. American Diabetes Association. Standards of medical care in diabetes: 2014. Diabetes Care 2014;37 Suppl 1:S14-80.
10. Chobanian AV, Bakris GL, Black HR, Cushman WC, Green LA, Izzo JL Jr, Jones DW, Materson BJ, Oparil S, Wright JT Jr, Roccella EJ; National Heart, Lung, and Blood Institute Joint National Committee on Prevention, Detection, Evaluation, and Treatment of High Blood Pres-
sure; National High Blood Pressure Education Program Coordinating Committee. The seventh report of the Joint National Committee on Prevention, Detection, Evaluation, and Treatment of High Blood Pressure: the JNC 7 report.
JAMA 2003;289:2560-72.
11. Matthews DR, Hosker JP, Rudenski AS, Naylor BA, Treacher DF, Turner RC. Homeostasis model assessment:
insulin resistance and beta-cell function from fasting plas- ma glucose and insulin concentrations in man. Diabetolo- gia 1985;28:412-9.
12. National Kidney Foundation. K/DOQI clinical practice guidelines for chronic kidney disease: evaluation, classifi- cation, and stratification. Am J Kidney Dis 2002;39 (2 Sup- pl 1):S1-266.
13. Rumberger JA, Brundage BH, Rader DJ, Kondos G. Elec- tron beam computed tomographic coronary calcium scan- ning: a review and guidelines for use in asymptomatic per- sons. Mayo Clin Proc 1999;74:243-52.
14. El Barzouhi A, Elias-Smale S, Dehghan A, Vliegenthart- Proenca R, Oudkerk M, Hofman A, Witteman JC. Renal function is related to severity of coronary artery calcifica- tion in elderly persons: the Rotterdam study. PLoS One 2011;6:e16738.
15. Newman AB, Naydeck BL, Sutton-Tyrrell K, Feldman A, Edmundowicz D, Kuller LH. Coronary artery calcification in older adults to age 99: prevalence and risk factors. Cir- culation 2001;104:2679-84.
16. Covic A, Kanbay M, Voroneanu L, Turgut F, Serban DN, Serban IL, Goldsmith DJ. Vascular calcification in chronic kidney disease. Clin Sci (Lond) 2010;119:111-21.
17 Speer MY, Yang HY, Brabb T, Leaf E, Look A, Lin WL, Frutkin A, Dichek D, Giachelli CM. Smooth muscle cells give rise to osteochondrogenic precursors and chondro- cytes in calcifying arteries. Circ Res 2009;104:733-41.
18. Shioi A, Taniwaki H, Jono S, Okuno Y, Koyama H, Mori K,
Nishizawa Y. Monckeberg’s medial sclerosis and inorganic phosphate in uremia. Am J Kidney Dis 2001;38 (4 Suppl 1):
S47-9.
19. Rumberger JA, Simons DB, Fitzpatrick LA, Sheedy PF, Schwartz RS. Coronary artery calcium area by electron- beam computed tomography and coronary atherosclerotic plaque area: a histopathologic correlative study. Circulation 1995;92:2157-62.
20. Fox CS, Larson MG, Keyes MJ, Levy D, Clouse ME, Cul- leton B, O’Donnell CJ. Kidney function is inversely asso- ciated with coronary artery calcification in men and wom- en free of cardiovascular disease: the Framingham Heart Study. Kidney Int 2004;66:2017-21.
21. Joosen IA, Schiphof F, Versteylen MO, Laufer EM, Winkens MH, Nelemans PJ, Kooman JP, Hofstra L, Wild- berger JE, Leiner T. Relation between mild to moderate chronic kidney disease and coronary artery disease deter- mined with coronary CT angiography. PLoS One 2012;7:
e47267.
22. Cho I, Min HS, Chun EJ, Park SK, Choi Y, Blumenthal RS, Rivera JJ, Nasir K, Kim YJ, Sohn DW, Oh BH, Park YB, Chang HJ. Coronary atherosclerosis detected by coro- nary CT angiography in asymptomatic subjects with early chronic kidney disease. Atherosclerosis 2010;208:406-11.
23. Roy SK, Cespedes A, Li D, Choi TY, Budoff MJ. Mild and moderate pre-dialysis chronic kidney disease is associated with increased coronary artery calcium. Vasc Health Risk Manag 2011;7:719-24.
24. Maioli C, Cozzolino M, Gallieni M, Del Sole A, Tagliabue L, Strinchini A, Gaito S, Lecchi M, Cusi D, Lucignani G.
Evaluation of renal function in elderly patients: perfor- mance of creatinine-based formulae versus the isotopic method using 99mTc-diethylene triamine pentaacetic acid.
Nucl Med Commun 2014;35:416-22.