<연구논문> Fashion & Text. Res. J.
Vol. 18, No. 1, pp.91-102(2016) http://dx.doi.org/10.5805/SFTI.2016.18.1.91
91
Classification of Lower Body Types of Female Adults aged 18 to 69 based on 3D Body Scan Data
- Focusing on the Front Type, Lateral-Front Type, and Lateral-Back Type -
Min Kyoung Kim and Yun Ja Nam
1)†Dept. of Textiles, Merchandising and Fashion Design, Seoul National University; Seoul, Korea
1)
Dept. of Textiles, Merchandising and Fashion Design/Research Institute of Human Ecology, Seoul National University;
Seoul, Korea
Abstract : This study classified the lower body types of female adults aged 18 to 69. The lower body was divided into front, lateral front, and lateral back. In order to understand the shape and somatotype of each segment, 592 people were analyzed based on girth, height, length, depth, width, angle and cross section distance for each segment. For data analysis, SPSS 18.0 was performed for descriptive statics, principal component analysis, K-means cluster analysis, ANOVA, and Duncan's test (as verification). Factor analysis was performed based on index values, calculation values, angles, and cross section distances. The measured items resulted in a.) 16 items were extracted to 5 factors in the case of the front factor (FF) of the lower body, and b.) 24 items were extracted to 6 factors in the case of lateral front factor (LFF) and lateral back factor (LBF). Each factor was put through K-means cluster analysis, classifying the lower bodies into one of four types of based on the front type (FT), the lateral front type (LFT), and the lateral back type (LBT) respectively. This study proposed an understanding of various lower body shapes by segmenting and classifying the lower body shapes for each type.
Key words : lower body type, front type, lateral front type, lateral back type
1. Introduction
Recently, the fashion industries have automated design, plan- ning, and production processes of their work in addition to the manufacturing process. This shift has occurred as a result of high- lighting ‘Mass Customization’ and the ‘MTM production method’
which have become the paradigm shift in the creation of a wide variety of product profiles and in the optimization of customer sat- isfaction. Even though mass customization had such advantages, there were reasons that Korean fashion industry manufactures hes- itate to adopt it. The major reason was the increase in cost that results when companies producing ready-made clothing shift over to customization that requires producing clothing patterns that match customer specifications. There was also a lack of preparation for mass customization. At the current stage, a process for adjusting ready-made patterns to the figures of individual customers is nec-
essary. However, figure property standards for ready-made patterns and standards that could be continuously applied even in the case of design or style alterations were not provided(Choi, 2008). In addition, current KS size standards reflect a limited range of body measurements, which may leave customers with figures that meet those measurements dissatisfied. As one of solutions to these prob- lems, measurement standards for each shape were required through scientific research on figures, including the form elements of each part of the human body. Successful mass customization that meets the needs of individual customers and leads steady market growth in the fashion industry necessitates the preparation of a standard for pattern design that reflects the shape properties of each human body part. Although there has been research on how to systematize production of men's clothing over the past few years(Jang &
Chang, 2008; Kim et al., 2011a; Kim et al., 2013; Kim et al., 2015), research into the process of systematizing women’s clothing remains lacking. This was because women’s clothing lacked the standardization of men’s clothing in order to give customers a larger range of choices. However, developing this larger range also took a longer period of time to develop styles that meet customer demands. For this reason, tight skirts, which requires accurate fit- ting, are not too complex, and come in standardized styles, have been evaluated as suitable items for mass customization production for the lower body. It is known that if transmutable standards for
†Corresponding author; Yun Ja Nam Tel. +82-2-880-6844, Fax. +82-2-875-8359 E-mail: [email protected]
This study is a part of a doctoral dissertation.
©
2016 (by) the authors. This article is an open access article distributed
under the terms and conditions of the Creative Commons Attribution
license (http://creativecommons.org/licenses/by/3.0/), which permits unre-
stricted use, distribution, and reproduction in any medium, provided the
original work is properly cited.
ready-made clothing patterns for the lower body are provided, it may be possible to auto-design clothing patterns suitable for mass customization production. As such, these methods for production are employed to improve the ‘Fit’ of ready-made clothes(Park &
Nam, 2001). Rather than only looking at size as a single measure- ment, these new methods took into consideration several body characteristics for each part of the item, enabling designers to make patterns that properly reflect the body types of their consum- ers(Hahm & Chung, 1999; Kim & Lee, 2011; Lee & Hong, 1999).
Previous body type studies, the study for on the lower body of female adults included both a factor analysis and a cluster analysis to review direct and indirect measurements including the circum- ference, depth, width, length, height, and angle. It then categorized the lower body shapes based on 3-6 characteristics(Kim & Lim, 1999; Lee et al., 2008; Moon, 2001). Current pattern design meth- ods based on definite categorization are limited in their ability to in reflect all unique features. Lim(2003), who has conducted several more segmented studies, thus divided the lower body shape into the
‘frontal body shape’ and ‘lateral body shape’ for the purpose of more accurately categorizing the characteristics of various body shapes. Lim(2003) then selected a representative body shape with the highest appearance rate based on contingency rate analysis.
Most advanced research separated the human body into front, back and side, and summarized and integrated the human body into sev-
eral categories. However, it is necessary to classify each lower body part in more details to understand the diversity of individual figures and design appropriate basic patterns for the lower body(Rasband, 1994). Therefore, this study was conducted on female adults aged 18-69 to measure their lower bodies, angles, and cross section distances for each of the three segments, to clas- sify the lower body types based on each of the somatotype, FT(front type), LFT(lateral front type), and LBT(lateral back type), which influenced the ‘Fit’ of clothes. By standardizing the lower body through the classifications of FT, LFT and LBT, alternation standards for ready-made clothing patterns could be provided together with an analysis of the differences in the surface pattern of each body part. In short, this study is designed to propose reference data to improve the ‘Fit’ of lower body apparels by categorizing the lower body into three somatotypes.
2. Methods
2.1. Subjects
The 3D data of 592 adult women aged 18-69 were reviewed.
Table 1. Number by age groups (Unit:N) Age 18~29 30~39 40~49 50~59 60~69 Total
Number 178 155 149 73 37 592
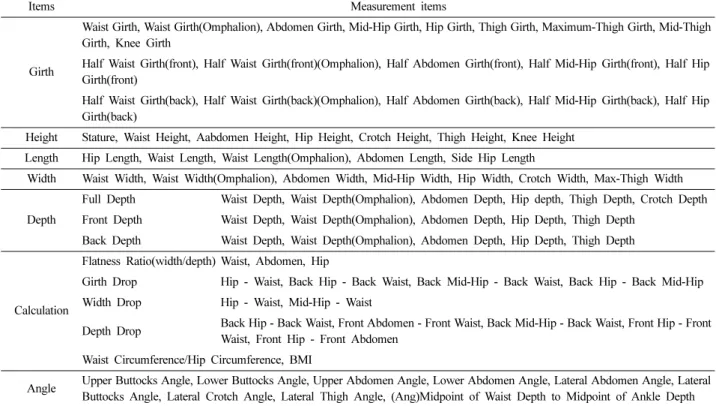
Table 2. Items of anthropometric data
Items Measurement items
Girth
Waist Girth, Waist Girth(Omphalion), Abdomen Girth, Mid-Hip Girth, Hip Girth, Thigh Girth, Maximum-Thigh Girth, Mid-Thigh Girth, Knee Girth
Half Waist Girth(front), Half Waist Girth(front)(Omphalion), Half Abdomen Girth(front), Half Mid-Hip Girth(front), Half Hip Girth(front)
Half Waist Girth(back), Half Waist Girth(back)(Omphalion), Half Abdomen Girth(back), Half Mid-Hip Girth(back), Half Hip Girth(back)
Height Stature, Waist Height, Aabdomen Height, Hip Height, Crotch Height, Thigh Height, Knee Height Length Hip Length, Waist Length, Waist Length(Omphalion), Abdomen Length, Side Hip Length
Width Waist Width, Waist Width(Omphalion), Abdomen Width, Mid-Hip Width, Hip Width, Crotch Width, Max-Thigh Width
Depth
Full Depth Waist Depth, Waist Depth(Omphalion), Abdomen Depth, Hip depth, Thigh Depth, Crotch Depth Front Depth Waist Depth, Waist Depth(Omphalion), Abdomen Depth, Hip Depth, Thigh Depth
Back Depth Waist Depth, Waist Depth(Omphalion), Abdomen Depth, Hip Depth, Thigh Depth
Calculation
Flatness Ratio(width/depth) Waist, Abdomen, Hip
Girth Drop Hip - Waist, Back Hip - Back Waist, Back Mid-Hip - Back Waist, Back Hip - Back Mid-Hip Width Drop Hip - Waist, Mid-Hip - Waist
Depth Drop Back Hip - Back Waist, Front Abdomen - Front Waist, Back Mid-Hip - Back Waist, Front Hip - Front Waist, Front Hip - Front Abdomen
Waist Circumference/Hip Circumference, BMI
Angle Upper Buttocks Angle, Lower Buttocks Angle, Upper Abdomen Angle, Lower Abdomen Angle, Lateral Abdomen Angle, Lateral Buttocks Angle, Lateral Crotch Angle, Lateral Thigh Angle, (Ang)Midpoint of Waist Depth to Midpoint of Ankle Depth
Drop: Difference value in the comparison of the circumference(width, depth)
The data was retrieved from the ‘The 5th Size Korea(Korean Agency for Technology and Standards, 2004)’ database. Efforts were made to have balanced representation of different age groups.
However, because the 5th Size Korea database had a lower ratio of people in their fifties and sixties, this study also had lower repre- sentation from these demographics(Table 1).
2.2. Analysis items of anthropometric data
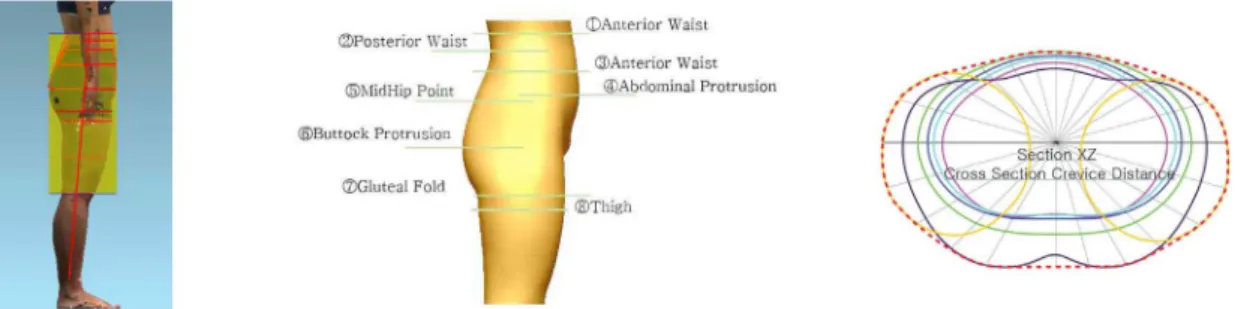
To analyze the lower body, several items utilized to design lower body apparel were chosen for measurement. 63 items were mea- sured for anthropometric data using the 3D scan data. Data of cross sections for 216 items were used to measure the distance of each angle. To analyze the front and back features of the lateral sides and the front of the lower body, front-back depth and front-back girth were divided for measurement. There are two data points to dis- tinguish the front and back: the midpoint of the waist depth and the midpoint of the thickest depth. The midpoint of thickest depth is the central mark which divides the horizontal distance between the hip point and the maximum abdomen point. As shown in Table 2, there are 79 measured and calculated items. Overlapping cross sec- tions of the 3D body scans were used to analyze distances(Kim et al., 2011b). Likewise, stacked cross sections of each lower body part and each cross section distance were equally divided at the 15°
intervals to measure the distances for 216 items(Fig. 1).
2.3. Data analysis
For the typology of the lower body, SPSS 18.0 was used to ana- lyze the anthropometric data by excluding the lower body size fac- tor and by instead focusing on shape-related factors. The measured values for height, girth, depth, width, and cross section distance were converted into index values. Principle component analysis were then used to summarize the information derived from the measurements and angles. To establish the criteria for determining the number of factors, the Scree-Test was applied. The factor shall be chosen under the condition that the explanatory power did not change and eigenvalue is over 1.0. Advanced research studies determined the number of groups to be 3 to 5 by reviewing the dis-
tribution conditions of each category. However, this research orig- inally relied on a hieratical cluster analysis to decide the number of groups. A hieratical cluster analysis applied in line with the min- imum variation of ward, and then the number of clusters were decided, classifying the lower body shapes of the female adults using K-means cluster analysis. To best reflect the shape differ- ences and distribution rate of each segment, FT, LFT and LBT, this study chose a set number of factors. To explore the shape differ- ences of each body part as categorized by the factor scores, ANOVA(analysis of variance) and Duncun's test were performed to check the average of the index values for shape-related items, and the absolute values for size items.
3. Results and discussion
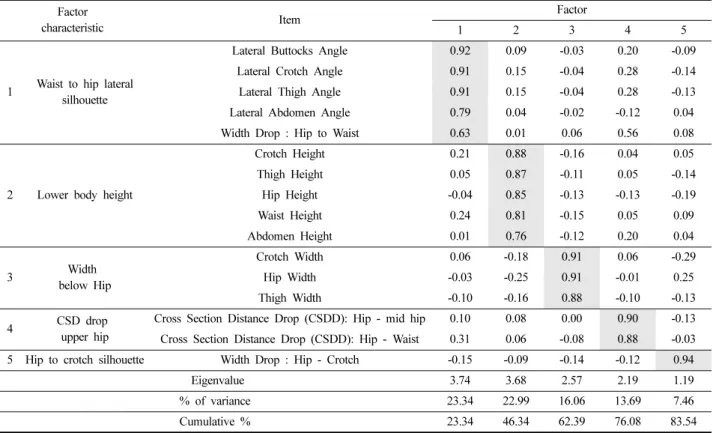
3.1. Shape-related characteristics of the front lower body 3.1.1. Analysis of shape factors in the front lower body To explore the shape factors comprising the front lower body of female adults, 16 index items, 4 angle items, and 8 calculated items were used in the factor analysis. To ensure the quality of the factors, analysis were repeatedly conducted to eventually narrow the items down to 16 and the analysis extracted 5 factors. Table 3 shows the factor analysis findings.
Table 3 shows that 83.54% of the variation of the 16 variables was explained by five factors with eigenvalues of 1.0 and more.
Factor 1 referred to the lateral line from the waist to hip, and had an eigenvalue of 3.74 and an explanatory power of 23.34%. Factor 2 was the height of the lower body, with an eigenvalue of 3.68 and an explanatory power of 22.99%. Factor 3 formed a silhouette below the maximum hip point, with an eigenvalue of 2.57 and an explan- atory power of 16.06%. Factor 4 decided the shape over the hip girth line, and had an eigenvalue of 2.19 and an explanatory power of 13.69%. Factor 5 had similar characteristics to Factor 3, repre- senting the shape from hip to crotch of the lower front body. Factor 5 had an eigenvalue of 1.19 and an explanatory power of 7.46%.
3.1.2. Classification of front lower body shape
Fig. 1. Overlap map of each area cross section crevice distance.The scores for five factors drawn via factor analysis underwent an additional cluster analysis. The number of categories was cho- sen by referencing the point of the dendrogram of a hieratical clus- ter analysis and a vertical icicle plot where there is a rise in the dendrogram and a sudden decline in the vertical icicle plot. The analysis classified the FT(Front Type) of the lower body into 4 types. Aggregating the factor scores of each type and the average of the index values, this study considered the differences between each type of the front lower body, leading to the following clas- sifications(Table 4, Table 5).
To sum up characteristics of each body type, FT1 had the largest waist width and a relatively small hip width when measurements were taken on the axis of the waist width and hip width. FT2 was
wide below the hip girth line. The waist girth was also large, though smaller than that of FT1. FT2 had the largest hip girth and thigh girth from among the four types. The value of factor 1 was the highest for FT3, and the waist width was smaller than FT2 in Table 6. FT3 had the smallest waist width because the value of fac- tor 1 in this type was analyzed as the largest. FT4 had the highest value in factor 4 but the absolute value was the lowest. Thus FT4 had the thinnest shape of the four.
To analyze the individual features based on the size of each front lower body type, the measured values were measured for each clas- sification and were compared in multiple ways(Table 6). In the case of height, FT1 was the highest while FT2 was the lowest. In terms of waist girth, FT3 and FT4 were the smallest while FT1 was the
Table 3. Factor analysis of front body measurementFactor
characteristic Item Factor
1 2 3 4 5
1 Waist to hip lateral silhouette
Lateral Buttocks Angle 0.92 0.09 -0.03 0.20 -0.09
Lateral Crotch Angle 0.91 0.15 -0.04 0.28 -0.14
Lateral Thigh Angle 0.91 0.15 -0.04 0.28 -0.13
Lateral Abdomen Angle 0.79 0.04 -0.02 -0.12 0.04
Width Drop : Hip to Waist 0.63 0.01 0.06 0.56 0.08
2 Lower body height
Crotch Height 0.21 0.88 -0.16 0.04 0.05
Thigh Height 0.05 0.87 -0.11 0.05 -0.14
Hip Height -0.04 0.85 -0.13 -0.13 -0.19
Waist Height 0.24 0.81 -0.15 0.05 0.09
Abdomen Height 0.01 0.76 -0.12 0.20 0.04
3 Width
below Hip
Crotch Width 0.06 -0.18 0.91 0.06 -0.29
Hip Width -0.03 -0.25 0.91 -0.01 0.25
Thigh Width -0.10 -0.16 0.88 -0.10 -0.13
4 CSD drop
upper hip
Cross Section Distance Drop (CSDD): Hip - mid hip 0.10 0.08 0.00 0.90 -0.13 Cross Section Distance Drop (CSDD): Hip - Waist 0.31 0.06 -0.08 0.88 -0.03 5 Hip to crotch silhouette Width Drop : Hip - Crotch -0.15 -0.09 -0.14 -0.12 0.94
Eigenvalue 3.74 3.68 2.57 2.19 1.19
% of variance 23.34 22.99 16.06 13.69 7.46
Cumulative % 23.34 46.34 62.39 76.08 83.54
Table 4. Difference verification of factor score by front type Type
Factor
FT1 (n=138)
FT2 (n=129)
FT3 (n=139)
FT4
(n=186) F
1 Waist to hip lateral silhouette -0.63d 0.16b 1.02a -0.37c 150.96***
2 Lower body height 0.78a -0.24b -0.19b -0.31b 62.99***
3 Width below hip 0.16b 1.03a -0.34c -0.69c 185.12***
4 CSD drop upper hip -0.63c 0.42b -0.65c 0.69a 154.12***
5 Hip to crotch silhouette -0.25c 0.40a 0.07b -0.11c 20.76***
***
p≤.001 According to Duncan-test result mean were marked with different letters which had significant difference at level p≤0.5(a>b>c>d)
Table 5. Difference verification of index values and angles by front type Type
Item FT1 FT2 FT3 FT4 F
Waist to hip lateral silhouette
Lateral Buttocks Angle 9.22d 10.90b 11.21a 10.48c 83.05***
Lateral Crotch Angle 9.22d 10.89b 11.20a 10.48c 63.15***
Lateral Thigh Angle 4.79d 5.14b 5.20a 4.95c 63.00***
Lateral Abdomen Angle 10.29c 12.33b 12.80a 11.68c 95.99***
Width Drop : Hip to Waist 0.25b 0.34a 0.35a 0.34a 67.33***
Lower body height
Crotch Height 0.45a 0.44c 0.44b 0.44c 25.43***
Thigh Height 0.43a 0.42c 0.42b 0.42bc 41.72***
Hip Height 0.50a 0.48c 0.48b 0.48bc 34.30***
Waist Height 0.62a 0.62c 0.62b 0.62c 19.59***
Abdomen Height 0.55a 0.55c 0.54c 0.55b 16.32***
Width below hip
Crotch Width 1.31b 1.40a 1.42a 1.41a 120.44***
Hip Width 1.25b 1.34a 1.35a 1.34a 168.05***
Thigh Width 0.63b 0.67a 0.67a 0.66a 103.19***
CSD drop upper hip
Cross Section Distance Drop
(CSDD): Hip - mid hip 0.07c 0.10a 0.88b 0.11a 80.74***
Cross Section Distance Drop
(CSDD): Hip - Waist 0.25c 0.32a 0.28b 0.32a 81.03***
Hip to crotch silhouette Width Drop : Hip - Crotch -0.07c -0.06a -0.06ab -0.06bc 4.27**
**
p≤.01,
***p≤.001 Duncan test: a>b>c>d
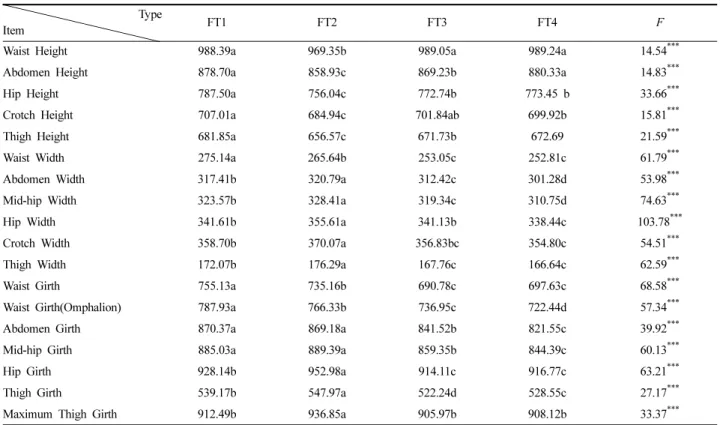
Table 6. Difference verification of measured values by front type (Unit:mm) Type
Item FT1 FT2 FT3 FT4 F
Waist Height 988.39a 969.35b 989.05a 989.24a 14.54***
Abdomen Height 878.70a 858.93c 869.23b 880.33a 14.83***
Hip Height 787.50a 756.04c 772.74b 773.45 b 33.66***
Crotch Height 707.01a 684.94c 701.84ab 699.92b 15.81***
Thigh Height 681.85a 656.57c 671.73b 672.69 21.59***
Waist Width 275.14a 265.64b 253.05c 252.81c 61.79***
Abdomen Width 317.41b 320.79a 312.42c 301.28d 53.98***
Mid-hip Width 323.57b 328.41a 319.34c 310.75d 74.63***
Hip Width 341.61b 355.61a 341.13b 338.44c 103.78***
Crotch Width 358.70b 370.07a 356.83bc 354.80c 54.51***
Thigh Width 172.07b 176.29a 167.76c 166.64c 62.59***
Waist Girth 755.13a 735.16b 690.78c 697.63c 68.58***
Waist Girth(Omphalion) 787.93a 766.33b 736.95c 722.44d 57.34***
Abdomen Girth 870.37a 869.18a 841.52b 821.55c 39.92***
Mid-hip Girth 885.03a 889.39a 859.35b 844.39c 60.13***
Hip Girth 928.14b 952.98a 914.11c 916.77c 63.21***
Thigh Girth 539.17b 547.97a 522.24d 528.55c 27.17***
Maximum Thigh Girth 912.49b 936.85a 905.97b 908.12b 33.37***
Maximum thigh girth : The horizontal thigh circumference from side to side
***
p≤.001, Duncan test: a>b>c>d
largest. Regarding the girth and width below the hip, FT2 was the biggest while FT3 and FT4 were smaller than FT1. These resulted resonate with those in the Jung(1994) study which argued that the shape of each type was highly correlated to the size of the human body even when the body shapes were classified in line with com- ponents constructing the human bodies. However, the index values and type differences of the measured values were not completing identical, thus revealing the difference in size sequence. In addition, when the average measured values of each type were analyzed, it was found that some items had high values of standard deviations.
Thus, measured value-based shape analysis had some limita- tions(Choi, 1997).
3.2. Shape-related characteristics of the lower lateral body
3.2.1. Factor analysis on the lower lateral body
To extract the factors constructing lateral of lower body of female adults, 25 items for the front-back depth of the lateral side based on the reference line, 6 items for the height index values, 4 items for the angles, 10 items for the cross section distance, and 10 items for the calculation values were analyzed. To prevent redun- dancy, items with high correlations with various factors were excluded and then a factor analysis was again taken. This even- tually led to the definition of 24 items and 6 factors as shown by Table 7.
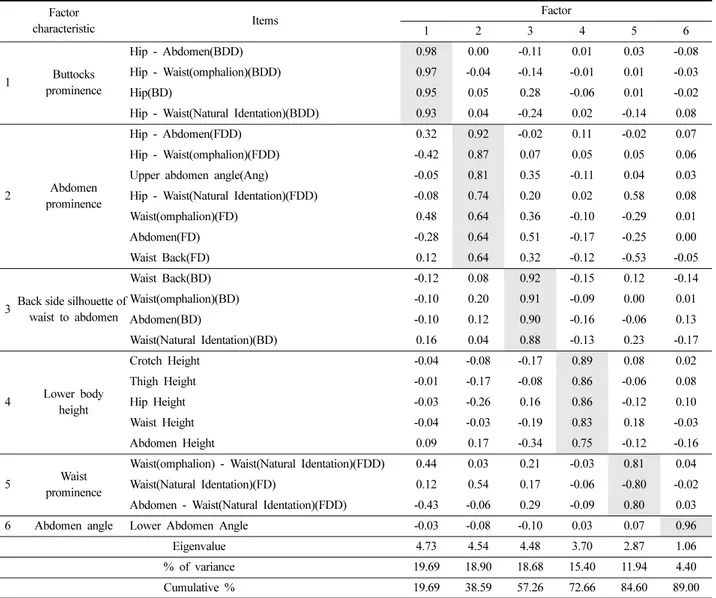
Table 7 showed that 89.00% of the variation of the variables was explained by six factors. Factor 1 was the back depth difference between the waist and the hip girth line, and has an eigenvalue of 4.73 and an explanatory power of 19.69%. Factor 2 indicated the prominence of the abdomen between the waist and the hip girth
Table 7. Factor analysis of lateral body measurement Factor
characteristic Items Factor
1 2 3 4 5 6
1 Buttocks prominence
Hip - Abdomen(BDD) 0.98 0.00 -0.11 0.01 0.03 -0.08
Hip - Waist(omphalion)(BDD) 0.97 -0.04 -0.14 -0.01 0.01 -0.03
Hip(BD) 0.95 0.05 0.28 -0.06 0.01 -0.02
Hip - Waist(Natural Identation)(BDD) 0.93 0.04 -0.24 0.02 -0.14 0.08
2 Abdomen prominence
Hip - Abdomen(FDD) 0.32 0.92 -0.02 0.11 -0.02 0.07
Hip - Waist(omphalion)(FDD) -0.42 0.87 0.07 0.05 0.05 0.06
Upper abdomen angle(Ang) -0.05 0.81 0.35 -0.11 0.04 0.03
Hip - Waist(Natural Identation)(FDD) -0.08 0.74 0.20 0.02 0.58 0.08
Waist(omphalion)(FD) 0.48 0.64 0.36 -0.10 -0.29 0.01
Abdomen(FD) -0.28 0.64 0.51 -0.17 -0.25 0.00
Waist Back(FD) 0.12 0.64 0.32 -0.12 -0.53 -0.05
3 Back side silhouette of waist to abdomen
Waist Back(BD) -0.12 0.08 0.92 -0.15 0.12 -0.14
Waist(omphalion)(BD) -0.10 0.20 0.91 -0.09 0.00 0.01
Abdomen(BD) -0.10 0.12 0.90 -0.16 -0.06 0.13
Waist(Natural Identation)(BD) 0.16 0.04 0.88 -0.13 0.23 -0.17
4 Lower body height
Crotch Height -0.04 -0.08 -0.17 0.89 0.08 0.02
Thigh Height -0.01 -0.17 -0.08 0.86 -0.06 0.08
Hip Height -0.03 -0.26 0.16 0.86 -0.12 0.10
Waist Height -0.04 -0.03 -0.19 0.83 0.18 -0.03
Abdomen Height 0.09 0.17 -0.34 0.75 -0.12 -0.16
5 Waist
prominence
Waist(omphalion) - Waist(Natural Identation)(FDD) 0.44 0.03 0.21 -0.03 0.81 0.04 Waist(Natural Identation)(FD) 0.12 0.54 0.17 -0.06 -0.80 -0.02 Abdomen - Waist(Natural Identation)(FDD) -0.43 -0.06 0.29 -0.09 0.80 0.03 6 Abdomen angle Lower Abdomen Angle -0.03 -0.08 -0.10 0.03 0.07 0.96
Eigenvalue 4.73 4.54 4.48 3.70 2.87 1.06
% of variance 19.69 18.90 18.68 15.40 11.94 4.40
Cumulative % 19.69 38.59 57.26 72.66 84.60 89.00
BDD: Back Depth Drop, BD: Back Depth, FDD: Front Depth Drop
line. This factor indicated that abdomen depth positively correlated with the angle from the waist to the maximum abdomen point. Fac- tor 2 had an eigenvalue of 4.54 and an explanatory power of 18.90%. Factor 3 was the back depth from the waist to the abdo- men girth, representing the features from the back waist to the mid- hip of lower body. Factor 3 had an eigenvalue of 4.48 and an explanatory power of 18.68%. Factor 4 was a height-related factor, including the height of the lower body. Factor 4 had an eigenvalue of 3.70 and an explanatory power of 15.40%. Factor 5 indicated the shape between the waist and the maximum abdomen point. It implied the importance of the waist depth in deciding the shape.
Factor 5 had an eigenvalue of 2.87 and an explanatory power of 11.94%. Factor 6 was the angle between the tangent on the front- hip point and the maximum-abdomen point and the vertical line, which represented the angle of the prominent abdomen. Factor 6 had an eigenvalue of 1.06 and an explanatory power of 4.40%.
3.2.2. Classification of lower lateral body shape 3.2.2.1. Lateral-front type through cluster analysis
The lateral lower body factors were put through cluster analysis.
Among the analysis findings on lateral of lower body, the lateral front factor to explain the frontal shape(waist and abdomen profile)
was used for cluster analysis, enabling the classification of the LFT of the lower body into 4 types. Aggregating the factor scores and the averages of the index values and measured values, this study found the following results on the LFT of the lower body(Table 8, Table 9, Table 10).
LFT1 did not have a clear curve, and was the most common body type of people in their 20s(Table 11). LFT2 has a relatively prominent abdomen when the waist depth and hip depth are set as axes. The thinness of the front depth of the waist and hip lead to the prominence of the abdomen. It had largest difference between the abdomen depth and waist depth, which means that LFT2 has the largest bulge. However, when measured values were considered, the front waist girth of LFT2 was the smallest, meaning that it indi- cates a thin type with a large bulge. LFT2 occurred most in thirties and second most in forties. LFT3 shows the largest front girth of the waist point, and has the thickest waist in terms of lateral sil- houette. This is the common body type for people in their 50s and above. This is due to the concentration of fat in the upper abdomen.
LFT4 has the most prominent abdomen as it is thicker in the waist and the values related to abdomen prominence are high. The LFT4 bulge is the second largest, but the values related to girths are the largest according to measured value. The analysis on the measured
Table 8. Difference verification of factor score by lateral front type Type
Factor
LFT 1 (n=219)
LFT 2 (n=207)
LFT 3 (n=88)
LFT4
(n=78) F
Abdomen prominence -0.77c 0.13b 0.22b 1.28a 219.78***
Lower body height 0.007a 0.05a 0.01a -0.13a 0.80
Waist prominence -0.41c 0.86a -1.07 d 0.23b 269.69***
Abdomen angle -0.32c -0.36c 0.92a 0.56b 102.13***
LFT: Lateral-Front Type,
***p≤.001, Duncan test: a>b>c>d
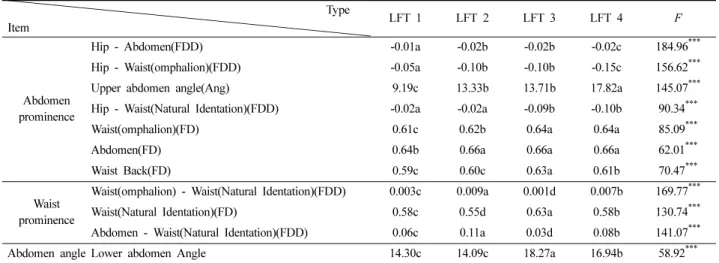
Table 9. Difference verification of index values and angles by lateral front type Type
Item LFT 1 LFT 2 LFT 3 LFT 4 F
Abdomen prominence
Hip - Abdomen(FDD) -0.01a -0.02b -0.02b -0.02c 184.96***
Hip - Waist(omphalion)(FDD) -0.05a -0.10b -0.10b -0.15c 156.62***
Upper abdomen angle(Ang) 9.19c 13.33b 13.71b 17.82a 145.07***
Hip - Waist(Natural Identation)(FDD) -0.02a -0.02a -0.09b -0.10b 90.34***
Waist(omphalion)(FD) 0.61c 0.62b 0.64a 0.64a 85.09***
Abdomen(FD) 0.64b 0.66a 0.66a 0.66a 62.01***
Waist Back(FD) 0.59c 0.60c 0.63a 0.61b 70.47***
Waist prominence
Waist(omphalion) - Waist(Natural Identation)(FDD) 0.003c 0.009a 0.001d 0.007b 169.77***
Waist(Natural Identation)(FD) 0.58c 0.55d 0.63a 0.58b 130.74***
Abdomen - Waist(Natural Identation)(FDD) 0.06c 0.11a 0.03d 0.08b 141.07***
Abdomen angle Lower abdomen Angle 14.30c 14.09c 18.27a 16.94b 58.92***
FDD: Front-Depth Drop, FD:Front Depth,
***p≤.001, Duncan test: a>b>c>d
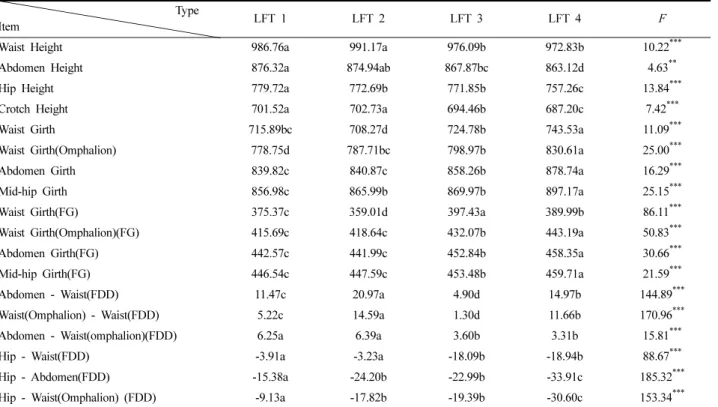
values of the size items from the LFT shows that differences between each type do not necessarily reflect the index values and measured values. This is because the lateral factors which form the shape differ significantly compared to the factors of the front shape.
Therefore, the value in describing the shape exactly by comparing the measured values of the size items is limited(Table 10).
Results of cross tabulation for LFT and age group showed that there are types with a high prevalence for each age group. Those in their forties showed 4 types of LFT with a 15~30% prevalence, showing that this age range has a variety of body types. For people in their thirties, types other than LFT4 showed a prevalence of 20%
or higher. For people in their twenties, LFT1 and LFT2 had a com- bined prevalence of 90%. For people in their fifties and sixties, types other than LFT1 showed a 20% or higher prevalence. As shown, body types for each age group differed slightly from one another, so we expected that future research would examine side body types classified according to age in greater detail.
3.2.2.2. Lateral-back type through cluster analysis
Cluster analysis on the somatotype of the lateral back side of the lower body resulted in four classifications for expressing buttocks prominence of the lower body. Among the analysis findings on lat- eral back of lower body, the lateral back factor to explain the shape of hip protrusion was used for cluster analysis, enabling the clas-
Table 10. Difference verification of measured values by lateral front type (Unit:mm)Type
Item LFT 1 LFT 2 LFT 3 LFT 4 F
Waist Height 986.76a 991.17a 976.09b 972.83b 10.22***
Abdomen Height 876.32a 874.94ab 867.87bc 863.12d 4.63**
Hip Height 779.72a 772.69b 771.85b 757.26c 13.84***
Crotch Height 701.52a 702.73a 694.46b 687.20c 7.42***
Waist Girth 715.89bc 708.27d 724.78b 743.53a 11.09***
Waist Girth(Omphalion) 778.75d 787.71bc 798.97b 830.61a 25.00***
Abdomen Girth 839.82c 840.87c 858.26b 878.74a 16.29***
Mid-hip Girth 856.98c 865.99b 869.97b 897.17a 25.15***
Waist Girth(FG) 375.37c 359.01d 397.43a 389.99b 86.11***
Waist Girth(Omphalion)(FG) 415.69c 418.64c 432.07b 443.19a 50.83***
Abdomen Girth(FG) 442.57c 441.99c 452.84b 458.35a 30.66***
Mid-hip Girth(FG) 446.54c 447.59c 453.48b 459.71a 21.59***
Abdomen - Waist(FDD) 11.47c 20.97a 4.90d 14.97b 144.89***
Waist(Omphalion) - Waist(FDD) 5.22c 14.59a 1.30d 11.66b 170.96***
Abdomen - Waist(omphalion)(FDD) 6.25a 6.39a 3.60b 3.31b 15.81***
Hip - Waist(FDD) -3.91a -3.23a -18.09b -18.94b 88.67***
Hip - Abdomen(FDD) -15.38a -24.20b -22.99b -33.91c 185.32***
Hip - Waist(Omphalion) (FDD) -9.13a -17.82b -19.39b -30.60c 153.34***
FG: Front-Girth, FDD: Front-Depth Drop,
***p≤.001, Duncan test: a>b>c>d
Table 11. Cross-tabulation of age group and LFT (Unit : N, %)
Type Age Group
Total
20s 30s 40s 50s 60s
LFT1
N 123 47 36 12 1 219
% of Age 69.1 30.3 24.2 16.4 2.7 37.0
% of Type 56.2 21.5 16.4 5.5 0.5 100.0
% of Total 20.8 7.9 6.1 2.0 0.2 37.0
LFT2
N 44 70 61 22 10 207
% of Age 24.7 45.2 40.9 30.1 27.0 35.0
% of Type 21.3 33.8 29.5 10.6 4.8 100.0
% of Total 7.4 11.8 10.3 3.7 1.7 35.0
LFT3
N 9 25 21 20 13 88
% of Age 5.1 16.1 14.1 27.4 35.1 14.9
% of Type 10.2 28.4 23.9 22.7 14.8 100.0
% of Total 1.5 4.2 3.5 3.4 2.2 14.9
LFT4
N 2
2 13 13
31 31
19 19
13 13
78
% of Age 78
% of Age 1.1 8.4 20.8 26.0 35.1 13.2
% of Type 2.6 16.7 39.7 24.4 16.7 100.0
% of Total 0.3 2.2 5.2 3.2 2.2 13.2
Total
N 178
178 155 155
149 149
73 73
37 37
592
% of Age 592
% of Age 100.0 100.0 100.0 100.0 100.0 100.0
% of Type 30.1 26.2 25.2 12.3 6.3 100.0
% of Total 30.1 26.2 25.2 12.3 6.3 100.0 χ2=172.11***
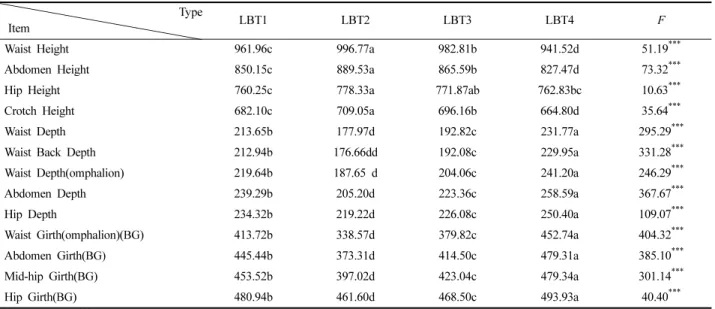
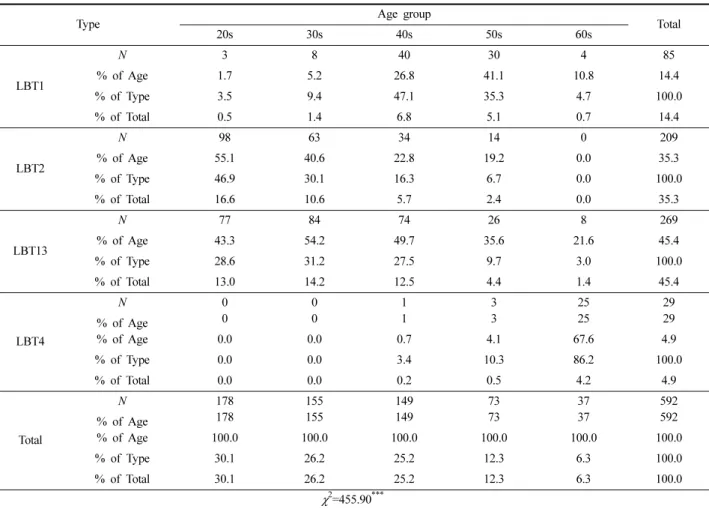
sification of the LBT of the lower body into 4 types. Aggregating the factor scores and the averages of the index values and measured values, this study found the following results on the LBT of the lower body(Table 12, Table 13, Table 14). The results of cross tab- ulation analysis of LBT and age group were shown in Table 15.
Table 15 showed that there was also a difference in LBT according to age group.
LBT1 had a small depth difference between the back waist and
the hip. Fat was accumulated in the back waist, creating a gentle curving silhouette from the waist to the hip. The LBT1 type occurred most often among people in their forties, but when it comes to ratio, different distributions were shown depending on age standard and LBT. For LBT1 prevalence rate at each age group, fifties age group had the highest value, 41.1%. When we analysed the age distribution of subjects who fell into the category of LBT1, we saw that forty people in their forties fit into this cat-
Table 12. Difference verification of factor score by lateral back typeType Factor
LBT 1 (n=85)
LBT 2 (n=209)
LBT 3 (n=269)
LBT 4
(n=29) F
Buttocks prominence -0.18b 0.08a -0.10b -0.17b 46.46***
Back side silhouette of waist to abdomen 1.23b -0.87d 0.27c 2.54a 1,265.86***
Lower body height 0.00a 0.03a -0.04a 0.05a 0.26
***
p≤.001, Duncan test: a>b>c>d
Table 13. Difference verification of index values and angles by lateral back type Type
Item LBT1 LBT2 LBT3 LBT4 F
Buttocks prominence
Hip - Abdomen(BDD) 0.10c 0.20a 0.13b 0.05d 149.70***
Hip - Waist(omphalion)(BDD) 0.15c 0.28a 0.20b 0.09d 173.73***
Hip(BD) 0.61c 0.68a 0.64b 0.58d 118.76***
Hip - Waist(Natural Identation)(BDD) 0.13c 0.30a 0.20b 0.10d 152.79***
Back side silhouette of waist to abdomen
Waist Back(BD) 0.48a 0.38c 0.44b 0.49a 648.75***
Waist(omphalion)(BD) 0.46b 0.40d 0.45c 0.49a 630.69***
Abdomen(BD) 0.51b 0.48c 0.52b 0.53a 574.92***
Waist(Natural Identation)(BD) 0.44b 0.35d 0.41c 0.46a 498.12***
BDD: Back-Depth Drop, BD:Back Depth.
***p≤.001, Duncan test: a>b>c>d
Table 14. Difference verification of measured values by lateral back type (Unit:mm) Type
Item LBT1 LBT2 LBT3 LBT4 F
Waist Height 961.96c 996.77a 982.81b 941.52d 51.19***
Abdomen Height 850.15c 889.53a 865.59b 827.47d 73.32***
Hip Height 760.25c 778.33a 771.87ab 762.83bc 10.63***
Crotch Height 682.10c 709.05a 696.16b 664.80d 35.64***
Waist Depth 213.65b 177.97d 192.82c 231.77a 295.29***
Waist Back Depth 212.94b 176.66dd 192.08c 229.95a 331.28***
Waist Depth(omphalion) 219.64b 187.65 d 204.06c 241.20a 246.29***
Abdomen Depth 239.29b 205.20d 223.36c 258.59a 367.67***
Hip Depth 234.32b 219.22d 226.08c 250.40a 109.07***
Waist Girth(omphalion)(
BG
) 413.72b 338.57d 379.82c 452.74a 404.32***Abdomen Girth(
BG)
445.44b 373.31d 414.50c 479.31a 385.10***Mid-hip Girth(
BG
) 453.52b 397.02d 423.04c 479.34a 301.14***Hip Girth(
BG
) 480.94b 461.60d 468.50c 493.93a 40.40***BG:Back Girth,
***p≤.001, Duncan test: a>b>c>d
egory, at a prevalence of 47.1%. With respect to waist to hip sil- houette, LBT2 had the curviest silhouette and the most protrusive buttocks in the waist and hip despite its thinness. For people in their twenties, LBT2 had a 55.1% prevalence. For LBT2 prevalence rate, twenties age group had the highest value, 46.9%. LBT2 was the most common body type of people in their 20s. LBT3 had a similar lateral shape with LBT1, but its silhouette in the back waist was more slender. The LBT3 values related to buttocks promi- nence were larger than LBT1 according to index value. For the degree of protrusion from back waist to hip prominence, LBT3 sil- houette had more clearly than LBT1. When measured values were considered, LBT1 was larger than LBT3 in the depth and girth val- ues. LBT4 had the smallest depth difference between the back waist and hip, and features larger, sagging buttocks. The most items other than height were the largest according to measured value and LBT4 occurred most in sixties.
The results for the LFT and LBT cross tabulation for the clas- sified LT(lateral type) was the same as Table 16. The chi-square value for LT combination was 64.97 and showed a significant rela- tion, with a significance level of 0.001. When the prevalence of
each cell is compared, LT13(LFT1 & LBT3) had highest preva- lence, at 17.6% of the total, and LT23(LFT2 & LBT3) had second highest at 16.2%. The prevalence of LBT for each LFT was dif- ferent; LFT1 and LFT2 occurred a lot with types LBT3 and LBT2.
The combination of LBT4 with LFT2 or LFT4 did not exist. It was found that the total number of combinations of LFT and LBT with 5% or higher prevalence rate was 8. Through these results, limiting the numbers of lateral types as existing advanced research does would cause difficulties in designing patterns for customers with varying lower body types. Therefore, detailed classifications of body types were required to create a standard that reflected this variety, rather than integrating them into a single type. For exam- ple, applying current lower body type research to mass customi- zation would improve ready-made pattern fitting for customers with 3-5 types of standardized lower bodies. Or fitting would be improved for only 3-5 types of front lower bodies and 3-5 types of sides. However, customers had a variety of bodily features, so clas- sifying each part of the lower body would allow for ready-made pattern design and pattern alternation standards for these various types. If we combine the results of this paper, we have 64 com-
Table 15. Cross-tabulation of age group and LBT (Unit:N, %)
Type Age group
Total
20s 30s 40s 50s 60s
LBT1
N 3 8 40 30 4 85
% of Age 1.7 5.2 26.8 41.1 10.8 14.4
% of Type 3.5 9.4 47.1 35.3 4.7 100.0
% of Total 0.5 1.4 6.8 5.1 0.7 14.4
LBT2
N 98 63 34 14 0 209
% of Age 55.1 40.6 22.8 19.2 0.0 35.3
% of Type 46.9 30.1 16.3 6.7 0.0 100.0
% of Total 16.6 10.6 5.7 2.4 0.0 35.3
LBT13
N 77 84 74 26 8 269
% of Age 43.3 54.2 49.7 35.6 21.6 45.4
% of Type 28.6 31.2 27.5 9.7 3.0 100.0
% of Total 13.0 14.2 12.5 4.4 1.4 45.4
LBT4
N 0
0
0 0
1 1
3 3
25 25
29
% of Age 29
% of Age 0.0 0.0 0.7 4.1 67.6 4.9
% of Type 0.0 0.0 3.4 10.3 86.2 100.0
% of Total 0.0 0.0 0.2 0.5 4.2 4.9
Total
N 178
178
155 155
149 149
73 73
37 37
592
% of Age 592
% of Age 100.0 100.0 100.0 100.0 100.0 100.0
% of Type 30.1 26.2 25.2 12.3 6.3 100.0
% of Total 30.1 26.2 25.2 12.3 6.3 100.0
χ2=455.90***
binations of lower body types that provide a wider variety of lower body types than existing advanced research does.
4. Conclusions
This study was done to classify the lower body types into 4 clas- sifications of FT, 4 classifications of LFT, and 4 classifications of LBT. 3D body scan data of female adults aged 18-69 was utilized to measure the human bodies based on reference lines. The cross section distances of the major segments of the lower body were then measured. The resulting information was summarized via fac- tor analysis applied to the front and lateral sides of the lower body.
Cluster analysis was then performed. To analyze the shape char- acteristics of the classified lower body types, ANOVA and Dun- can's test were used to compare the index values, absolute values, and angles of each type.
From the results of principal component analysis for the FT, five factors were produced to explain 83.54% of all variables. Those five factors to compose front body shapes were waist to hip lateral silhouette, lower body height, width below hip, cross section dis- tance drop upper hip, hip to crotch silhouette. A cluster analysis was applied to the five factors comprising the front shapes, clas- sifying FT into 4 types. FT1 had the largest waist width and cir- cumference and had a relatively small hip width. FT2 had a clear silhouette for the hip and the pelvis width was larger than waist width, indicating a larger girth of the lower body. FT3 had the high- est angle between the waist and buttock. The people who belong to this type were considered as those who had the ordinary size. FT4 had the largest difference between the waist width and hip width. It was considered a thin body type.
From factor analysis for the lateral factor, six factors with the cumulative % of 89.00 were buttocks prominence, abdomen prom- inence, back side silhouette of waist to abdomen, lower body height, waist prominence, abdomen angle. There were 6 factors comprising the lateral shapes that were segmented into LFT and LBT, which in turn were classified into 4 types each. LFT1 had a
flat front silhouette when viewed from the lateral side. LFT2 had a large difference between waist and abdomen prominence because of the projected abdomen. It represented a thin body which had a prominent abdomen. LFT3 had a prominent upper abdomen with the largest front depth of the waist point. LFT4 showed the biggest waist and abdomen depths. It overall represented a thicker abdo- men. In terms of the LBT of lower body, LBT1 had the second- smallest difference between back depth of abdomen girth point and back depth of the hip girth point. LBT2 had a prominent buttocks because the silhouette of the back waist and hip was the most clear.
LBT3 was most representative of the standard somatotype. LBT4 had the smallest difference between the back depth of the waist and the back depth of the hip, showing a sagging buttock.
Although existing research categorizes lower body types by front, back and side, one notable feature is the lumping of the front and back sides together. Hence it limited application of under- standing variety of body types of customers for mass customization production. However, this research divided and categorized the lower body and proposed a shape classification standard for each part. A pattern alternation algorithm would be proposed by ana- lyzing body surface patterns according to the standard, and com- paring them with standard body type. By combining such an algorithm with an auto-designing pattern program, it would be pos- sible to design patterns that reflect the variety of body types. For instance, specific process are as follows:
1) The classification of lower body types based on each segment 2) Development of regression model for lower body type pre- diction with multinomial logistic regression
3) The analysis of surface pattern comparison among lower body types
4) Development of pattern alteration algorithm 5) Development of automatic pattern drafting program 6) Virtual garment fitting system
Through the process above, pattern alternations can be computed according to lower body features so that patterns may be custom- ized according to type. Lastly, it may contribute to the spread of
Table 16. Cross-tabulation of LFT and LBT (Unit:N)LFT1 LFT2 LFT3 LFT4 Total
(N) (%) (N) (%) (N) (%) (N) (%) (N) (%)
LBT1 36 6.1 31 5.2 3 0.5 15 2.5 85 14.4
LBT2 66 11.1 80 13.5 40 6.8 23 3.9 209 35.3
LBT3 104 17.6 96 16.2 29 4.9 40 6.8 269 45.4
LBT4 13 2.2 0 0.0 16 2.7 0 0.0 29 4.9
Total 219 37.0 207 35.0 88 14.9 78 13.2 592 100
χ
2=64.97
***mass customization production by proposing a lower body part classification and method of altering ready-made patterns accord- ing to FT and LT. The characteristics of each individual shape must be reflected in the design patterns to ensure successful mass cus- tomization. This study reflected the lower body shape features of each consumer, enabling us to provide the best Fit for consumers.
Follow-up studies are required to understand the difference in shapes with respect to age, and to gather greater insight in the lower back shapes from the rear.
References
Choi, Y. K. (1997). Shape classification of body type on adult female and its variation of size and shape according to their age.
Unpublished doctoral dissertation, Seoul National University, Seoul.
Choi, Y. L. (2008). Classification of upper lateral body shapes and pattern alteration for mass customization. Unpublished doctoral dissertation, Seoul National University, Seoul.
Hahm, O. S., & Chung, I. H. (1999). A study on the basic sacks pattern for middle aged women based on their lower body shape analysis.
The Research Journal of the Costume Culture, 7(6), 140-158.
Jang, S. E., & Chang, J. H. (2008). A study on a men's dress shirt pattern by somatotype for mass customization system. Journal of the Korean Society of Clothing and Textiles, 32(2), 294-306.
doi:10.5850/JKSCT.2008.32.2.294
Jung, M. S. (1994). Classification of somatotype and its characteristic according to age group of adult female. Unpublished doctoral dissertation, Seoul National University, Seoul.
Kim, D. H., Kim, S. M., & Park, C. K. (2015). Development of a precise made-to-measure system for Korean air force winter uniform slacks. Journal of the Korean Fiber Society, 52(2), 120- 125. doi:10.12772/TSE.2015.52.120
Kim, H. K., & Lim, J. Y. (1999). Characteristics and classification of the lower body somatotype for the construction of junior high school girls' clothing. Family and Environment Research, 37(1), 109-118.
Kim, I. H., Nam, Y. J., & Kim, S. M. (2011a). Development of air force winter service uniform shirt pattern and automatic pattern
drafting program for MTM production. Journal of the Korean Society of Clothing and Textiles, 35(11), 1271-1284. doi:10.5850/
JKSCT.2011.35.11.1271
Kim, I. H., Nam, Y. J., & Kim, S. M. (2013). Development of air force winter service uniform slacks pattern and automatic pattern drafting program for mass customization. Fashion & Textile Research Journal, 15(2), 256-267. doi:10.5805/SFTI.2013.15.2.256 Kim, K. H., & Lee, K. H. (2011). A research on the pattern fabrication of skirt due to the lower body type of the old aged woman.
Journal of Fashion Business, 15(5), 178-194.
Kim, M. K., Nam, Y. J., Han, H. S., & Choi, Y. L. (2011b). Improve- ment of cross sectional distance measurement method of 3D human body. Fashion & Textile Research Journal, 13(6), 966-971.
Korean Agency for Technology and Standards. (2004). The 5th Size Korea 3D scan & measurement technology report. Seoul: Govern- ment Printing Office.
Moon, M. O. (2001). A study on the young aged women's lower body types-correspondence lower body types by direct measurements with side and back view types from waistline to gluteal furrow line-. Journal of the Korean Society of Clothing and Textiles, 25(8), 1420-1431.
Lee, J. R., Hong, E. S., & Paek, K. J. (2008). Lower body type of women in their thirties after childbirth. Fashion & Textile Research Journal, 10(6), 979-988.
Lee, S. J., & Hong, J. M. (1999). Analysis of lower somatotype on adult women and appearance analysis of flare skirts by using the image processing. Fashion & Textile Research Journal, 1(3), 252- 258.
Lim, J. Y. (2003). Classification of lower frontal and lateral body shapes-junior-high school girls between the ages of 13 and 15 years old-. Family and Environment Research, 41(4), 101-110.
Park, H. J., & Nam, Y. J. (2001). A study on the basic slacks pattern by the automatic drafting for the order-based production -Focused on young women in their twenties-. Journal of the Korean Society of Clothing and Textiles, 25(1), 91-102.
Rasband, J. (1994). Fabulous Fit. New York: Fairchild Publications.
(Received 4 January 2016; 1st Revised 19 January 2016;
2nd Revised 5 February 2016; 3rd Revised 15 February 2016;
Accepted 20 February 2016)