www.jpis.org
pISSN 2093-2278 eISSN 2093-2286 Copyright © 2010 Korean Academy of PeriodontologyThis is an Open Access article distributed under the terms of the Creative Commons Attribution Non-Commercial License (http://creativecommons.org/licenses/by-nc/3.0/).
Marginal bony changes in relation to different vertical positions of dental implants
Jung-Myung Yi1, Jae-Kwan Lee1, Heung-Sik Um1, Beom-Seok Chang1*, Min-Ku Lee2
1Department of Periodontology and Research Institute of Oral Sciences, Gangneung-Wonju National University College of Dentistry, Gangneung, Korea
2Department of Periodontics, Kangbuk Samsung Hospital, Seoul, Korea
Purpose: The purpose of this study was to radiographically evaluate marginal bony changes in relation to different vertical positions of dental implants.
Methods: Two hundred implants placed in 107 patients were examined. The implants were classified by the vertical positions of the fixture-abutment connection (microgap): ‘bone level,’ ‘above bone level,’ or ‘below bone level.’ Marginal bone levels were examined in the radiographs taken immediately after fixture insertion, immediately after second-stage surgery, 6 months after prosthesis insertion, and 1 year after prosthesis insertion. Radiographic evaluation was carried out by measuring the distance between the microgap and the most coronal bone-to-implant contact (BIC).
Results: Immediately after fixture insertion, the distance between the microgap and most coronal BIC was 0.06 ± 0.68 mm; at second surgery, 0.43 ± 0.83 mm; 6 months after loading, 1.36 ± 0.56 mm; and 1 year after loading, 1.53 ± 0.51 mm (mean ± SD). All bony changes were statistically significant but the difference between the second surgery and the 6-month loading was great- er than between other periods. In the ‘below bone level’ group, the marginal bony change between fixture insertion and 1 year after loading was about 2.25 mm, and in the ‘bone level’ group, 1.47 mm, and in ‘above bone level’ group, 0.89 mm. Therefore, the marginal bony change was smaller than other groups in the ‘above bone level’ group and larger than other groups in the
‘below bone level’ group.
Conclusions: Our results demonstrated that marginal bony changes occur during the early phase of healing after implant placement. These changes are dependent on the vertical positions of implants.
Keywords: Alveolar bone loss, Dental implants.
INTRODUCTION
Recent studies have shown that dental implants for missing teeth have a high success rate, but that they also have biolog- ical and biomechanical side effects, as well as esthetic prob- lems. Many studies are in progress to prevent failure of os- seointegration and to enhance the longevity of osseointe- grated implants.
In general, marginal bone loss around dental implants may result in the failure of osseointegration. During the first year
after loading, a typical pattern of bone loss called “sauceriza- tion” occurs. Many studies have reported a marginal bone loss of 0.9-1.6 mm during the first year and 0.05-0.13 mm annu- ally thereafter [1-3]. Success of an implant is defined as less than 1.5 mm of marginal bone loss during the first year after the insertion of the prosthesis and less than 0.2 mm annual bone loss thereafter [4]. Therefore, it is important to minimize marginal bone loss in the early stage.
There is no clear known cause for marginal bone loss. Her- mann et al. [5] suggested several possibilities for marginal
Received: Jul. 27, 2010; Accepted: Sep. 29, 2010
*Correspondence: Beom-Seok Chang
Department of Periodontology, Gangneung-Wonju National University College of Dentistry, 123 Jibyeon-dong, Gangneung 210-702, Korea E-mail: [email protected], Tel: +82-33-640-3188, Fax: +82-33-640-3113
tion of the microgap between the fixture and the abutment.
Quirynen and van Steenberghe [6] reported that the microgap harbored a significant quantity of microorganisms, mainly coccoid cells and nonmotile rods. Persson et al. [7] found gram-negative anaerobic rods such as Fusobacterium, Pre- votella, and Porphyromonas species. A second possibility is the micro-movement of the abutment. Epithelium tends to at- tach to the stable implant rather than to the abutment. There- fore, the epithelium moves apically and bone loss around the dental implant occurs. The final possibility is the interruption of the blood supply at the time of abutment connection. Re- moval of tissues covering the implant fixture during the sec- ond-stage surgery may interrupt the blood supply in the peri- osteum and connective tissues and lead to marginal bone re- sorption around implants.
Hermann’s animal study demonstrated that marginal bony change around a 2-piece endosseous dental implant is depen- dent on the location of the implant placement [5]. Many stud- ies have investigated the relationship between the vertical position of the implant and marginal bony change, but few have been based on humans. The purpose of this retrospec- tive study was to radiographically evaluate the marginal bony changes of 2-piece endosseous dental implants related to the vertical positioning of the implants.
MATERIALS AND METHODS
Study group
This study covered all of the implants placed during the period from January 2002 to June 2009 in the Department of Periodontics, Gangneung-Wonju National University Dental Hospital. Among them, 200 implants, which had been load- ed for more than one year in 107 patients, 64 males and 43 fe- males, were included in this study (Table 1). The patients’ ages ranged from 18 to 70 years.
Patients with uncontrolled systemic disease, implants fol- lowed by guided bone regeneration and a sinus lift procedure, immediate implants, or an inter-implant distance of less than 3 mm were excluded from this study. Smokers received im- plant surgery only after quitting smoking [8,9]. Implants with radiographs that were not clear enough to be read were also excluded.
Two implant systems were used: Branemark MKIII(Nobel
plant, Seoul, Korea).
This study was approved by the Institutional Review Board of Gangneung-Wonju National University Dental Hospital (IRB 2009-4-2).
Study methods Treatment procedures
Implants were installed after complete healing of the extrac- tion site. Second-stage surgery connecting temporary healing abutments followed. The subsequent prosthetic procedures were carried out by the Department of Prosthodontics.
Experimental groups
The implants were classified into 3 groups depending on the vertical position of the platform: ‘bone level,’ ‘above bone level,’ or ‘below bone level’ [10]. If the platform was located within 0.5 mm from the bone level it was considered to be
‘bone level.’ If the platform was located above the bone level by more than 0.5 mm, it was considered to be ‘above bone level.’ When the implant platform was located below the bone level by more than 0.5 mm, it was categorized into the ‘below bone level’ group (Fig. 1, Table 2).
Radiographic examination
Radiographic evaluations were performed using standard- ized radiographs taken immediately after fixture insertion, after second-stage surgery, 6 months after loading, and 1 year after loading.
The paralleling technique using the device (Precision in- strument, Masel Co., Bristol, PA, USA) was used for periapical radiographs. Assuming vertical angulation was identical, only radiographs with clear thread showing were used for repro- ducibility. Periapical radiographs were scanned by a scanner (1680 Pro, Epson Co., Tokyo, Japan) with a resolution of 1,200
Table 1. Distribution of patients and implants by gender.
Male (%) Female (%) Total (%)
No. of patients 64 (60) 43 (40) 107 (100)
No. of implants 125 (63) 75 (37) 200 (100)
Table 2. Classification of vertical positions of implants.
Groups Platform position
Below bone level Below the bone level by more than 0.5 mm Bone level Within 0.5 mm of the bone level Above bone level Above the bone level by more than 0.5 mm Figure 1. Types of implant fixture for this study.
Below bone level Bone level Above bone level
age program (Photoshop CS3, Adobe, San Jose, CA, USA) was used to measure the actual value comparing the pitch of im- plant. All bone levels were evaluated by the same person.
Bone loss was defined as the distance between the micro- gap and the alveolar crest. Bone loss and bone change were measured by analyzing the height of the alveolar crest line from the distal and the mesial part of the implant at each stage [11]. Only vertical bone loss was measured, and bone gain was considered a bone loss of zero [12].
Statistical analysis
Statistical software (SPSS, SPSS Inc., Chicago, IL, USA) was used for statistical analysis. Bony changes between stages were measured by paired t-tests, and differences in bone changes according to the level of implant placement were measured by repeated measures analysis.
RESULTS
Dental implant distribution
Two hundred dental implants were analyzed after being di- vided into mesial and distal surfaces (totalling 400 surfaces).
The number of ‘below bone level’ implants was 71, ‘bone lev- el,’ 236, and ‘above bone level,’ 93. The implant platform at the bone level position constituted the largest percentage (Table 3).
Bone changes around dental implant
The average position of a dental implant immediately after insertion was 0.06 mm above the crestal bone level. The mean distance between the microgap and the crestal bone was 0.43 mm after second-stage surgery, 1.36 mm at 6 months after loading, and 1.53 mm at 1 year after loading. The bony change
0.93 mm, constituting the largest difference (Table 4, Fig. 2).
Bone change around dental implant in relation to position of placement
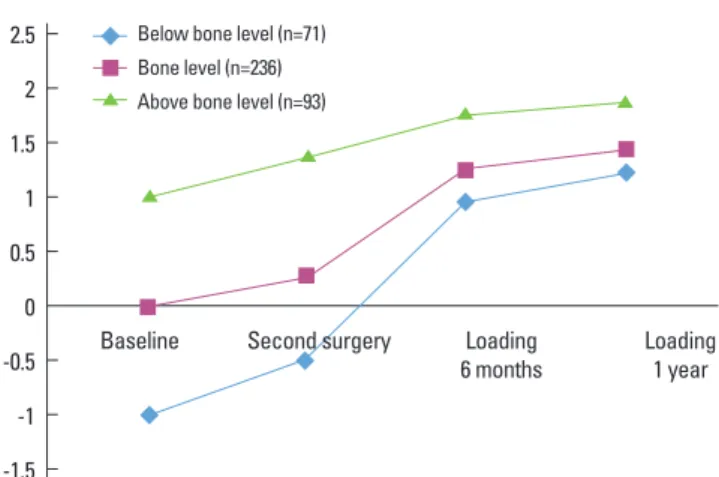
Bone changes in relation to the position of implant place- ment were measured. The distance between the microgap and the crestal bone 1 year after loading was the greatest for the ‘above bone level’ group, and the mean value was 1.93 mm.
Bony level change between baseline and 1 year after loading was 2.25 mm for the ‘below bone level’ group, 1.47 mm for the
‘bone level’ group, and 0.89 mm for the ‘above bone level’
group. The ‘below bone level’ group showed the largest bone changes, whereas the ‘above bone level’ group showed the smallest. (Table 4, Fig. 3).
DISCUSSION
This study evaluated the radiographic changes in marginal bone associated with different vertical position of dental im- plants. Mean distance from the microgap to the crestal bone was 1.53 mm 1 year after loading, and this value is similar to those of previous studies [1-3]. Oh et al. [13] suggested the pos- sible causes for marginal bone loss: surgical trauma, occlusal overload, peri-implantitis, microgap, biologic width, and im- plant crest module. Among these, microgap and biologic width are closely related to this study.
For most of the 2-piece endosseous dental implant systems,
Table 3. Distribution of implants by implant position.
Groups No. of implant surfaces (% of all levels)
Below bone level 71 (18)
Bone level 236 (59)
Above bone level 93 (23)
Total 400 (100) Figure 2. Mean distance from the microgap to the crestal bone of
the mesial surface and the distal surface at each time point.
2
1.5
1
0.5
0 Baseline Second surgery Loading
6 months Loading
1 year Mean (mm)
Table 4. Distance between microgap and crestal bone (mm, mean ± SD).
Baseline Second surgerya) Loading + 6 monthsa) Loading + 1 yeara) Baseline to 1 yearb)
Below bone level -1.01 ± 0.23 -0.45 ± 0.23 0.99 ± 0.63 1.24 ± 0.48 2.25
Bone level 0.002 ± 0.04 0.30 ± 0.52 1.30 ± 0.42 1.47 ± 0.43 1.47
Above bone level 1.04 ± 0.27 1.41 ± 0.59 1.82 ± 0.54 1.93 ± 0.53 0.89
Mean distance 0.06 ± 0.68 0.43 ± 0.83 1.36 ± 0.56 1.53 ± 0.51 1.47
a)Statistically significant difference compared to previous stage (P < 0.05).
b)Statistically significant intergroup difference (P < 0.05).
a microgap was formed between the abutment and the fix- ture after second-stage surgery. Various vertical positions of microgaps may lead to different bone responses. Hermann et al. [5,10] suggested that bone loss could be influenced by the vertical position of the implant, i.e. the vertical positions of the microgaps.
Comparing the radiograph taken immediately after the im- plant was first placed and after the second-stage surgery, an average bone loss of 0.37 mm was observed. We can assume this bone loss was a result of periosteum peeling-off during surgery. Wilderman et al. [14] reported 0.8 mm of horizontal bone loss after bone surgery. The period of largest bone change was that between the second-stage surgery and 6 months after loading, with a difference of 0.93 mm. Jung et al. [15] observed various types of implants for a year after abutment connection, and found that 50% of bone changes occurred during the first three months.
This study observed 0.89 mm of bone change for ‘above bone level’ implant placement, and 2.25 mm for ‘below bone level’ placement. These bone changes may help to maintain a distance between the microgap and the crestal bone. How- ever, the duration of this study is limited to 1 year after load- ing. The final difference between these two groups (‘below bone level,’ ‘above bone level’) is 0.69 mm (Table 4, Fig. 3) which may continue to decrease as the experimental period gets longer.
Some clinicians install implants 1-2 mm deeper than the bony crest in the anterior maxillary regions for a better emer- gence profile. However, this may cause unexpected marginal bone loss and, eventually, esthetic problems. Therefore, to minimize the possibility of unwanted bone loss, it is essential to place the implant platform at an optimal position after careful examination of the anatomy of the teeth, gingiva, and alveolar bone, and the biotype of the patient.
In the Brånemark system, relatively small bone loss occurs
bone loss occurs after the second-stage surgery [16]. The origi- nal Brånemark surgery technique tends to place the implant platform below the bone level to minimize implant move- ment during the bone remodeling period. However, this countersink process and deep positioning of the implant in- evitably cause early marginal bone loss. Therefore, clinicians need to find a compromise between conservation of mar- ginal bone and fixture stability during the healing period.
The process of biologic width formation around implants was described by Berglundh and Lindhe [17] in a dog study.
Berglundh et al. [18] compared the mucosa around implants and teeth. Implants were placed using a two-stage procedure in one side of the mandible, and biopsies from tooth and implant sites were obtained 4 months after abutment con- nection. It was shown that the soft tissue attachment to the teeth and implants was comprised of similar long zones of junctional/barrier epithelium and connective tissue. Abraha- msson et al. [19,20], using similar experimental models, re- ported that the dimensions and composition of the peri-im- plant mucosa were not influenced by the installation proce- dure (submerged or non-submerged) used. In specimens representing 6, 8, and 12 weeks of healing, the length of the barrier epithelium as well as the connective tissue that was in contact with the implant surface was about 2 and 1.5 mm, re- spectively.
Several longer-term studies on 1-piece dental implants with- out a microgap are in progress. Internal connecting-type im- plants, platform switching, fixtures with microthread, and ful- ly coated implants have also been used to minimize bone loss.
This study has several limitations. Although the radiographs were obtained using a parallel long-cone technique with pre- cision instrument, individual devices for the implants were not constructed. Therefore, vertical angulation may not be even. However, to minimize experimental errors, photo- graphs which showed unclear images of threads were exclud- ed. For better results, a prospective study using a customized radiographic instrument would be required.
Although many hypotheses exist about why marginal bone change occurs around implant, the mechanism of marginal bone change has not been clearly explained yet. With more controlled studies, we will be able to establish a clear theory about how marginal bone changes occur around implants, and will be able to develop a predictable implant treatment modality.
CONFLICT OF INTEREST
No potential conflict of interest relevant to this article was reported.
Figure 3. Mean distance of fixture-abutment interface to crestal bone.
2 1.5 1 0.5 0 -0.5 -1 -1.5
Baseline Second surgery Loading
6 months Loading 1 year Bone level (n=236)
Above bone level (n=93)
1. Adell R, Lekholm U, Rockler B, Branemark PI. A 15-year study of osseointegrated implants in the treatment of the edentulous jaw. Int J Oral Surg 1981;10:387-416.
2. Jemt T, Lekholm U, Grondahl K. 3-year followup study of early single implant restorations ad modum Branemark.
Int J Periodontics Restorative Dent 1990;10:340-9.
3. Cox JF, Zarb GA. The longitudinal clinical efficacy of os- seointegrated dental implants: a 3-year report. Int J Oral Maxillofac Implants 1987;2:91-100.
4. Albrektsson T, Isidor F. Consensus report of session V. In:
Lang NP, Karring T, editors. Proceedings of the 1st Europe- an Workshop on Periodontology. London: Quintessence;
1993. p. 365-9.
5. Hermann JS, Cochran DL, Nummikoski PV, Buser D.
Crestal bone changes around titanium implants. A radio- graphic evaluation of unloaded nonsubmerged and sub- merged implants in the canine mandible. J Periodontol 1997;68:1117-30.
6. Quirynen M, van Steenberghe D. Bacterial colonization of the internal part of two-stage implants. An in vivo study.
Clin Oral Implants Res 1993;4:158-61.
7. Persson LG, Lekholm U, Leonhardt A, Dahlen G, Lindhe J.
Bacterial colonization on internal surfaces of Branemark system implant components. Clin Oral Implants Res 1996;
7:90-5.
8. Tarnow DP, Cho SC, Wallace SS. The effect of inter-implant distance on the height of inter-implant bone crest. J Peri- odontol 2000;71:546-9.
9. Bain CA. Implant installation in the smoking patient. Peri- odontol 2000 2003;33:185-93.
10. Hermann JS, Buser D, Schenk RK, Schoolfield JD, Cochran DL. Biologic Width around one- and two-piece titanium implants. Clin Oral Implants Res 2001;12:559-71.
Paquette DW, et al. Comparison of healed tissues adjacent to submerged and non-submerged unloaded titanium dental implants. A histometric study in beagle dogs. Clin Oral Implants Res 1996;7:11-9.
12. Lee DW, Choi YS, Park KH, Kim CS, Moon IS. Effect of mi- crothread on the maintenance of marginal bone level: a 3-year prospective study. Clin Oral Implants Res 2007;18:
465-70.
13. Oh TJ, Yoon J, Misch CE, Wang HL. The causes of early implant bone loss: myth or science? J Periodontol 2002;
73:322-33.
14. Wilderman MN, Pennel BM, King K, Barron JM. Histo- genesis of repair following osseous surgery. J Periodontol 1970;41:551-65.
15. Jung YC, Han CH, Lee KW. A 1-year radiographic evalua- tion of marginal bone around dental implants. Int J Oral Maxillofac Implants 1996;11:811-8.
16. Engquist B, Astrand P, Dahlgren S, Engquist E, Feldmann H, Grondahl K. Marginal bone reaction to oral implants: a prospective comparative study of Astra Tech and Branemark System implants. Clin Oral Implants Res 2002;13:30-7.
17. Berglundh T, Lindhe J. Dimension of the periimplant mu- cosa. Biological width revisited. J Clin Periodontol 1996;23:
971-3.
18. Berglundh T, Lindhe J, Ericsson I, Marinello CP, Liljenberg B, Thomsen P. The soft tissue barrier at implants and teeth.
Clin Oral Implants Res 1991;2:81-90.
19. Abrahamsson I, Berglundh T, Moon IS, Lindhe J. Peri-im- plant tissues at submerged and non-submerged titanium implants. J Clin Periodontol 1999;26:600-7.
20. Abrahamsson I, Berglundh T, Wennstrom J, Lindhe J. The peri-implant hard and soft tissues at different implant sys- tems. A comparative study in the dog. Clin Oral Implants Res 1996;7:212-9.