경락경혈학회지 Vol.27, No.2, pp.107 120, 2010∼ Korean Journal of Acupuncture
Sun-Min Kwon , Hee-Jung Kang , Yun-Kyoung Yim , Yong-Heum Lee
Dept. of Biomedical Engineering, College of Health Science, Yonsei University, Daeyomedi Co., Ltd.
Dept. of Meridian & Acupoint, College of Oriental Medicine, Daejeon University
Abstract
Objectives : The aim of this study is to measure pulse waveforms by applying 5-level graded pressure, and selecting optimum pulse waveforms. Also to proposing the possibility of using AW(Area of the 1/3 upper height of h1) rate in respect to AT(Total Area) for risk assessment of hypertension or arteriosclerosis is another aim of the study.
Methods : Pulse waveforms of normotensive were measured by 5-level graded pressure. The pulse waveforms well reflecting properties of blood vessel(having the largest h1) were selected for optimum pulse waveforms. Various parameters(h-parameter, t-parameter, and others) of optimum pulse waveforms were analyzed. AIx(Augmentation index) was calculated by height-parameters to assess arterial stiffness. The area rate of the 1/3 upper height for h1 in respect to total area was analyzed according to aging.
Results : According to aging
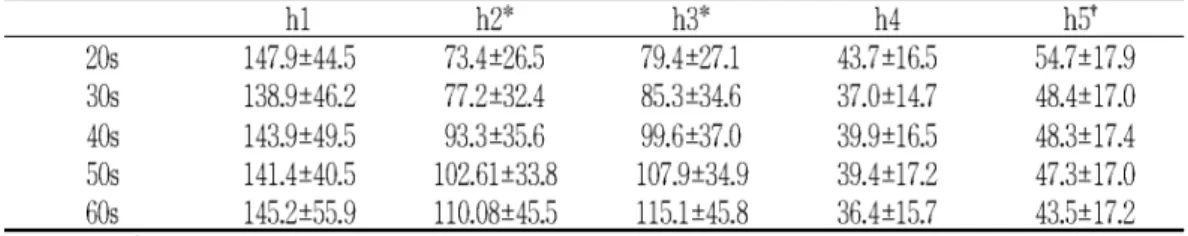
1. in height-parameter, h2 and h3 were increased but h5 was decreased.
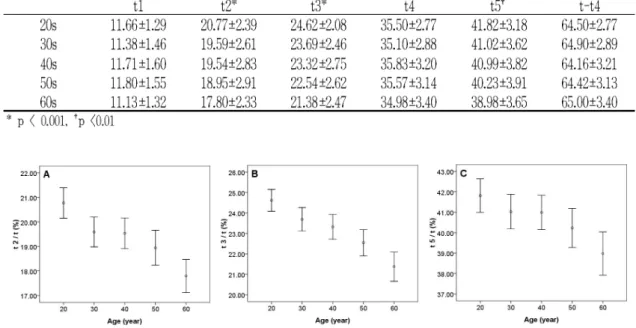
2. In time-parameter, t2, t3, and t5 were getting short.
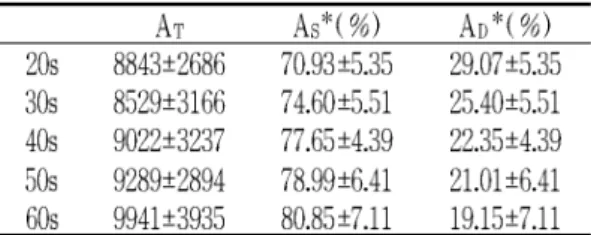
3. Area of systolic period was increased, and that of diastolic period decreased.
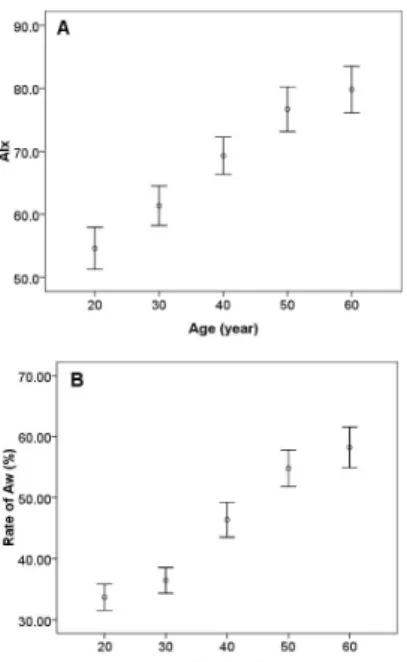
4. AIx rose by aging.
5. AW was significantly increased despite no changes in AT.
Conclusions : By analyzing optimum pulse waveforms of 5-level graded pressure method, we
Table 1. Categories for Blood Pressure Levels in Adult by WHO
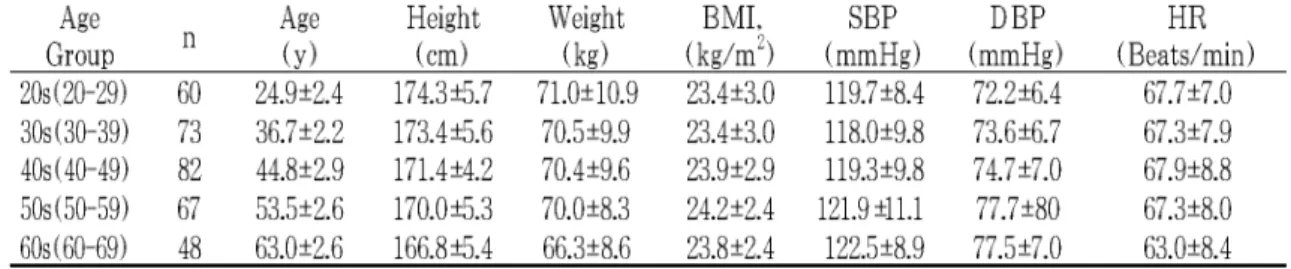
Table 2. Baseline Variables of subject population
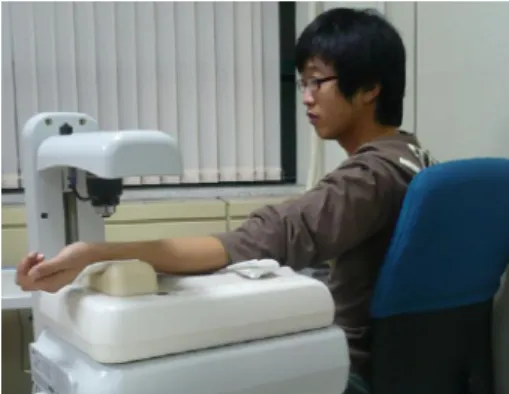
Fig. 1. Pulse waveform measurement in a sitting posture (on left Kwan)
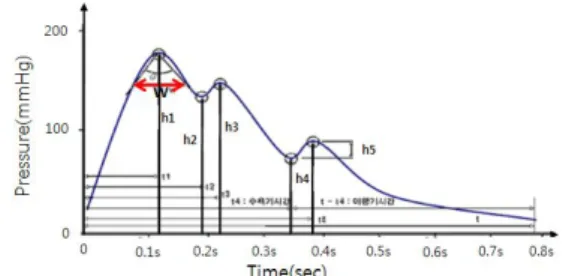
Fig. 2. Pulse waveform on radial artery, and parameters
Table 3. Changes of Height-parameter by aging(div)
Table 4. Changes of Height-parameter rate to h1 by aging(%)
Fig. 3. The effect of aging on h-parameters
Table 5. Changes of Time-parameter rate to t by aging(%)
Fig. 4. The effect of aging on t-parameters
Table 6. Changes of Area-parameter by aging
Table 7. Changes of AIx(Augmentation Index) by aging
Table 8. Changes of W-parameter by aging
Fig. 5. The effect of aging on AIx(Augmentation Index) and Aw(Area of W)
Fig. 6. The correlation between Aw(area of W) and At(total area) (p=0.05)