Effect of Galhwahyejung-tang (GHT) on Alcohol-induced Oxidative Stress in Rats
Dong-Gyu Kim
1, Tae-Hwan Kim
1, Sang-Eun Park
1, Hyung-Geug Kim
2, Chang-Gue Son
2, Sang-Hoon Hong
1*1Department of Internal Oriental Medicine, Dongeui University
2Liver and Immunology Research Center, Daejeon University Original Article
⋅Received:23 April 2010 ⋅Revised:7 July 2010 ⋅Accepted:9 July 2010
⋅Correspondence to:Sang-Hoon Hong
45-1 Yangjeong 1-dong, Busanjin-gu, Busan 614-710, South Korea.
Tel:+82-51-850-8810, Fax:+82-51-867-5162, Email:[email protected]
Objectives: This study was aimed to investigate the effects of Galhwahyejung-tang (GHT) on alcohol-induced oxidative stress in rat model.
Methods: Twenty SD rats were orally administrated with 40% ethanol (mL/kg) combined with GHT (50, 100, 200mg/kg) or distilled water for 2 weeks. Biochemistry in blood, malondialdehyde (MDA), total reactive oxygen species (ROS), and total antioxidant capacity (TAC) in serum, liver, brain, and kidney were determined.
Results: GHT treatment significantly ameliorated the alcohol-induced alteration of hepatic enzyme; especially AST and ALT. GHT treatment also ameliorated the increase of MDA in liver, ROS level in serum and brain. GHT treatment reduced the depletion of antioxidant capacity in serum and brain.
Conclusion: These results that GHT has antioxidant properties explaining the relevance of clinical application and its partial mechanisms of GHT.
Key Words : Alcohol, oxidative stress, Galhwahyejung-tang, traditional Korean medicine
Introduction
Alcohol is a very popular beverage worldwide.
However, the physical/psychological diseases and social problems related to alcohol abuse are very common
1). According to the report for Korea National Statistical Office, the number of alcohol-associated deaths in 2007 was 4,701, and alcohol is the second and third cause of liver cirrhosis and hematoma, respectively
2). Therefore, controlling alcohol abuse or treating alcohol-induced disorders have become important social and medical issues
3).
Alcohol absorbed is generally metabolized mainly in the liver using various enzymes, and then is
eliminated before induction of toxicity
4). However, over-consumption of alcohol induces many disorders including intoxication, dehydration, and ultimately alcohol poisoning in short term cases, while it leads to changes of metabolism in the liver and brain, and possible addiction in the long term case
5). The main mechanism of alcoholic toxicity is supposed to be oxidative stress
6).
On the other hand, there have been many traditional
formulae used for alcoholic disorders in traditional
Korean medicine
7,8). Galhwahyejung-tang (GHT) is a
typical herbal formula used to treat alcohol-induced
symptoms such as vomitting, tremor of the limbs,
anorexia, and mental confusion
9). So far, several
General Name Using part Amount (g) Composition rate (%)
Pueraia thunbergiana Flos 10 15
Amomum villosum Fructus 10 15
Citrus unshiu Green Pericarpium 6 9
Atractylodes macroephala Rhizoma 4 6
Zingiber officinale Rhizoma 4 6
Massa medicata Fermentata 4 6
Alisma olantago-aquatica var orientale Rhizoma 4 6
Panax ginseng Raix 3 5
Poria cocos 3 5
Citrus unshiu Pericarpium 3 5
Aucklandia lappa Raix 1 2
Total amount 65 100
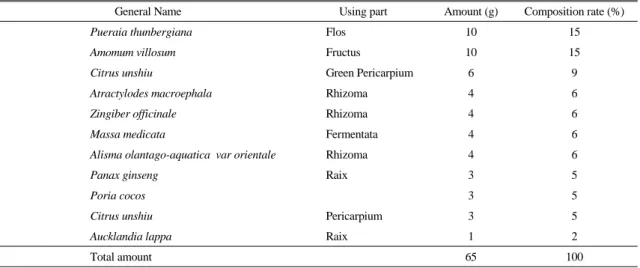
Table 1. Composition of Galhwahyejung-tang (GHT)
studies have presented the effects of GHT, especially on protection of liver from fatty liver and hepatitis using animal models
10,11). The main focus of these studies was on liverfunction; so far no study has been done to test the effects of GHT on other organs such as brain under alcohol toxicity conditions.
The present study aimed to investigate the anti-oxidant effect of GHT in serum and also in other tissues like liver and brain.
Materials and Methods
1. Materials and Preparation of GHT
Absolute ethanol was purchased KGaA (Darmstadt, Germany). 2,2-diphenyl-1-picrylhydrazylradical (DPPH), N,N-diethyl-para-phenylendiamine (DEPPD) sulfate and ferrous sulfate, myoglobin, Trolox, and ABTS were purchased from Sigma Chemicals (St. Louis, MO, USA). Hydrogen peroxide was obtained from Junsei (Tokyo, Japan). All other chemicals and experiment instrument commercially available.
Medical herbs for GHT formula (Table 1) were purchased from Jeong-Seoung oriental herb company (Daejeon, Korea). To extract GHT, 130g of herb mixture were boiled for 2 h with 1.3 L of distilled
water. After filtering, the GHT decoction was freeze-dried using a rotary evaporator. GHT dried extract thus obtained was 14.25 g (final yield 9.5%).
2. Animals and experimental design
Specific pathogen free 6-week-old Sprague Dawley (SD) rats were purchased from a commercial animal breeder (Orient Bio, Gyeongido, South Korea). Rats were acclimatized for 1 week and housed in an environment-controlled room at 22±2℃ with a 12 h light/dark cycle, and provided commercial pellets (Orient Bio) and tap water ad libitum. Twenty-five SD rats were randomly divided into five groups of fiveanimals. 40% ethanol (mL/kg) was treated orally for 2 weeks, except for the normal group. GHT (50, 100, 200 mg/kg) or distilled water was administered two hours before ethanol treatment.
The animals were sacrificed on the fifteenth day, and the liver, kidney and spleen were isolated and weighed. Liver, kidney and brain tissues were stored for estimation of malondialdehyde (MDA), total reactive oxygen species (ROS), and total antioxidant capacity (TAC).
Animal experiments were conducted in accordance
with the Guide for Care and Use of Laboratory
Animals published by the U.S. National Institutes of Health
12).
3. Serum biochemical analysis
Blood was collected via the abdominal aorta under ether anaesthesia onfinal day of the experiment.
Serum was collected following 60 minutes of blood clotting. Serum levels of alanine transaminase (ALT), aspartate (AST), and alkaline phosphatase (ALP) were determined using an Auto Chemistry Analyzer (Chiron, Emeryville, CA, USA).
4. Determination of Malondialdehyde (MDA) Lipid peroxidation levels in the liver, kidney and brain tissue were determined using the method of thiobarbituric acid reactive substances (TBARS)
13). The concentration of TBARS was expressed as uMMDA/g tissue using 1.1.3.3-tetraethoxypropane (TEP) as a standard. Briefly, 0.2 g liver tissue was homogenized in 2 mL ice-cold 1.15% KCl, and 0.13 ml homogenate was mixed with 0.08 ml 1%
phosphoric acid and 0.26 ml 0.67% thiobarbituric acid (TBA). After heating the mixture for 45 min in a dry oven (100℃, 1.03 ml n-butanol was added followed by a vigorous vortexing and centrifugation at 3,000 rpm for 15 min. The absorbance of the upper organic layer was measured at 535 and 525 nm with a spectrophotometer and compared with a TEP standard curve.
5. Determination of total reactive oxygen species (ROS)
Total ROS level in serum, liver and brain tissue were determined according to the method of Hayashi
14). Briefly, hydrogen peroxide was used for generating a calibration curve as standard. DEPPD solution and ferrous sulfate solution (100 ug/mL of DEPPD and 4.37 uM of ferrous sulfate was dissolved in the 0.1 M sodium acetate buffer separately) were prepared beforehand. Five uL of standard solution or
1:10 diluted liver or brain homogenate supernatant were added to 140 uL of 0.1 M sodium acetate buffer (pH 4.8) in each well of 96-well plates. After 5 minutes incubation at 37℃ 100 uL of DEPPD and ferrous mixture solution (scale factor of 1/25 was used) were added to each well. Similarly, 0.1 g organ tissues were homogenized in 1 mL ice-cold RIPA buffer and the same method was followed as described above. The level of ROS was determined at 505 mm using a spectrophotometer with catalytic capability for transition metals, and calculated as equivalent to levels of hydrogen peroxide (1 Unit = 1 mg H
2O
2/L).
6. Determination of total antioxidant capacity (TAC)
TAC levels were determined according to the method of Kambayashi
15). 90 uL of 10 mM phosphate-buffered saline (pH 7.2), 50 uL of myoglobin solution (45 uM), 20 uL of 3 mM ABTS solution, 20 uL of diluted serum sample or tissue sample (liver and brain) and Trolox was added to 96-well microplate and well mixed at 25℃ Then 20 uL of H
2O
2was added to each well, and incubated for 5 min. The absorbance was read using a plate reader at 600 nm (Molecular Device Corp., USA).level of TAC was expressed as Trolox equivalent antioxidant capacity.
7. Statistical analysis
Results were expressed as the mean ± standard deviation (SD). Statistical analysis of the data was carried out by Student’s t-test. A difference from the respective control data at the levels of p < 0.05 was regarded as statistically significant.
Results
1. Effect on body and organ weight
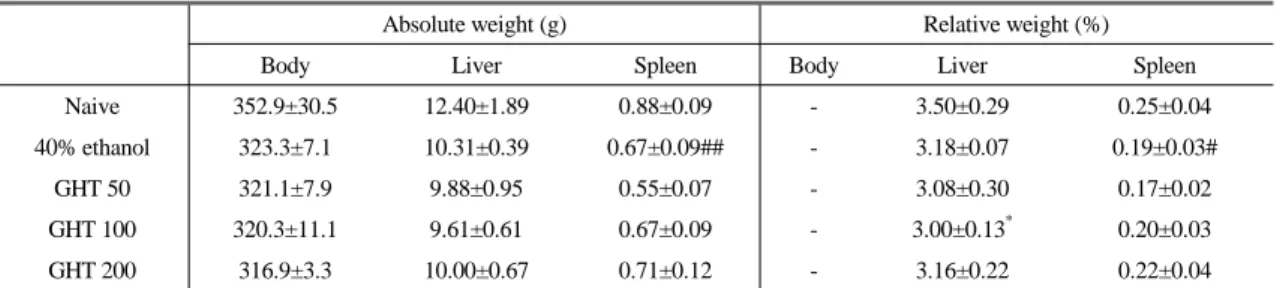
40% ethanol treatment slightly decreased body
weight and liver weight, and significantly spleen weight
Absolute weight (g) Relative weight (%)
Body Liver Spleen Body Liver Spleen
Naive 352.9±30.5 12.40±1.89 0.88±0.09 - 3.50±0.29 0.25±0.04 40% ethanol 323.3±7.1 10.31±0.39 0.67±0.09## - 3.18±0.07 0.19±0.03#
GHT 50 321.1±7.9 9.88±0.95 0.55±0.07 - 3.08±0.30 0.17±0.02 GHT 100 320.3±11.1 9.61±0.61 0.67±0.09 - 3.00±0.13* 0.20±0.03 GHT 200 316.9±3.3 10.00±0.67 0.71±0.12 - 3.16±0.22 0.22±0.04 The rats were administered with 40% ethanol, combined with GHT (50, 100, 200 mg/kg) or distilled water for 14 days. On the final day of the experiment, body and organ weight were measured. Relative organ weight was calculated against body weight. Data are expressed as mean ± SD (n = 5). #P < 0.05, ##P < 0.01 compared to the naive group.
Table 2. Body and organ weights
(p < 0.01) of rats. Co-treatment with GHT slightly ameliorated these changes, but didn’t reach statistical significance. The absolute and relative weight of body and organ weight was summarized (Table 2).
2. Effect on biochemical parameters
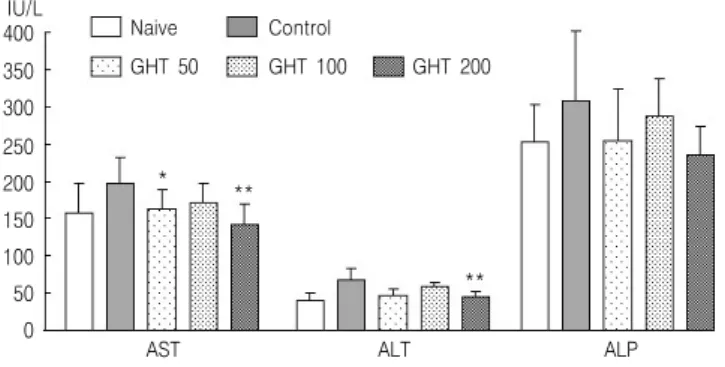
40% ethanol treatment significantlyelevated ALT and moderately AST and ALP. In contrast, GHT ameliorated elevations in ALT (P < 0.01) and AST (P < 0.01), especially in the GHT 200 group (Fig 1).
3. Effect on MDA levels
40% ethanol treatment significantly elevated MDA levels in the liver, but not in the kidney or brain.
Significant change in MDA (p < 0.05) was seen in GHT group. No significant change was observed in kidney and brain tissue on GHT (Fig 2).
4. Effect on total ROS level
40% ethanol treatment significantly elevated ROS level in serum, liver, and brain. GHT slightly ameliorated these elevations in all tissues. The GHT 200 group showed significantly lower ROS level in serum (p < 0.05) and brain (p < 0.01). No significant difference was observed in the liver (Fig. 3).
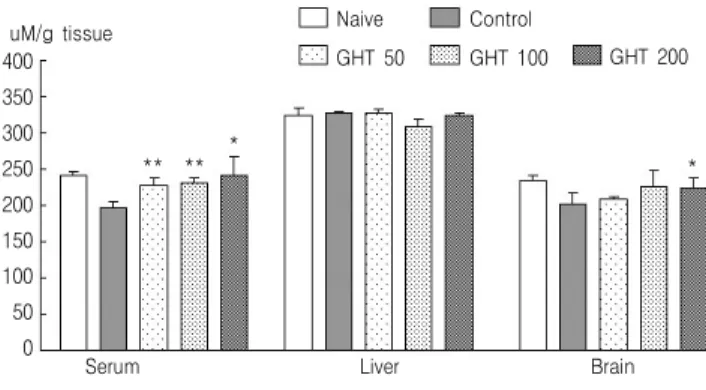
5. Effect on TAC level
40% ethanol treatment moderately depleted antioxidant capacity in serum and the brain. The depletion of TAC
in serum was significantly ameliorated by 50 and 100 mg of GHT (p < 0.01) and 200 mg of GHT treatment (p < 0.05). In brain tissue, 200 mg of GHT treatment significantly inhibited depletion of TAC (p < 0.05).
However, no difference was observed in the liver tissues of the control and GHT groups (Fig. 4).
Discussion
Oxidative stress is defined as a combination of excessive generation of reactive oxygen species (ROS) and decreased antioxidant defenses
16). Over consumption of alcoholicbeverages causes production of ROS such as superoxide, hydrogen peroxide, or hydroxyl radicals as well as distortion of various protective systems including free radical scavengers, superoxide dismutase (SOD), catalase, and the glutathione oxidation/reduction system
17). This unbalanced state is a major pathogenic mechanism contributing to alcoholic symptoms and damage to various organs.
GHT is a typical herbal formula that has been
prescribed for patients with various symptoms associated
with alcohol abuse. Accordingly, it is proposed that
GHT has antioxidant pharmaceuticalproperties. One
study previously revealed its antioxidant effects
especially against ethanol-administrated rat stomach,
including inhibition of lipid peroxidation, and
maintaining of glutathione and SOD contents
18). We
herein adapted a two-week ethanol treatment in a rat
IU/L 400 350 300 250 200 150 100 50
0 AST ALT ALP
Naive GHT 50
Control
GHT 100 GHT 200
* **
**
Fig. 1. Changes in serum biochemical parameters.
Rats were administrated 40% ethanol with/without GHT for two weeks. On the last day, AST, ALT, and ALP value in serum were measured. Data are expressed as mean ± SD (n = 5). *P < 0.05, **P < 0.01 compared to the control group.
Naive GHT 50
Control
GHT 100 GHT 200 60
50 40 30 20 10
0 Liver Kidney Brain
uM/g tissue
*
Fig. 2. Change of MDA level.
Rats were administrated 40% ethanol with/without GHT for two weeks. MDA values in liver, kidney, and brain serum were measured. Data are expressed as mean ± SD (n = 5). *P < 0.05 compared to the control group.
Naive GHT 50
Control
GHT 100 GHT 200 600
500 400 300 200 100 0 Unit
Serum Liver Brain
*
**
Fig. 3. Change of ROS level.
Rats were administrated 40% ethanol with/without GHT for two weeks. ROS value in serum, liver, and brain were measured.
Data are expressed as mean ± SD (n = 5). *P < 0.05, **P < 0.01 compared to the control group.
Naive GHT 50
Control GHT 100 400
350 300 250 200 150 100 50
0 Serum Liver Brain
uM/g tissue
** **
*
* GHT 200
Fig. 4. Change of TAC level.
Rats were administrated 40% ethanol with/without GHT for two weeks. TAC value in serum, liver, and brain were measured. Data are expressed as mean ± SD (n = 5). *P < 0.05, **P < 0.01 compared to the control.