Structured Model for PHB Production (PHB)
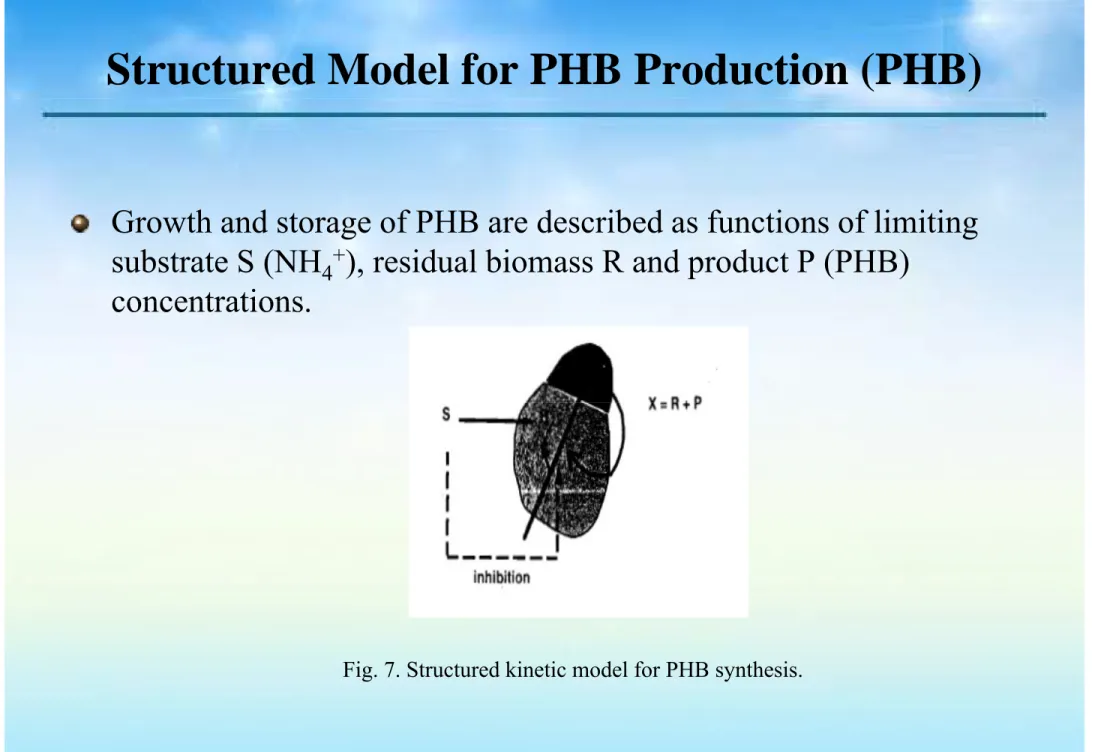
Growth and storage of PHB are described as functions of limiting substrate S (NH
4+), residual biomass R and product P (PHB)
concentrations concentrations.
Fig. 7. Structured kinetic model for PHB synthesis.
PHB [ Model ]
For the batch process,
μR dt r
dR
R=
=
Where rR is the rate of synthesis of R and μ is the specific rate of synthesis y μ p y of R,where
n S,2
n S,2 m,2
S,1 m,1 2
1 1 (S/K )
) μ (S/K
S K
μ S μ
μ
μ + +
= + +
=
PHB [ Model ]
For substrate
1 dS
The rate of synthesis of P(r ) is assumed to be the sum of a growth
R R/S
S r
Y r 1
dt
dS = = −
The rate of synthesis of P(rP) is assumed to be the sum of a growth
associated term(rP,1) and a biomass associated term(rP,2) and is given by,
dP
Th th i t d t f th th i f P( )
P,2
P,1
r
r dt r
dP = = +
The non-growth associated term of the synthesis of P(rP,2)
R) k P k K (
r =
1( k P + k R) S)
r (K
1 21
P,2
− +
= +
PHB [ Program ]
M-file
PHB [ Program ]
Command window
PHB [ Nomenclature ]
C1 Concentration kg/m3
K Inhibition constant for (NH ) SO kg/m K1 Inhibition constant, for (NH4)2SO4 kg/m3 KS Saturation constantkg/m3
n Hill coefficient –
P P d t t ti (PHB) k / P Product concentration (PHB) kg/m3 Prot Protein concentration kg/m3
R Residual biomass(R=X-P) kg/m3 r Reaction rate kg/(m3h)
rP,red Reduced rate of synthesis of PHB –
S Limiting substrate NHg 44+as (NH( 44))22SO44 kg/mg 33 X Biomass concentration kg/m3
YP/R Yield coefficient kg/kg YR/S Yield coefficient kg/kg YR/S Yield coefficient kg/kg
μ Specific rate of synthesis of R (rR/R) 1/h μP Specific rate of synthesis of P (rP/P) 1/h
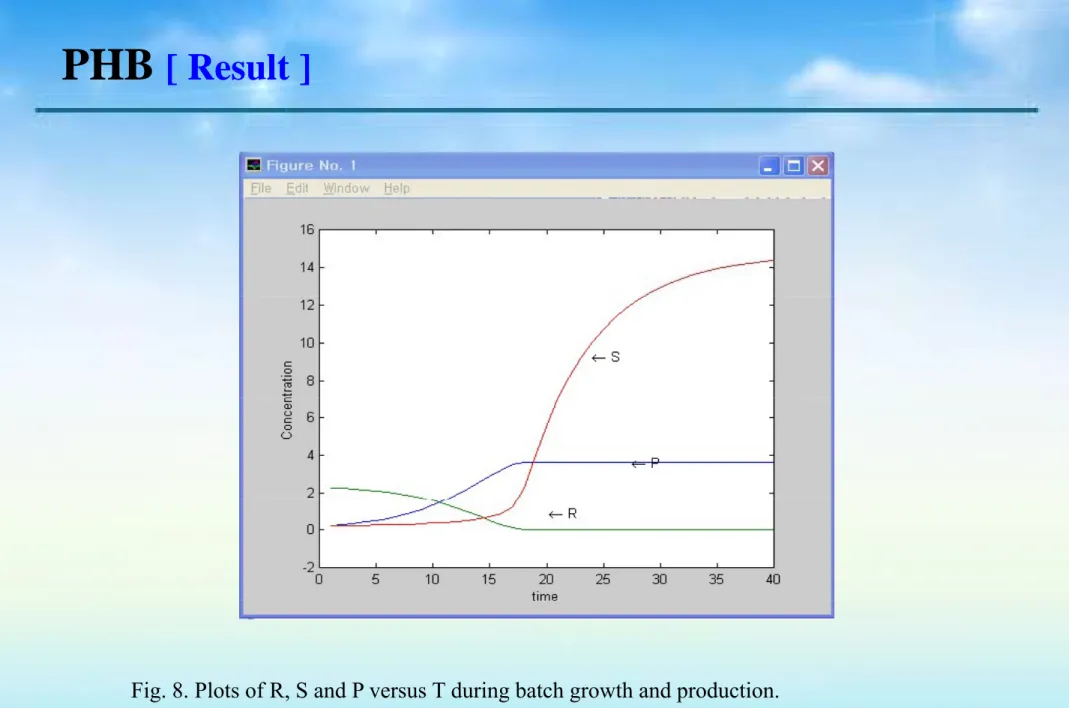
PHB [ Result ]
Fig. 8. Plots of R, S and P versus T during batch growth and production.g g g p