Efficacy of Body Weight Reduction on the SGLT2 Inhibitor in People with Type 2 Diabetes Mellitus
Hyun A Cho, Young Lee Jung, Yong Hoon Lee, Yu Chang Lee, Jung Eun Lee, Sol Jae Lee, Su Jin Jeong, Chong Hwa Kim*
Division of Endocrinology and Metabolism, Department of Internal Medicine, Sejong General Hospital, Bucheon, Korea
Background: Dapagliflozin, a sodium-glucose cotransporter-2 inhibitor, reduces hyperglycemia and body weight by inhibiting renal glucose reabsorption. However, only a few studies have demonstrated efficacy of dapagliflozin for type 2 diabetic patients in Korea. We evaluated the efficacy and safety of dapagliflozin for Kore- an type 2 diabetes patients.
Methods: This is a retrospective study that included data from 61 patients who received 12 months of dapa- gliflozin therapy and who visited a single medical center between January 2015 and July 2016. Patients were separated into three groups: dual combination of dapagliflozin and metformin, triple combination of dapa- gliflozin and metformin with sulfonylurea, or dipeptidyl peptidase IV inhibitors, and quadriple combination of dapagliflozin, metformin, and sulfonylurea with dipeptidyl peptidase IV inhibitors. Patients who achieved ≥5%
body weight reduction were classified as responders, and those who achieved <5% body weight reduction were classified as non-responders.
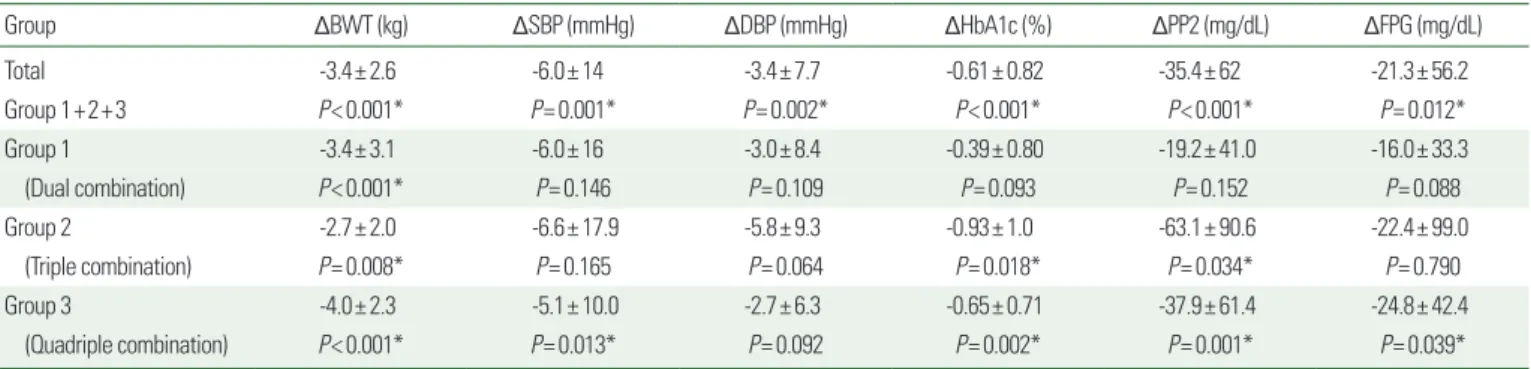
Results: After 12 months, the mean change from baseline body weight was -3.4±2.6 kg (P<0.001) for all pa- tients, -3.4±3.1 kg (P<0.001) for group 1, -2.7±2.0 kg (P=0.008) for group 2, and -4.0±2.3 kg (P<0.001) for group 3. Fasting C-peptide level was higher in the responder group than in the non-responder group (3.25±
1.07 ng/mL vs. 2.62±1.02 ng/mL, P=0.023). In total, reductions in HbA1c, PP2, and FPG levels were -0.61±
0.82% (P=0.000), -35.4±62 mg/dL (P=0.000), and -21.3±56.2 mg/dL (P=0.012), respectively. They had mild adverse events included orthostatic dizziness and urinary tract infection.
Conclusion: SGLT2 inhibitor improved glycemic control and reduced body weight in a safe manner for patients with type 2 diabetes mellitus.
Key words: SGLT2 inhibitor, Dapagliflozin, Body weight reduction
Received September 7, 2016 Reviewed October 3, 2016 Accepted November 4, 2016
* Corresponding author Chong Hwa Kim
http://orcid.org/0000-0002-4563-7772 Division of Endocrinology and Metabolism, Department of Internal Medicine, Sejong General Hospital, 28 Hohyeon-ro 489beon-gil, Sosa-gu, Bucheon 14754, Korea
Tel: +82-32-340-1116 Fax: +82-32-340-1834 E-mail: drangelkr@hanmail.net
INTRODUCTION
Recent studies have shown that intensive glucose control re- duced the incidence of diabetes-related complications.
1,2However, tight glycemic control is also associated with hypoglycemic events and weight gain. Furthermore, obesity prevalence has increased rapidly due several factors, including genetic predisposition, envi- ronmental exposure, and aging processes. Also, obesity has been associated with diabetes incidence and diabetes complications.
Dapagliflozin, a highly selective sodium-glucose cotransporter-2 (SGLT-2) inhibitor, reduces hyperglycemia by inhibiting renal glu- cose reabsorption and increasing urinary glucose excretion. Dapa- gliflozin has also been associated with caloric consumption, leading to weight loss and reduced blood pressure.
3-8Several randomized-control clinical trials have demonstrated the efficacy of dapagliflozin compared to other oral antidiabetic agents, such as metformin, sulfonylurea, dipeptidyl peptidase IV (DPP-4) inhibitors, and thiazolidinediones.
3-8However, only a few of these
Copyright © 2017 Korean Society for the Study of Obesity
This is an Open Access article distributed under the terms of the Creative Commons Attribution Non-Commercial License (http://creativecommons.org/licenses/by-nc/4.0/) which per- mits unrestricted non-commercial use, distribution, and reproduction in any medium, provided the original work is properly cited.
studies evaluated dapagliflozin efficacy in type 2 diabetic patients in Korea. Here, we address not only the efficacy of dapagliflozin for Korean type 2 diabetes patients, but also the parameters that pre- dict body weight reduction among dapagliflozin-administered pa- tients in clinical practice in Korea.
METHODS
This was a retrospective, cross-sectional study analyzing data from 61 patients who received a minimum of 12 months of dapa- gliflozin therapy (10 mg, once daily) at Sejong General Hospital between January 2015 and July 2016. Patients were selected ac- cording to the following inclusion criteria: age between 18-75 years, type 2 diabetes mellitus (T2DM), and use of dapagliflozin for longer than 12 months. Exclusion criteria were a therapy regi- men that included insulin or a glucagon like peptide-1 (GLP-1) ag- onist; type 1 DM, gestational diabetes mellitus (GDM), or maturi- ty onset diabetes of the young (MODY); active cancer; or lost to
follow-up. Enrolled patients were classified into one of three treat- ment regimens: group 1) a dual combination of dapagliflozin and metformin; group 2) a triple combination of dapagliflozin and metformin with sulfonylurea or dipeptidyl peptidase IV (DPP-4) inhibitors; group 3) a quadriple combination of dapagliflozin, met- formin, and sulfonylurea with DPP-4 inhibitors (Fig. 1). This study was approved by the Institutional Review Board (IRB) of Sejong General Hospital.
Statistical analysis
All statistical computations were performed using SPSS version 23.0 (IBM Corp., Armonk, NY, USA). Data were reported as mean± standard deviation. For analysis of the entire patient sam- ple, we performed Kruskal-Wallis tests. Wilcoxon signed-rank tests were used to compare values before and after dapagliflozin use. Sta- tistical comparisons between the groups to identify responders and non-responders were performed using the Mann-Whitney test.
Data with a P<0.05 were considered significant.
Figure 1. Study flow. We analyzed data from 61 patients who underwent a minimum of 12 months of dapagliflozin therapy (10 mg once-daily) and who visited Sejong General Hospital between January 2015 and July 2016. Patients were selected according to the following inclusion criteria: age between 18-75 years and type 2 DM. Pa- tients were excluded if they took dapagliflozin for less than 12 months; their therapy was combined with an insulin or GLP-1 agonist; they had type 1 DM, GDM, or MODY;
they were an active cancer patient; or were lost to follow-up. Patients were assigned to one of three ongoing dapagliflozin+ treatment regimens: group 1) metformin; group 2) metformin with sulfonylurea or dipeptidyl-peptidase IV (DPP-4) inhibitors; group 3) metformin and sulfonylurea with dipeptidyl peptidase IV (DPP-4) inhibitors (Group 3).
GLP-1, glucagon like peptide-1; GDM, gestational diabetes mellitus; MODY, maturity onset diabetes of the young; MFM, metformin; SU, sulfonylureas; DPP-IV I, dipeptidyl peptidase IV inhibitors.
729 Total dapagliflozin user
Study design
668 Withdrawal 1) Age ≥ 75
2) Take dapagliflozin for less than 12 months 3) Combined with insulin or GLP1-agonist 4) Type 1DM, GDM, MODY
5) Active cancer patient 6) Follow up loss
Dual combination- + MFM
Triple combination- + MFM
+ SU/DPP IV I Quadriple combination- + MFM + SU + DPP IV I
25 MFM + SU + DPP IV I
+ Dapagliflozin 24
Metformin + Dapagliflozin
12 MFM + SU/DPP IV I
+ Dapagliflozin
Group 1 Group 2 Group 3
RESULTS Baseline characteristics of the subjects
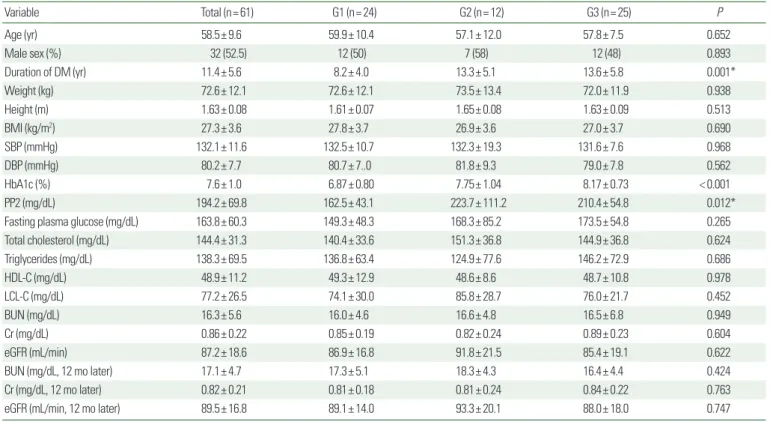
We reviewed 729 diabetic subjects who visited the department of endocrinology and metabolism at Sejong General Hospital in Bucheon, Korea, between January 2015 and July 2016. Among 61 enrolled type 2 diabetic subjects, 32 (52.5%) were men and 29 (47.5%) were women. In this study, the treatment group, who re- ceived 10 mg of dapagliflozin once daily, experienced significant decreases in all glucose parameters for type 2 diabetes mellitus. Ta- ble 1 summarizes the baseline characteristics of the subjects. Mean age and DM duration were 58.5± 9.6 years and 11.4± 5.6 years, re- spectively, while mean body weight and baseline body mass index (BMI) were 72.6 ± 12.1 kg and 27.3 ± 3.6 kg/m
2, respectively.
More than half of the patients in our study were obese (60%, n= 37). Mean HbA1c, 2-hour postprandial plasma glucose (PP2) level, and fasting plasma glucose (FPG) level were 7.6 ± 1.0%,
194.2± 69.8 mg/dL, and 163.8± 60.3 mg/dL, respectively. Mean creatinine and eGFR levels were 0.86± 0.22 mg/dL and 87.2± 18.6 ml/min, respectively. There were no detrimental effect on renal function over period of dapagliflozin add-ons.
Metabolic effects of dapagliflozin included glycemic and lipid control
All treatment groups experienced improvements in HbA1c, PP2, and FPG. For the total subject sample, reductions in HbA1c, PP2, and FPG levels were -0.61± 0.82% (P<0.001), -35.4±62 mg/dL (P<0.001), and -21.3±56.2 mg/dL (P=0.012), respectively. For group 1, the reductions in HbA1c, PP2, and FPG levels were 0.39 ± 0.80% (P =0.093), -19.2 ±41.0 mg/dL (P =0.152), and -16.0± 33.3 mg/dL (P=0.088), respectively. For group 2, the re- ductions in HbA1c, PP2, and FPG levels were -0.93 ± 1.0%
(P=0.018), -63.1±90.6 mg/dL (P=0.034), and -22.4±99.0 mg/
dL (P=0.790), respectively. For group 3, the reductions in HbA1c,
Table 1. Baseline characteristics of the subjects
Variable Total (n= 61) G1 (n= 24) G2 (n= 12) G3 (n= 25) P
Age (yr) 58.5± 9.6 59.9± 10.4 57.1± 12.0 57.8± 7.5 0.652
Male sex (%) 32 (52.5) 12 (50) 7 (58) 12 (48) 0.893
Duration of DM (yr) 11.4± 5.6 8.2± 4.0 13.3± 5.1 13.6± 5.8 0.001*
Weight (kg) 72.6± 12.1 72.6± 12.1 73.5± 13.4 72.0± 11.9 0.938
Height (m) 1.63± 0.08 1.61± 0.07 1.65± 0.08 1.63± 0.09 0.513
BMI (kg/m2) 27.3± 3.6 27.8± 3.7 26.9± 3.6 27.0± 3.7 0.690
SBP (mmHg) 132.1± 11.6 132.5± 10.7 132.3± 19.3 131.6± 7.6 0.968
DBP (mmHg) 80.2± 7.7 80.7± 7..0 81.8± 9.3 79.0± 7.8 0.562
HbA1c (%) 7.6± 1.0 6.87± 0.80 7.75± 1.04 8.17± 0.73 < 0.001
PP2 (mg/dL) 194.2± 69.8 162.5± 43.1 223.7± 111.2 210.4± 54.8 0.012*
Fasting plasma glucose (mg/dL) 163.8± 60.3 149.3± 48.3 168.3± 85.2 173.5± 54.8 0.265
Total cholesterol (mg/dL) 144.4± 31.3 140.4± 33.6 151.3± 36.8 144.9± 36.8 0.624
Triglycerides (mg/dL) 138.3± 69.5 136.8± 63.4 124.9± 77.6 146.2± 72.9 0.686
HDL-C (mg/dL) 48.9± 11.2 49.3± 12.9 48.6± 8.6 48.7± 10.8 0.978
LCL-C (mg/dL) 77.2± 26.5 74.1± 30.0 85.8± 28.7 76.0± 21.7 0.452
BUN (mg/dL) 16.3± 5.6 16.0± 4.6 16.6± 4.8 16.5± 6.8 0.949
Cr (mg/dL) 0.86± 0.22 0.85± 0.19 0.82± 0.24 0.89± 0.23 0.604
eGFR (mL/min) 87.2± 18.6 86.9± 16.8 91.8± 21.5 85.4± 19.1 0.622
BUN (mg/dL, 12 mo later) 17.1± 4.7 17.3± 5.1 18.3± 4.3 16.4± 4.4 0.424
Cr (mg/dL, 12 mo later) 0.82± 0.21 0.81± 0.18 0.81± 0.24 0.84± 0.22 0.763
eGFR (mL/min, 12 mo later) 89.5± 16.8 89.1± 14.0 93.3± 20.1 88.0± 18.0 0.747
Values are presented as mean± standard deviation or number (%).
*P< 0.05.
G, group; yr, year; DM, diabetes mellitus; BMI, body mass index; SBP, systolic blood pressure; DBP, diastolic blood pressure; HbA1c, glycated hemoglobin; PP2, post prandial plasma glucose 2 hours; HDL-C, high-density lipoprotein cholesterol; LDL-C, low-density lipoprotein cholesterol; BUN, blood urea nitrogen; Cr, creatinine; eGFR, estimated glomerular filtra- tion rate.
PP2, and FPG levels were -0.65± 0.71% (P=0.002), -37.9±61.4 mg/dL (P=0.001), and -24.8±42.4 (P=0.039), respectively (Ta- ble 2). There was an incremental increase of 2.4± 7.7 mg/dL in high density lipoprotein-cholesterol (HDL-C) level for the total patient sample (P=0.068); however, this increase was not statisti- cally significant (Table 3).
Effects of dapagliflozin on body weight and blood pressure
Table 2 shows mean changes between baseline and 12 months after therapy initiation for body weight (BWT), systolic blood pressure (SBP), and diastolic blood pressure (DBP). After 12 months, the mean change in BWT was -3.4± 2.6 kg (P<0.001) for the total sample, -3.4± 3.1 kg (P<0.001) for group 1, -2.7±2.0 kg (P=0.008) for group 2, and -4.0±2.3 kg (P<0.001) for group 3.
The mean change in SBP was -6.0± 14 mmHg (P=0.001) for the total sample, -6.0± 16 mmHg (P=0.146) for group 1, -6.6±17.9
mmHg (P=0.165) for group 2, and -5.1±10.0 mmHg (P=0.013) for group 3. The mean change in DBP was -3.4 ± 7.7 mmHg (P=0.002) for the total sample, -3.0±8.4 mmHg (P=0.109) for group 1, -5.8± 9.3 mmHg (P=0.064) for group 2, and -2.7±6.3 mmHg (P=0.092) for group 3.
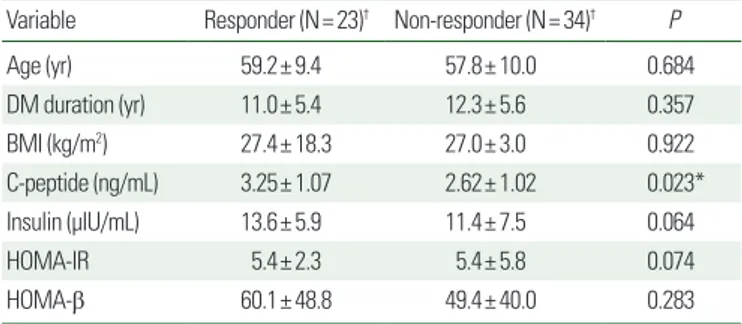
Predictive clinical parameters of body weight reduction in the dapagliflozin responder group
Patients who achieved a BWT reduction ≥ 5% were classified into the responder group, and those with< 5% body weight reduc- tion were classified into the non-responder group. We analyzed for influencing factors in the responder group and found that baseline fasting C-peptide level was higher in the responder group than in the non-responder group (3.25± 1.07 ng/mL vs. 2.62± 1.02 ng/
mL, P=0.023; Table 4). Baseline fasting C-peptide level was a sig- nificant clinical parameter in the dapagliflozin response group (Ta- ble 4). In the responder and non-responder groups, serum fasting
Table 2. Metabolic effects on body weight, blood pressure, and glycemic control after one year of dapagliflozin treatment
Group ΔBWT (kg) ΔSBP (mmHg) ΔDBP (mmHg) ΔHbA1c (%) ΔPP2 (mg/dL) ΔFPG (mg/dL)
Total -3.4± 2.6 -6.0± 14 -3.4± 7.7 -0.61± 0.82 -35.4± 62 -21.3± 56.2
Group 1+2+3 P< 0.001* P= 0.001* P= 0.002* P< 0.001* P< 0.001* P= 0.012*
Group 1 -3.4± 3.1 -6.0± 16 -3.0± 8.4 -0.39± 0.80 -19.2± 41.0 -16.0± 33.3
(Dual combination) P< 0.001* P= 0.146 P= 0.109 P= 0.093 P= 0.152 P= 0.088
Group 2 -2.7± 2.0 -6.6± 17.9 -5.8± 9.3 -0.93± 1.0 -63.1± 90.6 -22.4± 99.0
(Triple combination) P= 0.008* P= 0.165 P= 0.064 P= 0.018* P= 0.034* P= 0.790
Group 3 -4.0± 2.3 -5.1± 10.0 -2.7± 6.3 -0.65± 0.71 -37.9± 61.4 -24.8± 42.4
(Quadriple combination) P< 0.001* P= 0.013* P= 0.092 P= 0.002* P= 0.001* P= 0.039*
Values are presented as mean± standard deviation.
*P< 0.05.
Δ, difference between values before and after one year of treatment; BWT, body weight; SBP, systolic blood pressure; DBP, diastolic blood pressure; HbA1c, glycated hemoglobin;
PP2, post prandial plasma glucose 2 hours; FPG, fasting plasma glucose.
Table 3. Metabolic effects on lipid profiles after one year of dapagliflozin treatment
Group ΔTotal cholesterol (mg/dL) ΔTG (mg/dL) ΔHDL-C (mg/dL) ΔLCL-C (mg/dL) ΔNon-HDL-C (mg/dL)
Total 0.71± 27.2 -4.4± 56.5 2.4± 7.7 -2.4± 25.2 -1.7± 27.0
Group 1+2+3 P= 0.093 P= 0.200 P= 0.068 P= 0.366 P= 0.289
Group 1 -1.3± 32.1 -0.25± 57.9 5.0± 15.4 -4.4± 27.8 -10.5± 56.7
(Dual combination) P= 0.405 P= 0.541 P= 0.307 P= 0.541 P= 0.286
Group 2 -3.58± 24.9 -7.8± 65.8 3.5± 9.3 -10.4± 17.6 -7.1± 19.3
(Triple combination) P= 0.774 P= 0.146 P= 0.388 P= 0.388 P= 0.774
Group 3 -0.36± 25.3 -6.8± 52.5 1.64± 6.5 1.24± 24.0 -2.0± 26.2
(Quadriple combination) P= 0.424 P= 0.424 P= 0.405 P= 0.307 P= 0.678
Values are presented as mean± standard deviation.
Δ, difference in values before and after one year of treatment; TG, triglycerides; HDL-C, high-density lipoprotein cholesterol; LDL-C, low-density lipoprotein cholesterol.
insulin levels were 13.6± 5.9 µIU/mL and 11.4± 7.5 µIU/mL (P=
0.064), respectively. Homeostatic model assessment-insulin resis- tant (HOMA-IR) ([fasting insulin (µIU/mL)× fasting plasma glu- cose (mmol/L)]/22.5) levels were 5.4 ± 2.3 and 5.4 ± 5.8 (P=0.074), respectively, but these were not statistically significant (Table 4).
BWT reduction was evaluated according to initial BMI and HbA1c. After 12 months of treatment, the degree of body weight
Table 4. Predictive parameters of body weight reduction for responders and non- responders after dapagliflozin treatmentVariable Responder (N= 23)† Non-responder (N= 34)† P
Age (yr) 59.2± 9.4 57.8± 10.0 0.684
DM duration (yr) 11.0± 5.4 12.3± 5.6 0.357
BMI (kg/m2) 27.4± 18.3 27.0± 3.0 0.922
C-peptide (ng/mL) 3.25± 1.07 2.62± 1.02 0.023*
Insulin (μIU/mL) 13.6± 5.9 11.4± 7.5 0.064
HOMA-IR 5.4± 2.3 5.4± 5.8 0.074
HOMA-β 60.1± 48.8 49.4± 40.0 0.283
Values are presented as mean± standard deviation.
*P< 0.05.
†Responder is defined patients who achieved ≥ 5% body weight reduction. Non-re- sponder is classified those who achieved < 5% body weight reduction.
HOMA-IR, [FPI (μIU/ml)×FPG (mmol/L)]/22.5; HOMA-β, [20×FPI (μIU/ml)]/[FPG (mmol/
L)-3.5.
Yr, year; DM, diabetes mellitus; BMI, body mass index; HOMA-IR, homeostatic model assessment-insulin resistant; HOMA-β, homeostatic model assessment-beta cell func- tion; FPI, fasting plasma insulin; FPG, fasting plasma glucose.
Table 5. Changes in body weight value according to degree of HbA1c reduction
Change in HbA1c (%) ΔBWT (kg) P
ΔHbA1c ≤ -1.5 (n=10) -4.40± 2.31
0.070 -1.5 < ΔHbA1c ≤ -1.0 (n=10) -2.25± 1.59
-1.0 < ΔHbA1c ≤ -0.5 (n=11) -4.91± 2.33 -0.5 < ΔHbA1c ≤ 0 (n=16) -3.06± 2.14
0 < ΔHbA1c (n=14) -2.82± 3.65
Values are presented as mean ± standard deviation.
Δ, difference in values before and after one year of treatment; BWT, body weight;
HbA1c, glycated hemoglobin.
Table 6. Summary of treatment safety
Variable Total (n= 61)
Discontinuation due to adverse reaction 1
Orthostatic dizziness 3
Genitourinary track infection 2*
Abdominal pain and diarrhea 1
Headache 1
*bacterial prostatitis, bacterial vaginitis.
Figure 2. Change in body weight values according to baseline BMI and HbA1c levels. BMI, body mass index; HbA1c, glycated hemoglobin; BWT, body weight.
Baseline HbA1c (%)
ΔBWT (kg) P= 0.871
< 7 7≤ HbA1c< 8 8≤
-3.2
-3.3
-3.4
-3.5
-3.6
-3.7
Baseline BMI (kg/m2)
ΔBWT (kg)
P= 0.682
< 25 25≤ BMI< 27 27≤
0
-2
-4
-6