Incidence of Hypertension in Korea: 5-Year Follow-up Study
Limited data are available about the incidence of hypertension over the 5-yr in non- hypertensive subjects. The study subjects were 1,806 subjects enrolled in a rural area of Daegu, Korea for a cohort study from August to November 2003. Of them, 1,287 (71.3%) individuals had another examination 5 yr later. To estimate the incidence of hypertension, 730 non-hypertensive individuals (265 males; mean age = 56.6 ± 11.1 yr-old) at baseline examination were analyzed in this study. Hypertension was defined as either a new diagnosis of hypertension or self-reports of newly initiated antihypertensive treatment;
prehypertension was if the systolic blood pressure was 120-139 mmHg and/or diastolic blood pressure was 80-89 mmHg. During the 5-yr follow-up, 195 (26.7%) non-
hypertensive individuals developed incident hypertension. The age-adjusted 5-yr incidence rates of hypertension were 22.9% (95% confidence interval [CI] = 19.9-29.0) in overall subjects, 22.2% (95% CI = 17.2-27.2) in men, and 24.3% (95% CI = 20.4-28.2) in women. The incidence rates of hypertension significantly increased with age. In the multivariate analysis, prehypertension (Odds ratio [OR] 2.25; P < 0.001) and older age (OR 2.26; P = 0.010) were independent predictors for incident hypertension. In this rapidly aging society, population-based preventive approach to decrease blood pressure, particularly in subjects with prehypertension, is needed to reduce hypertension.
Key Words: Hypertension; Blood pressure; Incidence; Population Jang Hoon Lee1, Dong Heon Yang1,
Hun Sik Park1, Yongkeun Cho1, Jae Eun Jun1, Wee Hyun Park1, Byung Yeol Chun2, Ji-Yeon Shin2, Dong Hoon Shin3, Kyeong Soo Lee4, Kee-Sik Kim5, Kwon-Bae Kim6, Young Jo Kim7, Shung Chull Chae1, and the HYpertension-Diabetes Daegu Initiative Study Investigators
Departments of 1Internal Medicine and 2Preventive Medicine, Kyungpook National University School of Medicine, Daegu; 3Department of Preventive Medicine, Keimyung University School of Medicine, Daegu; 4Department of Preventive Medicine and Public Health, Yeungnam University College of Medicine, Daegu; 5Department of Internal Medicine, Daegu Catholic University Hospital, Daegu;
6Department of Internal Medicine, Keimyung University Dongsan Medical Center, Daegu;
7Department of Internal Medicine, Yeungnam University Hospital, Daegu, Korea
Received: 2 February 2011 Accepted: 29 August 2011 Address for Correspondence:
Shung Chull Chae, MD
Department of Internal Medicine, Kyungpook National University Hospital, Kyungpook National University School of Medicine, 130 Dongdeok-ro, Jung-gu, Daegu 700-721, Korea Tel: +82.53-420-5527, Fax: +82.53-426-2046 E-mail: [email protected]
This study was published as an abstract in the ESC congress 2010, Stockholm, Sweden.
This study was partially supported by grant of Daegu metropolitan city.
http://dx.doi.org/10.3346/jkms.2011.26.10.1286 • J Korean Med Sci 2011; 26: 1286-1292 Cardiovascular Disorders
INTRODUCTION
Hypertension is now a major public health problem that affects approximately one billion individuals worldwide (1). It is widely acknowledged that blood pressure and the prevalence of hyper- tension increases with age in adults living in western societies (2, 3). Therefore, as the population ages, the prevalence of hyper- tension will increase even more. Hypertension is a major risk factor for coronary heart disease, heart failure, cerebrovascular disease and chronic renal failure (4-6). The high incidences of these diseases and the high prevalence of hypertension in most developed and developing countries make it the single most im- portant cause of cardiovascular morbidity and mortality (7).
The prevalence of hypertension in various regions of the world
has been widely reported (8-10). However, much less is known about the incidence of newly developed hypertension than about its prevalence (11-13). Asians comprise the largest ethnic group in the world and the fastest growing minority ethnic group with- in the United States (US) (14, 15). The prevalence of hyperten- sion in most Asian groups is similar to that of non-Asians (10).
Although numerous cross-sectional studies and cohort studies have provided important information on hypertension preva- lence and incidence in various ethnic groups (8-13), only a few studies regarding the prevalence of hypertension have been con- ducted in Korea (16, 17). The previous studies were conducted more than 8 yr ago. Furthermore, previous studies were cross- sectional studies, and the incidence of hypertension was not ad- dressed. Accordingly, limited data is available about the inci-
dences of hypertension in Korea. Therefore, the purpose of this study is to estimate the incidence of hypertension over 5 yr in non-hypertensive Koreans from the HYpertension-Diabetes Daegu Initiative (HYDDI) study.
MATERIALS AND METHODS Study population
The HYDDI study is a community-based health survey conduct- ed from August to November 2003 in a rural area, Dalseong-gun, in Daegu, Korea. The target population of the present study was the residents aged 20 yr and older living in rural area covered by community health primary health care posts (the basic health- care unit in rural area) of the Dalseong-gun. According to the resident registration, 21,011 residents were eligible for screening.
Two to four villages from the area covered by each primary health care post were randomly selected, totaling 26 villages (n = 2,680).
Of the 2,680 candidate subjects, 1,806 subjects finally agreed to participate in this health survey including a complete medical history, anthropometric measurements, and the collection of fasting blood samples. All participants visited community health centers to take the examination. During the 5-yr follow-up, 518 subjects died or moved out from their previous residents and 1,287 (71.3%) individuals attended the 5-yr follow-up examina- tion. At baseline examination, 1,034 subjects (57%) did not have hypertension. Of these non-hypertensive subjects, 730 (70.6%) had the 5-yr follow-up examination and finally included in this analysis.
Questionnaires survey, measurement of anthropometric, and laboratory parameters
The structured questionnaires covered the personal demograph- ic data and medical history, and family history of chronic dis- eases. The frequency and duration of alcohol consumption and smoking habits, and the frequency of physical exercise were re- corded. Alcohol consumption was classified as either a drinker, ex-drinker, or a non-drinker from the self-administered ques- tionnaire. Smoking was classified as either current, ex- (not for at least 1 yr), or a non-smoker. Physical exercise was defined with the frequency of physical activity: none, 1-2 times per week, or 3 times or more per week. Anthropometric measurements includ- ing height, weight, waist circumferences, and hip circumferences were also measured by practitioners. Body weight was measured in light clothing, and height was measured in a standing posi- tion. Waist circumference was measured at the midpoint be- tween the lower rib margin and the iliac crest. Body mass index (BMI) was calculated as weight divided by height squared (kg/
m2). Blood sample was drawn in the state of at least 8 hr over- night fasting. The fasting plasma glucose and serum concentra- tion of total cholesterol, triglyceride, and high-density lipopro- tein cholesterol were measured by enzymatic methods using the
Dimension AR system (Dade Behring, Inc., Deerfield, IL, USA).
Definition of hypertension
Systolic and diastolic blood pressures were measured in the sit- ting position using a sphygmomanometer after a 5-min rest. Two blood pressure readings were averaged, and it was used for anal- yses. According to the Seventh Report of the Joint National Com- mittee on Prevention, Detection, Evaluation, and Treatment of High Blood Pressure (JNC VII) criteria, hypertension was defined as systolic blood pressure ≥ 140 mmHg and/or diastolic blood pressure ≥ 90 mmHg, or current use of antihypertensive medi- cation; prehypertension was if the systolic blood pressure was 120 to 139 mmHg and/or diastolic blood pressure was 80 to 89 mmHg; and normal was if the systolic blood pressure was < 120 mmHg and diastolic blood pressure was < 80 mmHg. Incident cases of hypertension were defined as either a new diagnosis or a self-report of a newly initiated antihypertensive treatment.
Statistical analyses
Data are expressed as the mean ± SD for continuous variables and as percentages for categorical variables. Comparisons be- tween the baseline variables were made with the Student’s t-test for continuous variables and the Pearson’s chi-square test for categorical variables. The incidence of hypertension (per 100 persons) was calculated as the number of subjects who devel- oped hypertension during the follow-up divided by the total num- ber of those at risk at the baseline. The age-adjusted incidence rates of hypertension for each of the blood pressure groups were determined via the direct adjustment standardization method.
National Census data in 2005 from the Korea National Statisti- cal Office was used to determine the standards for the Korean population. Logistic regression analysis was used to calculate the relative risk for prehypertension associated with the devel- opment of hypertension. For all analyses, a two-sided P < 0.05 was considered statistically significant. Statistical analysis was performed using SAS software, version 9.1.
Ethics statement
This study protocol was approved by the institutional review board of the Kyungpook National University Hospital (No. 74005- 1541). Written informed consent was obtained from all partici- pants.
RESULTS
According to JNC VII criteria, the crude prevalence of hyperten- sion in subjects (n = 1,804, excluding two with missing data) who provided blood pressure data was 42.7% (43.9% in men and 41.9%
in women) in 2003 (Table 1). The age-adjusted prevalence of hypertension was 28.0% (29.5% in men and 24.8% in women) in 2003. Baseline characteristics of 730 non-hypertensive subjects
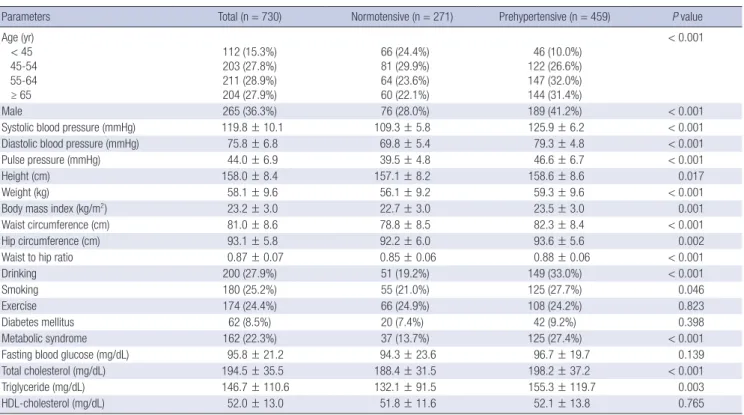
(265 males; mean age = 56.6 ± 11.1 yr-old) are shown in Table 2.
The prehypertension was present in 35.7% (n = 459). Prehyper- tensive individuals were older, more likely to be male, and had higher systolic and diastolic blood pressure, higher body mass index and waist to hip ratio, and higher total cholesterol and tri- glyceride levels.
Table 3 shows the changes in blood pressure category of sub- jects during the follow-up according to their baseline blood pres- sure category. During the 5-yr follow-up, 195 (26.7%) non-hyper- tensive subjects developed hypertension, including 45 (16.6%) of subjects with normal blood pressure and 150 (32.7%) of sub- jects with prehypertension. There was no significant difference in the incidence rate of hypertension by gender (23.0% in men and 28.8% in women, P = 0.089).
Progression to hypertension was determined on the basis of an increase in systolic blood pressure alone in 90 subjects (46.2%);
diastolic blood pressure alone in 33 (16.9%); both systolic and diastolic blood pressure in 35 (17.9%); and on the basis of start of antihypertensive agents in 37 (19.0%).
The crude 5-yr incidence of hypertension was 26.7% (95% con- fidence interval [CI], 23.5-30.1) in overall subjects, 23.0% (95% CI, 18.1-28.6) in men, and 28.8% (95% CI, 24.7-33.2) in women (Ta- ble 4). The age-adjusted 5-yr incidence of hypertension was 22.9% (95% CI, 19.9-29.0) in overall subjects, 22.2% (95% CI, 17.2-27.2) in men, and 24.3% (95% CI, 20.4-28.2) in women. The Table 1. Prevalence of hypertension according to baseline blood pressure categories
No. of persons
Prevalence of hypertension (95% CI)*
Age < 45 yr
(n = 252) Age 45-54 yr
(n = 373) Age 55-64 yr
(n = 524) Age ≥ 65 yr
(n = 655) Crude Age-adjusted†
Overall (n = 1,804) 15.5 (11.2-20.5) 29.8 (25.2-34.7) 46.0 (41.7-50.4) 57.9 (54.0-61.7) 42.7 (40.4-45.0) 28.0 (24.7-31.2) Men (n = 704) 21.9 (14.1-31.5) 32.4 (24.8-40.8) 46.3 (39.2-53.4) 56.2 (50.0-62.3) 43.9 (40.2-47.6) 29.5 (24.0-34.9) Women (n = 1,100) 11.5 (7.0-17.6) 28.1 (22.4-34.4) 45.8 (40.3-51.4) 59.0 (53.9-63.9) 41.9 (39.0-44.9) 24.8 (20.9-28.7)
*Rates are per 100 persons; †Age was adjusted using the direct standardization method based on the 2005 national census obtained from the Korea National Statistical Office.
Table 2. Baseline characteristics of study subjects
Parameters Total (n = 730) Normotensive (n = 271) Prehypertensive (n = 459) P value
Age (yr) < 45 45-54 55-64 ≥ 65
112 (15.3%) 203 (27.8%) 211 (28.9%) 204 (27.9%)
66 (24.4%) 81 (29.9%) 64 (23.6%) 60 (22.1%)
46 (10.0%) 122 (26.6%) 147 (32.0%) 144 (31.4%)
< 0.001
Male 265 (36.3%) 76 (28.0%) 189 (41.2%) < 0.001
Systolic blood pressure (mmHg) 119.8 ± 10.1 109.3 ± 5.8 125.9 ± 6.2 < 0.001
Diastolic blood pressure (mmHg) 75.8 ± 6.8 69.8 ± 5.4 79.3 ± 4.8 < 0.001
Pulse pressure (mmHg) 44.0 ± 6.9 39.5 ± 4.8 46.6 ± 6.7 < 0.001
Height (cm) 158.0 ± 8.4 157.1 ± 8.2 158.6 ± 8.6 0.017
Weight (kg) 58.1 ± 9.6 56.1 ± 9.2 59.3 ± 9.6 < 0.001
Body mass index (kg/m2) 23.2 ± 3.0 22.7 ± 3.0 23.5 ± 3.0 0.001
Waist circumference (cm) 81.0 ± 8.6 78.8 ± 8.5 82.3 ± 8.4 < 0.001
Hip circumference (cm) 93.1 ± 5.8 92.2 ± 6.0 93.6 ± 5.6 0.002
Waist to hip ratio 0.87 ± 0.07 0.85 ± 0.06 0.88 ± 0.06 < 0.001
Drinking 200 (27.9%) 51 (19.2%) 149 (33.0%) < 0.001
Smoking 180 (25.2%) 55 (21.0%) 125 (27.7%) 0.046
Exercise 174 (24.4%) 66 (24.9%) 108 (24.2%) 0.823
Diabetes mellitus 62 (8.5%) 20 (7.4%) 42 (9.2%) 0.398
Metabolic syndrome 162 (22.3%) 37 (13.7%) 125 (27.4%) < 0.001
Fasting blood glucose (mg/dL) 95.8 ± 21.2 94.3 ± 23.6 96.7 ± 19.7 0.139
Total cholesterol (mg/dL) 194.5 ± 35.5 188.4 ± 31.5 198.2 ± 37.2 < 0.001
Triglyceride (mg/dL) 146.7 ± 110.6 132.1 ± 91.5 155.3 ± 119.7 0.003
HDL-cholesterol (mg/dL) 52.0 ± 13.0 51.8 ± 11.6 52.1 ± 13.8 0.765
Data are mean ± SD for continuous variables and percentages for categorical variables. HDL, high-density lipoprotein.
Table 3. The changes in blood pressure category on follow-up according to baseline blood pressure category
No. of persons by BP at baseline
BP on follow-up
Normal Prehypertension Hypertension Overall (n = 730)
Normal (n = 271) Prehypertension (n = 459)
143 (52.8%) 102 (22.2%)
83 (30.6%) 207 (45.1%)
45 (16.6%) 150 (32.7%) Men (n = 265)
Normal (n = 76) Prehypertension (n = 189)
38 (50.0%) 44 (23.3%)
27 (35.5%) 95 (50.3%)
11 (14.5%) 50 (26.5%) Women (n = 465)
Normal (n = 195) Prehypertension (n = 270)
105 (53.8%) 58 (21.5%)
56 (28.7%) 112 (41.5%)
34 (17.4%) 100 (37.0%) BP, blood pressure.
incidence rates of hypertension significantly increased with age (17.9% in the age of < 45 yr, 19.7% in 45-54 yr, 27.5% in 55-64 yr, and 37.7% in 65 or more years; P for trend < 0.001). The crude 5-yr incidence rates of hypertension in normotensive subjects were 16.6% (14.5% in men and 17.4% in women). The age-ad- justed 5-yr incidence rates of hypertension in normotensive sub- jects were 14.7% (95% CI, 12.2-17.3) in overall subjects, 12.5%
(95% CI, 8.5-16.5) in men, and 16.1% (95% CI, 12.8-19.5) in wom- en. The crude 5-yr incidence rates of hypertension in prehyper- tensive subjects were 32.7% (26.5% in men and 37.0% in wom- en). The age-adjusted 5-yr incidence rates were 30.1% (95% CI, 26.8-33.4) in overall subjects, 26.4% (95% CI, 21.1-31.6) in men, and 32.2% (95% CI, 27.9-36.4) in women. The incidence rate of systolic hypertension significantly increased with age (P for trend < 0.05) (Fig. 1), whereas the incidence rate of diastolic hy- pertension significantly decreased with age (P for trend < 0.05) (Fig. 2).
In multivariate logistic regression analysis, prehypertension (Odds ratio [OR] 2.25; 95% CI, 1.48-3.42, P < 0.001) and older age (OR 2.26; 95% CI, 1.21-4.20, P = 0.010) were independent predictors for incident hypertension after adjustment for sex, BMI, waist circumference, drinking, current smoking, exercise, high triglyceride levels, low high density lipoprotein cholesterol levels, and the presence of diabetes mellitus (Table 5).
DISCUSSION
In this community-based health survey in rural area of Korea, the age-adjusted prevalence of hypertension was 28.0% (29.5%
in men and 24.8% in women) in 2003. The crude 5-yr incidence of hypertension was 26.7% (23.0% in men, and 28.8% in wom- en) and the incidence of hypertension increased with age. Pre- hypertensive individuals were twice as likely to develop hyper- tension as the normotensive individuals.
In our study, the age-adjusted prevalence of hypertension is higher than 19.8% of year 1990, but similar to 28.6% of the Ansan study (year 1999-2000) (16, 17). In previous reports, the preva- lence of hypertension tends to be higher in Western countries
Table 4. Five-year incidence rates of hypertension according to baseline blood pressure categories No. of persons by BP
at baseline
5-yr incidence rates of hypertension (95% CI)*
Age < 45 yr Age 45-54 yr Age 55-64 yr Age ≥ 65 yr Crude Age-adjusted†
Overall (n = 730) Normal (n = 271) Prehypertension (n = 459)
17.9 (11.3-26.2) 10.6 (4.4-20.6) 28.3 (16.0-43.5)
19.7 (14.5-25.9) 12.3 (6.1-21.5) 24.6 (17.2-33.2)
27.5 (21.6-34.0) 21.9 (12.5-34.0) 29.9 (22.7-38.0)
37.7 (31.1-44.8) 23.3 (13.4-36.0) 43.8 (35.5-52.2)
26.7 (23.5-30.1) 16.6 (12.4-21.6) 32.7 (28.4-37.2)
22.9 (19.9-29.0) 14.7 (12.2-17.3) 30.1 (26.8-33.4) Men (n = 265)
Normal (n = 76) Prehypertension (n = 189)
25.0 (11.5-43.4) 10.0 (0.3-44.5) 31.8 (13.9-54.9)
13.4 (6.3-24.0) 12.0 (2.5-31.2) 14.3 (5.4-28.5)
18.2 (10.3-28.6) 16.7 (3.6-41.4) 18.6 (9.7-30.9)
33.7 (24.0-44.5) 17.4 (5.0-38.8) 39.4 (27.6-52.2)
23.0 (18.1-28.6) 14.5 (7.5-24.4) 26.5 (20.3-33.3)
22.2 (17.2-27.2) 12.5 (8.5-16.5) 26.4 (21.1-31.6) Women (n = 465)
Normal (n = 195) Prehypertension (n = 270)
15.0 (8.0-24.7) 10.7 (4.0-21.9) 25.0 (9.8-46.7)
22.8 (16.0-30.8) 12.5 (5.2-24.1) 30.0 (20.3-41.3)
32.8 (25.0-41.5) 23.9 (12.6-38.8) 37.5 (27.4-48.5)
40.9 (31.8-50.4) 27.0 (13.8-44.1) 47.4 (36.0-59.1)
28.8 (24.7-33.2) 17.4 (12.4-23.5) 37.0 (31.3-43.1)
24.3 (20.4-28.2) 16.1 (12.8-19.5) 32.2 (27.9-36.4)
*Rates are per 100 persons; †Age was adjusted using the direct standardization method based on the 2005 national census obtained from the Korea National Statistical Office.
BP, blood pressure.
(%)
Years
< 45 (n = 110) 45-54 (n = 194) 55-64 (n = 199) ≥ 65 (n = 190) 50
40
30
20
10
0
6.4 6.5 6.3
Total (n = 693); P for trend < 0.05 Men (n = 253); P for trend < 0.05 Women (n = 440); P for trend < 0.05
9.8 7.610.9 18.6
8.3 24.4
32.6 28.6
35.8
A
(%)
Years
< 45 (n = 45) 45-54 (n = 116) 55-64 (n = 139) ≥ 65 (n = 131) 50
40
30
20
10
0
11.19.1 13.0
Total (n = 431); P for trend < 0.05 Men (n = 178); P for trend < 0.05 Women (n = 253); P for trend < 0.05
13.8 9.8
16.0 20.9
7.4 29.4
37.4 32.8
41.4
C
(%)
Years
< 45 (n = 65) 45-54 (n = 78) 55-64 (n = 60) ≥ 65 (n = 59) 50
40
30
20
10
0
3.1 0.0 3.6
Total (n = 262); P for trend < 0.05 Men (n = 75); P for trend = ns Women (n = 187); P for trend < 0.05
3.8 4.0 3.8
13.311.114.3 22.0
17.4 25.0
B
Fig. 1. Incidence of systolic hypertension by age and gender in overall (A), normoten- sive (B), and prehypertensive subjects (C).
than in Asian countries although different study populations and different methodologies among surveys regarding the num- ber of blood pressure measurements and the time interval be- tween measurements may have contributed to observed differ- ences (8-10). Over the past decade, the prevalence of hyperten- sion has remained stable or decreased in developed countries, whereas it has shown a tendency to increase in developing coun- tries (8). A significant downward trend in the prevalence of hy- pertension was observed in the US during 1960-1991 and Fin- land during 1982-1997 (18, 19). However, the third Chinese na- tional hypertension survey reported that the prevalence of hyper- tension increased by approximately 25% during 1980-1991 (20).
Furthermore, a recent study reported that there were no signifi-
cant cross-sectional differences between developed and devel- oping countries in hypertension indices (10). High economic development, changes in lifestyle and diet, and an increase in the prevalence of obesity, in part, may explain the rapid increase in the prevalence of hypertension in Korea. Another important factor is an increase in life expectancy in Korea over the past decade. According to the US International Population Reports, only 18 yr (2000-2018) will be required for percent of Korean pop- ulation aged 65 and over to rise from 7 percent (aging society) to 14 percent (aged society) (21).
Several previous epidemiological studies have evaluated the incidence rates of hypertension in the community (11-13). How- ever, information on the short-term rates of development of hy- pertension in non-hypertensive blood pressure categories is lim- ited. The Framingham heart study has provided information on short-term incidence of hypertension according to JNC VI and the World Health Organization-International Study of Hyper- tension blood pressure categories (13). Although the Framing- ham heart study has been regarded as a representative US cohort study, there are some differences in the study period, the time- frame for follow-up, and the age distribution of the sample com- pared with the present study. The incidence of hypertension in the Framingham cohort increased with age and that the extent of this age-related increase depends on the initial value of blood pressure. Over a follow-up of 4 yr, 1,907 (19%) of 9,845 partici- pants developed hypertension including 6% of subjects with op- timal blood pressure, 20% of those with normal blood pressure, and 43% of subjects with high normal blood pressure. Hyperten- sion incidence among participants in each of the three non-hy- pertensive categories increased with age. However, few studies have been conducted in Asia and cross-national comparisons of incidence rates of hypertension are still limited due to the dif- ferences in methodology. In a recent investigation, the crude 2-yr incidence of hypertension according to JNC VI criteria was 12.2%
Table 5. Multivariate logistic regression analysis for incident hypertension
Variables Odds ratio 95% confidence
interval P value
Age (yr) < 45 45-54 55-64 ≥ 65
1.0 0.89 1.32 2.26
1.0 0.47-1.69 0.71-2.47 1.21-4.20
0.730 0.378 0.010
Male 0.68 0.41-1.11 0.118
Prehypertension 2.25 1.48-3.42 < 0.001
Body mass index 1.08 0.99-1.17 0.094
Waist circumference 0.99 0.97-1.03 0.782
Drinking 1.30 0.83-2.02 0.249
Smoking 0.86 0.52-1.42 0.552
Exercise 1.32 0.88-1.98 0.183
High triglyceride 1.16 0.77-1.74 0.473
Low HDL cholesterol 1.17 0.77-1.78 0.472
Diabetes mellitus 1.72 0.92-3.20 0.089
HDL, high-density lipoprotein.
(%)
Years
< 45 (n = 110) 45-54 (n = 194) 55-64 (n = 199) ≥ 65 (n = 190) 40
30
20
10
0 14.5
22.6
11.4
Total (n = 693); P for trend < 0.05 Men (n = 253); P for trend < 0.05 Women (n = 440); P for trend = ns
10.810.610.9 10.6 4.2
14.2
5.3 7.1 3.8
A
(%)
Years
< 45 (n = 45) 45-54 (n = 116) 55-64 (n = 139) ≥ 65 (n = 131) 40
30
20
10
0 26.7
31.8
21.7
Total (n = 431); P for trend < 0.05 Men (n = 178); P for trend < 0.05 Women (n = 253); P for trend < 0.05
12.912.213.3 11.5 3.7
16.5
6.1 8.2 4.3
C
(%)
Years
< 45 (n = 65) 45-54 (n = 78) 55-64 (n = 60) ≥ 65 (n = 59) 40
30
20
10
0 6.2
0.0 7.1
Total (n = 262); P for trend = ns Men (n = 75); P for trend = ns Women (n = 187); P for trend = ns
7.7 8.0 7.5 8.3 5.6
9.5
3.4 4.3 2.8
B
Fig. 2. Incidence of diastolic hypertension by age and gender in overall (A), normo- tensive (B), and prehypertensive subjects (C).
(13.0% in men and 11.6% in women) in middle-aged Korean adults (22). Unfortunately, however, comparison of incidence rate of hypertension among these studies is difficult, since the age-adjusted incidence rate was not reported in the previous studies. In the present study, the crude 5-yr incidence of hyper- tension was 26.7% (23.0% in men and 28.8% in women). When the annual probability of a progression to hypertension was cal- culated based on the assumption of the constant risks, the rate in the present study was 5.3%, which was higher than that in the Framingham heart study (4.8%) but was lower than that in mid- dle-aged Korean adults (6.3%) (13, 22). Ratio of mortality from coronary heart disease in men aged 35-44 between Korea and the US has diminished substantially from 9 in 1985 to 2.4 in 1992 (23). The rapid increase in coronary heart disease mortality in Korea could be attributed, in part, to by the high incidence rates of hypertension.
In the present study, prehypertension in addition to old age (age > 65) were independent predictors for incident hyperten- sion, as has been reported previously (13, 22, 24, 25). One of the potential reasons for high incidence of hypertension in prehy- pertensive individuals is that risk factors for hypertension (such as baseline age, higher body mass index, and higher total cho- lesterol levels) were more common in prehypertensive individ- uals (26). These findings support the recommendation of the JNC VII for prehypertensive individuals, lifestyle modification and multiple risk factor reduction, for the Asian prehyperten- sive individuals as well.
This study has several potential limitations. The first limitation is the variation in the blood pressure measurements. The pres- ent study was based on measurements taken during a single day.
Incidence rates of hypertension among non-hypertensive indi- viduals in the community are likely to vary depending on the variance of blood pressure measurements. Previous studies re- ported that the incidence rates of hypertension could be differ- ent due to repeated measurements on several occasions, instead of a single day of reading (27, 28). Accordingly, multiple mea- surements obtained on two or more occasions have been rec- ommended for assessment of blood pressure status (1). How- ever, most epidemiological studies have adopted the standard- ized methodologies based on measurements during a single day.
Second, we were unable to exclude the possibility of selection bias. The loss to follow-up rate in this study exceeded 20%, a con- ventional standard beyond which the potential for bias increases if the pattern of missing subjects was not at random (29). Final- ly, the target population of the present study is confined to the residents in the rural area of Daegu City. As it is quite difficult to maintain a cohort in urban area, a rural area was selected for this cohort study. Therefore, our results could not be generalized.
In conclusion, this study provides the first information on the short-term incidence rates of hypertension according to JNC VII criteria from a cohort study of general population in a rural
area of Korea, which is a representative developing country in Asia. In this rapidly aging society, population-based preventive approach to decrease blood pressure, particularly in subjects with prehypertension, is needed to reduce hypertension.
The HYDDI Study Investigators:
Moon-Young An, MD, Ji-Yong Choi, MD, Sung-Woo Ha, MD, Nam-Soo Hong, MD, Seung-Ho Hur, MD, Jun-Hyun Hwang, MD, Tae-Yoon Hwang, MD, Soo-Hee Jin, PhD, Eui-Dal Jung, MD, Sin Kam, MD, Bo-Wan Kim, MD, Hye-Soon Kim, MD, Jong-Yeon Kim, MD, Jung-Guk Kim, MD, Keon-Yeop Kim, MD, Ki-Su Kim, MD, Duk-Hee Lee, MD, Hyoung Woo Lee, MD, In-Kyu Lee, MD, Jung-Jeung Lee, MD, Kyung-Eun Lee, PhD, Mi-Young Lee, MD, Sang-Hee Lee, MD, Bu-Dol Lim, MD, Ji-Seun Lim, MD, Chang- Wook Nam, MD, Keun-Gyu Park, MD, Sun-Kyun Park, MD, Jae Kean Ryu, MD, Dong-Gu Shin, MD, Ho-Sang Shon, MD, Hyo- Kyung Son, MD, Kyu Chang Won, MD, Jin-Hoon Yang, MD, Gyeong-Im Yu, PhD.
REFERENCES
1. Chobanian AV, Bakris GL, Black HR, Cushman WC, Green LA, Izzo JL Jr, Jones DW, Materson BJ, Oparil S, Wright JT Jr, Roccella EJ; National Heart, Lung, and Blood Institute Joint National Committee on Preven- tion, Detection, Evaluation, and Treatment of High Blood Pressure; Na- tional High Blood Pressure Education Program Coordinating Commit- tee. The seventh report of the joint national committee on prevention, de- tection, evaluation, and treatment of high blood pressure: the JNC 7 re- port. JAMA 2003; 289: 2560-72.
2. Rodriguez BL, Labarthe DR, Huang B, Lopez-Gomez J. Rise of blood pres- sure with age: new evidence of population differences. Hypertension 1994;
24: 779-85.
3. Burt VL, Whelton P, Roccella EJ, Brown C, Cutler JA, Higgins M, Horan MJ, Labarthe D. Prevalence of hypertension in the US adult population:
results from the third national health and nutrition examination survey, 1988-1991. Hypertension 1995; 25: 305-13.
4. D’Agostino RB Sr, Vasan RS, Pencina MJ, Wolf PA, Cobain M, Massaro JM, Kannel WB. General cardiovascular risk profile for use in primary care: the Framingham Heart Study. Circulation 2008; 117: 743-53.
5. Klag MJ, Whelton PK, Randall BL, Neaton JD, Brancati FL, Ford CE, Shulman NB, Stamler J. Blood pressure and end-stage renal disease in men. N Engl J Med 1996; 334: 13-8.
6. Stokes J 3rd, Kannel WB, Wolf PA, D’Agostino RB, Cupples LA. Blood pres- sure as a risk factor for cardiovascular disease. The Framingham Study:
30 years of follow-up. Hypertension 1989; 13(5 Suppl): I13-8.
7. Ezzati M, Lopez AD, Rodgers A, Vander Hoorn S, Murray CJ; Compara- tive Risk Assessment Collaborating Group. Selected major risk factors and global and regional burden of disease. Lancet 2002; 360: 1347-60.
8. Kearney PM, Whelton M, Reynolds K, Whelton PK, He J. Worldwide prev- alence of hypertension: a systematic review. J Hypertens 2004; 22: 11-9.
9. Kearney PM, Whelton M, Reynolds K, Muntner P, Whelton PK, He J.
Global burden of hypertension: analysis of worldwide data. Lancet 2005;
365: 217-23.
10. Pereira M, Lunet N, Azevedo A, Barros H. Differences in prevalence, aware- ness, treatment and control of hypertension between developing and de- veloped countries. J Hypertens 2009; 27: 963-75.
11. Cornoni-Huntley J, LaCroix AZ, Havlik RJ. Race and sex differentials in the impact of hypertension in the United States. The National Health and Nutrition Examination Survey I Epidemiologic Follow-up Study. Arch Intern Med 1989; 149: 780-8.
12. Kannel WB, Garrison RJ, Dannenberg AL. Secular blood pressure trends in normotensive persons: the Framingham Study. Am Heart J 1993; 125:
1154-8.
13. Vasan RS, Larson MG, Leip EP, Kannel WB, Levy D. Assessment of fre- quency of progression to hypertension in non-hypertensive participants in the Framingham Heart Study: a cohort study. Lancet 2001; 358: 1682-6.
14. Population Division of the Department of Economic and Social Affairs of the United Nations Secretariat. World population prospects: the 2008 revision. New York: UN Secretariat, 2009.
15. Le CN. “Population Statistics & Demographics” Asian-Nation: The Land- scape of Asian America. Available at http://www.asian-nation.org/pop- ulation.shtml [accessed 16 June, 2010].
16. Kim JS, Jones DW, Kim SJ, Hong YP. Hypertension in Korea: a national survey. Am J Prev Med 1994; 10: 200-4.
17. Jo I, Ahn Y, Lee J, Shin KR, Lee HK, Shin C. Prevalence, awareness, treat- ment, control and risk factors of hypertension in Korea: the Ansan study.
J Hypertens 2001; 19: 1523-32.
18. Burt VL, Cutler JA, Higgins M, Horan MJ, Labarthe D, Whelton P, Brown C, Roccella EJ. Trends in the prevalence, awareness, treatment, and con- trol of hypertension in the adult US population: data from the health ex- amination surveys, 1960 to 1991. Hypertension 1995; 26: 60-9.
19. Kastarinen MJ, Salomaa VV, Vartiainen EA, Jousilahti PJ, Tuomilehto JO, Puska PM, Nissinen AM. Trends in blood pressure levels and control of
hypertension in Finland from 1982 to 1997. J Hypertens 1998; 16: 1379-87.
20. Wu X, Duan X, Gu D, Hao J, Tao S, Fan D. Prevalence of hypertension and its trends in Chinese populations. Int J Cardiol 1995; 52: 39-44.
21. Kinsella K, He W. U.S. Census Bureau, International Population Reports, P95/09-1, An Aging World: 2008. Washington DC: U.S. Government Print- ing Office, 2009.
22. Kim J, Kim E, Yi H, Joo S, Shin K, Kim J, Kimm K, Shin C. Short-term in- cidence rate of hypertension in Korea middle-aged adults. J Hypertens 2006; 24: 2177-82.
23. Sekikawa A, Kuller LH, Ueshima H, Park JE, Suh I, Jee SH, Lee HK, Pan WH. Coronary heart disease mortality trends in men in the post World War II birth cohorts aged 35-44 in Japan, South Korea and Taiwan com- pared with the United States. Int J Epidemiol 1999; 28: 1044-9.
24. Hong KS. Prehypertension. Korean Circ J 2008; 38: 1-6.
25. Kim YM, Hong KS, Choi YH, Choi MG, Jeong JY, Lee JM, Kim DH. Rates and related factors of progression to hypertension among prehypertensive local residents aged 45 or over in Chuncheon City: Hallym Aging Study from a Community-Based Cross-Sectional Study. Korean Circ J 2008; 38:
43-50.
26. Natali A, Muscelli E, Casolaro A, Nilsson P, Melander O, Lalic N, Ferran- nini E, Petrie JR. Metabolic characteristics of prehypertension: role of clas- sification criteria and gender. J Hypertens 2009; 27: 2394-402.
27. Perry HM Jr, Miller JP. Difficulties in diagnosing hypertension: implica- tions and alternatives. J Hypertens 1992; 10: 887-96.
28. Weissfeld JL, Kuller LH. Methodologic evaluation of incidence rates for hypertension: calculated for Pittsburgh’s MRFIT usual care men. J Chron- ic Dis 1985; 38: 915-25.
29. Kristman V, Manno M, Côté P. Loss to follow-up in cohort studies: how much is too much? Eur J Epidemiol 2004; 19: 751-60.
AUTHOR SUMMARY
Incidence of Hypertension in Korea: 5-Year Follow-up Study
Jang Hoon Lee, Dong Heon Yang, Hun Sik Park, Yongkeun Cho, Jae Eun Jun, Wee Hyun Park, Byung Yeol Chun, Ji-Yeon Shin, Dong Hoon Shin, Kyeong Soo Lee, Kee-Sik Kim, Kwon-Bae Kim, Young Jo Kim, Shung Chull Chae, and the HYpertension-Diabetes Daegu Initiative Study Investigators
One thousand two hundreds eighty-seven Koreans in a rural area were examined twice with 5-yr interval. After the 5-yr follow- up, 195 (26.7%) of the 730 non-hypertensive individuals developed incident hypertension. The age-adjusted 5-yr incidence of hypertension were 22.9% (22.2% in men, 24.3% in women). The incidence of hypertension significantly increased with age. In the multivariate analysis, prehypertension and older agewere independent predictors for incident hypertension.