• 검색 결과가 없습니다.

Single Nucleotide Polymorphism Marker Discovery from Transcriptome Sequencing for Marker-assisted Backcrossing in Capsicum

N/A
N/A
Protected

Academic year: 2021

Share "Single Nucleotide Polymorphism Marker Discovery from Transcriptome Sequencing for Marker-assisted Backcrossing in Capsicum"

Copied!
9
0
0

로드 중.... (전체 텍스트 보기)

전체 글

(1)

Research Report

Single Nucleotide Polymorphism Marker Discovery from Transcriptome Sequencing for Marker-assisted Backcrossing in Capsicum

Jin-Ho Kang 1,2,3† , Hee-Bum Yang 1,2,3† , Hyeon-Seok Jeong 1,2,3 , Phillip Choe 1,2,3 , Jin-Kyung Kwon 1,2,3 , and Byoung-Cheorl Kang 1,2,3*

1

Department of Plant Science, Seoul National University, Seoul 151-921, Korea

2

Vegetable Breeding Research Center, Seoul National University, Seoul 151-921, Korea

3

Research Institute for Agriculture and Life Sciences, Seoul National University, Seoul 151-921, Korea

Abstract: Backcross breeding is the method most commonly used to introgress new traits into elite lines. Conventional backcross breeding requires at least 4-5 generations to recover the genomic background of the recurrent parent. Marker-assisted backcrossing (MABC) represents a new breeding approach that can substantially reduce breeding time and cost. For successful MABC, highly polymorphic markers with known positions in each chromosome are essential. Single nucleotide polymorphism (SNP) markers have many advantages over other marker systems for MABC due to their high abundance and amenability to genotyping automation.

To facilitate MABC in hot pepper (Capsicum annuum), we utilized expressed sequence tags (ESTs) to develop SNP markers in this study. For SNP identification, we used Bukang F
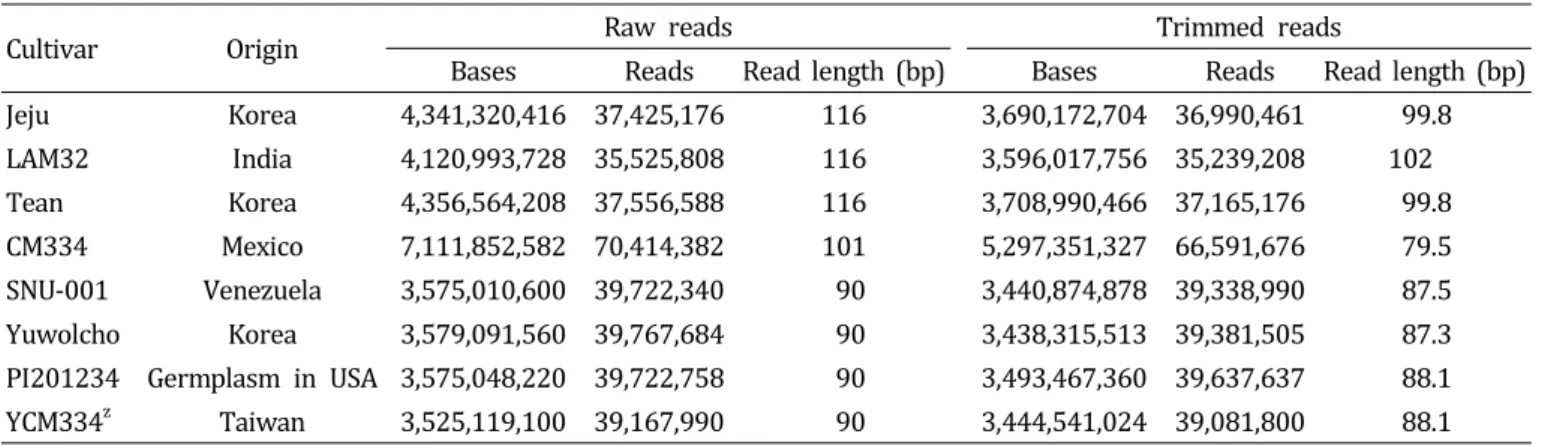
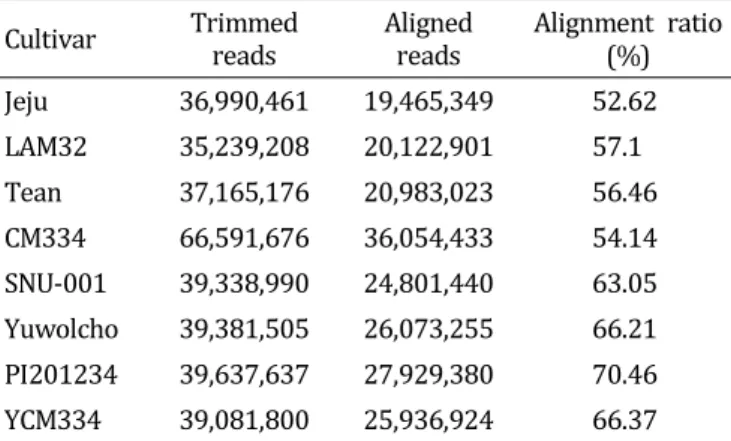
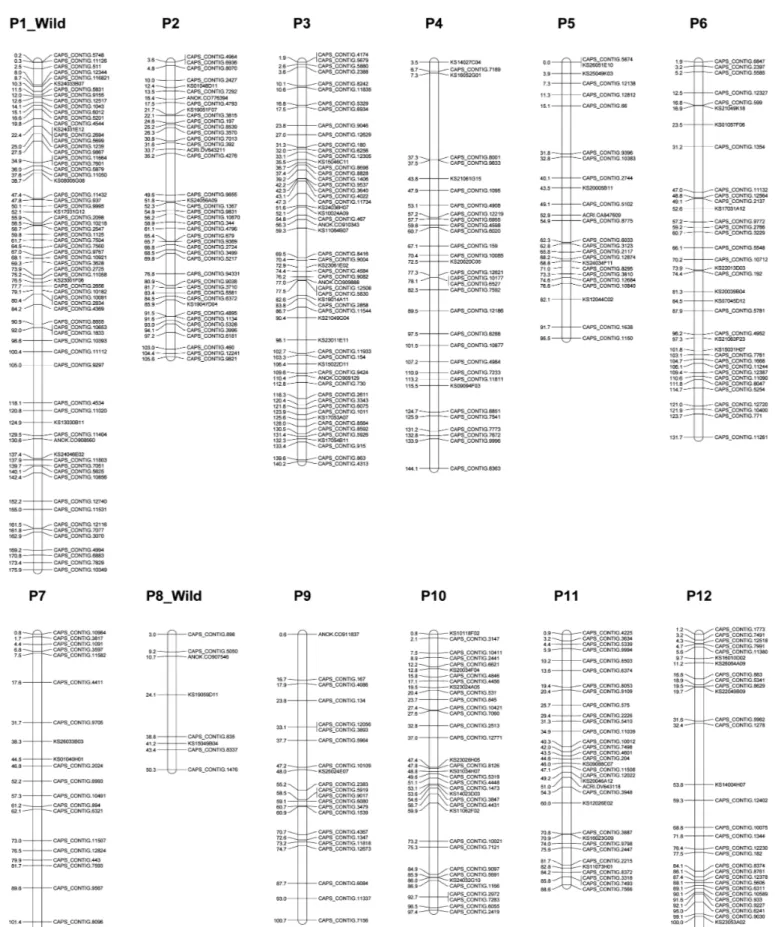
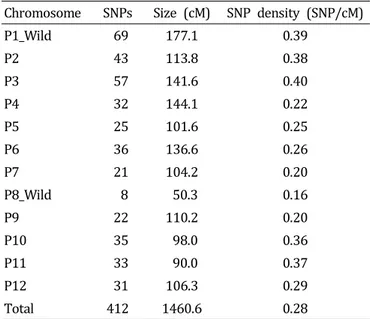
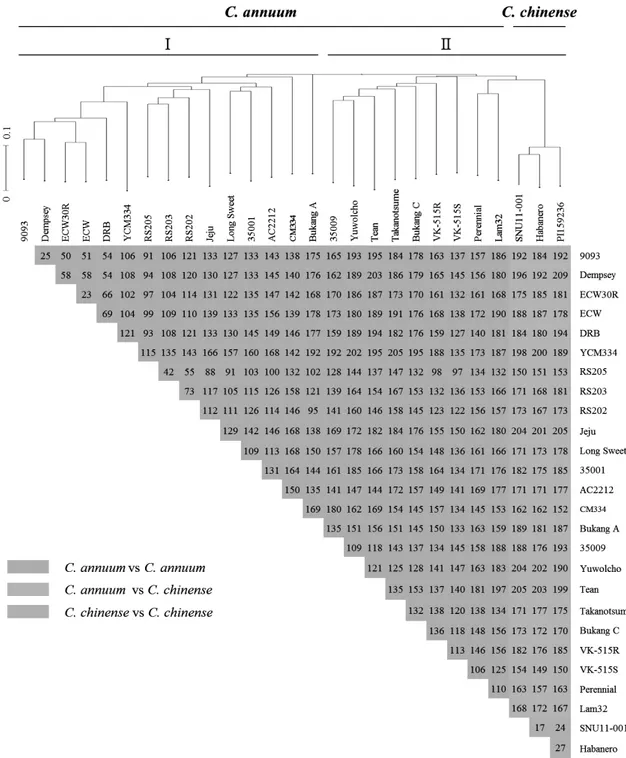
1

-hybrid pepper ESTs to prepare a reference sequence through de novo assembly. We performed large-scale transcriptome sequencing of eight accessions using the Illumina Genome Analyzer (IGA) IIx platform by Solexa, which generated small sequence fragments of about 90-100 bp. By aligning each contig to the reference sequence, 58,151 SNPs were identified. After filtering for polymorphism, segregation ratio, and lack of proximity to other SNPS or exon/intron boundaries, a total of 1,910 putative SNPs were chosen and positioned to a pepper linkage map. We further selected 412 SNPs evenly distributed on each chromosome and primers were designed for high throughput SNP assays and tested using a genetic diversity panel of 27 Capsicum accessions. The SNP markers clearly distinguished each accession. These results suggest that the SNP marker set developed in this study will be valuable for MABC, genetic mapping, and comparative genome analysis.

Additional key words: expressed sequence tag, linkage map, marker-assisted breeding

*Corresponding author: bk54@snu.ac.kr

These authors contributed equally to this work.

※ Received 17 June 2014; Revised 7 July 2014; Accepted 8 July 2014. This work was supported by a grant from the Next-GenerationBioGreen 21 Program [The Agricultural Genome Center (No. PJ009083) and Plant Molecular Breeding Center (No. PJ00906501201401)], Rural Development Administration, Republic of Korea. The online version of this article (doi:http://dx.doi.org/10.7235/hort.2014.14109) contains supplementary material, which is available to authorized users.

Ⓒ 2014 Korean Society for Horticultural Science

Introduction

Hot pepper (Capsicum annuum) is a crop of major economic importance that is commercially cultivated in China, Korea, the East Indies, and the United States of America, among many other countries (Shao et al., 2008). Worldwide production of hot peppers has been estimated to be 14-15 million tons a year (Weiss, 2002). In fact, hot pepper is the vegetable accounting for the largest planting area in

Korea.

In commercial breeding, new traits are commonly intro-

duced into elite breeding lines using conventional backcross

methods, which involve time consuming efforts to transfer

target genes into the genetic background of a recipient

parent. Recently marker-assisted backcrossing (MABC), which

is more efficient and faster than conventional backcrossing,

has been generally accepted as an advanced plant breeding

technique (Blum et al., 2002). For successful application

(2)

of MA BC, factors to consider include the number of target genes to be transferred, the genome size of the crop species, and the availability of a highly saturated map. Among those factors, the availability of highly polymorphic markers with known positions in each chromosome is critical (Varshney et al., 2009). Although molecular markers based on restriction fragment length polymorphism (RFLP), amplified fragment length polymorphism (AFLP), and random amplified poly- morphic DNA (RAPD) have been developed and used in practical plant breeding (Imelfort et al., 2009; Jung et al., 2010; Kang et al., 2001; Paran et al., 2004; Yoo et al., 2003), such markers still have limitations for use in MA BC due to the difficulty of finding polymorphisms among breeding lines and of high throughput genotyping. Recently, single nucleotide polymorphism (SNP) markers have captured attention because of their potential for high-throughput detection and computerization with automated platforms (Jung et al., 2010; Vignal et al., 2002; Yi et al., 2006).

SNPs are single-base differences in DNA between accessions.

In plants, SNPs generally occur in populations once every few hundred base pairs (Metzker, 2005). SNP markers can be developed through several methods. For example, SNPs can be identified by simply comparing a candidate sequence to a reference sequence (Nicolai et al., 2012), by whole genome sequencing (WGS; Goff et al., 2002; The Arabidopsis Genome Initiative, 2000), or by sequence alignment of expressed sequence tags (ESTs) to a reference sequence (Jones, 2009; Kota et al., 2001; Labate and Baldo, 2005).

For the crops like hot pepper, in which the genome is huge, ESTs have been adopted as an alternative to WGS and as a substrate for cDNA array-based expression analyses (Kim et al., 2008; Rudd, 2003). ESTs are a few hundred base pairs of sequence derived from randomly selected cDNA clones prepared from specific tissues, and EST sequencing is inexpensive compared to WGS. These characteristics led us to test whether SNP markers could be developed from several pepper accessions using ESTs generated with next generation sequencing (NGS) technology.

NGS is a fast and low cost method for the large-scale generation of reliable and robust transcript sequences and identifying and characterizing genetic polymorphisms in plants (Imelfort et al., 2009; Metzker, 2010). The Illumina Genome Analyzer (IGA) used to be the most widely used platform based on amplified sequencing features generated by bridge PCR (Shendure and Ji, 2008). Since the IGA reads only a short sequences (75-100 base pairs; Flicek and Birney, 2009), SNPs can be identified by either de novo assembly of short sequence reads or alignment to the reference. Several factors can interfere with correct sequence

alignment; these include missing calls of overlapping geno- types (Anney et al., 2008), false discovery of polymorphic SNPs (Pettersson et al., 2008), homozygote to heterozygote miscalls (Teo et al., 2007), and allelic dropout (Pompanon et al., 2005).

Here, we describe a process for SNP development from transcriptome sequencing of peppers. The resulting SNP primers clearly distinguished between 27 tested Capsicum cultivars, demonstrating that the SNP markers developed in this study will be useful resources to facilitate MABC in pepper.

Materials and Methods

Plant Material Preparation for Eight Accessions

Jeju (Capsicum annuum), LAM32 (C. annuum), Tean (C.

annuum), CM334 (C. annuum), SNU-001 (C. chinense), Yuwolcho (C. annuum), PI201234 (C. annuum) and YCM334 (C. annuum) were grown in a growth chamber with 12 h light at 25°C and 12 h dark at 18°C. Leaf tissues at the same stage from the eight accessions were collected.

Total RNA was isolated from leaves of each accession with Trizol extraction buffer (Ambion, Carlsbad, CA, USA) as described in the manufacturer’s protocol and used for sequencing of transcriptomes.

Sequencing of Transcriptomes for Eight Accessions

Jeju, LAM32 and Tean were sequenced via GAIIx sequencing with 116-bp single-end reads at the National Instrumentation Center for Environmental Management (NICEM). CM334 sequencing data of 101-bp paired-end reads were provided by Dr. Choi from the Plant Genomics Laboratory at Seoul National University. SNU-001, Yuwolcho, PI201234 and YCM334 were sequenced with the GAIIx sequencing platform using the 90-bp paired-end read sequencing method at Beijing Genome Institute (BGI).

Quality Trimming of Reads

The sequence data from each accession were trimmed to reduce the quality deterioration in the 3’-end and 5’-end regions, which negatively affects mapping and assembly.

Sickle version 1.0 (https://github.com/najoshi/sickle) was used for quality trimming.

Reference Sequence Preparation

The reference sequence, assembled by commercially

available CLC Genomics Workbench software, comprised

31,196 contigs from EST sequences that were mainly derived

(3)

Table 1. Sequencing information from eight pepper accessions.

Cultivar Origin Raw reads Trimmed reads

Bases Reads Read length (bp) Bases Reads Read length (bp)

Jeju Korea 4,341,320,416 37,425,176 116 3,690,172,704 36,990,461 99.8

LAM32 India 4,120,993,728 35,525,808 116 3,596,017,756 35,239,208 102

Tean Korea 4,356,564,208 37,556,588 116 3,708,990,466 37,165,176 99.8

CM334 Mexico 7,111,852,582 70,414,382 101 5,297,351,327 66,591,676 79.5

SNU-001 Venezuela 3,575,010,600 39,722,340 90 3,440,874,878 39,338,990 87.5

Yuwolcho Korea 3,579,091,560 39,767,684 90 3,438,315,513 39,381,505 87.3

PI201234 Germplasm in USA 3,575,048,220 39,722,758 90 3,493,467,360 39,637,637 88.1

YCM334 z Taiwan 3,525,119,100 39,167,990 90 3,444,541,024 39,081,800 88.1

z RIL line derived from a cross between Yolo wonder and CM334 in INRA (France).

from Korean F1 hybrid line Bukang, for which data are available at the Korea Research Institute of Bioscience &

Biotechnology (KRIBB) (Ashrafi et al., 2012; Kim et al., 2008).

Repeat Masking on the Reference Sequence

Repeat masking was performed on the reference sequence using the 727 repeat sequence library set up by the Plant Genomics Laboratory at Seoul National University because of the presence in Capsicum of areas highly abundant in repeat sequence (Yi et al., 2006). The data were collected by the RMBlast program, which is mainly used in NCBI for finding matches between two sequences and attempting to start alignments from these matched places (Johnson et al., 2008). RepeatMasker from the Institute for Systems Biology was used to screen DNA sequences for repeats and areas of low complexity.

Alignment to the Reference Sequence

Sequence alignments to the reference sequence were performed to find SNPs (McPherson, 2009) using the Burrows-Wheeler Transform algorithm from Burrows- Wheeler Aligner version 0.5.9rc1, which requires little memory and so is suitable for reducing the analysis time (Li and Durbin, 2009).

SNP Calling and Filtering

SNP data were collected using SAMtools software and an in-house python script with strict criteria (Li et al., 2009). SNPs from sequencing depth of 25x were filtered in the following order: 1) diallelic SNPs, 2) SNPs found in more than six accessions, 3) SNPs with high PIC value, 4) SNPs for Fluidigm probe design (at least 60 bp from

any intron-exon junction or another SNP).

Linkage Mapping

A genetic map was drawn by connecting candidate SNPs after the filtering process to a hybrid of Capsicum frutescens cv. BG2814-6 x Capsicum annuum cv. NuMexRNaky RIL population (119 RILs) built at the University of California, Davis (https://pepchip.genomecenter.ucdavis.edu/).

Polymorphism Survey and Genetic Diversity

SNPs positioned in the linkage map were used to design locus-specific markers for the Fluidigm ® EP1 TM genotyping system. To validate their polymorphism and study the application of the SNP markers, 24 different C. annuum accessionss (CM334, YCM334, Tean, Yuwolcho, ECW, Bukang A line, Bukang C line, Lam32, Jeju, Dempsey, DRB, Perennial, 9093, ECW30R, Takanotsume, 35001, 35009, RS202, RS203, RS205, VK-515R, VK515S, LongSweet, AC2212) and three different C. chinense accessions (PI159236, Habanero, SNU11- 001) were employed. Genomic DNA s of each accessions were extracted by the hexadecyl trimethyl ammonium bromide (CTAB) method from young leaf tissues (Yang et al., 2012). Phylogenetic analysis was carried out using the neighbor-joining method in Darwin5 software (http://

darwin.cirad.fr/darwin, Perrier et al., 2003). Tree construction was based on the unweighted neighbor-joining method, and bootstraps were determined from 1000 replicates.

Results

Sequencing of Eight Hot Pepper Accessions and Quality Trimming

We produced a total of 4.1-4.4 Gb with 36-38 million

(4)

Table 2. Results of alignment of each accession to the reference sequence.

Cultivar Trimmed

reads Aligned

reads Alignment ratio (%)

Jeju 36,990,461 19,465,349 52.62

LAM32 35,239,208 20,122,901 57.1

Tean 37,165,176 20,983,023 56.46

CM334 66,591,676 36,054,433 54.14

SNU-001 39,338,990 24,801,440 63.05

Yuwolcho 39,381,505 26,073,255 66.21 PI201234 39,637,637 27,929,380 70.46

YCM334 39,081,800 25,936,924 66.37

Table 3. SNP filtering process.

Filtering criteria No. of SNPs remaining No. of filtered SNPs Filtering percentage (%) Depth filtering (> 25 X) 58,151

Genotype/allele 57,502 649 1.11

No. of distinguishable accessions 33,315 24,187 42.06

Segregation ratio 4,508 28,807 86.46

Adjacent SNP 1,910 2,598 57.63

Filtering percentage = (No. of SNPs removed by filterNo. of SNPs tested) × 100.

reads from Jeju, LA M32 and Tean; a total of 7.1 Gb with 70 million reads from CM334; and a total of 3.5-3.6 Gb with 39-40 million reads from SNU-001, Yuwolcho, PI201234, and YCM334 (Table 1). After quality trimming with Sickle version 1.0, the collected data were reduced to 3.6-3.7 Gb with 35-37 million reads of 100-102 bp read length for Jeju, Tean, and LAM32; 5.3 Gb with 67 million reads averaging 79.5 bp for CM334; and 3.4-3.5 Gb with 39-40 million reads averaging 87-88 bp for SNU-001, Yuwolcho, PI201234, and YCM334 (Table 1).

Alignment of Each Accession to the Reference Sequence The total acquired reference sequence of 21,665 kb was de novo assembled from 31,196 contigs derived from Bukang ESTs, with an average contig length of 696 bp.

There was a total of 1,071 kb of interspersed repeat elements (5,216 elements). Unclassified repeats accounted for 626 kb of this. Of the remaining repeat sequence, the largest portion (278 kb) was annotated as long terminal repeats (LTR), which are composed of several hundred base pairs. Long interspersed nuclear elements (LINEs), which encode a reverse transcriptase (RT) and other proteins, accounted for 118 kb. In addition, there was 49 kb of DNA

transposable elements, which tend to have short inverted repeats at each end. In addition to these interspersed repeat elements, 102 kb and 103 kb were marked as simple repeat and low complexity regions, respectively. Therefore, a total of 1,276 kb (5.9%) was masked as repeat sequences.

The trimmed reads of eight accessions (Table 1) were aligned to the reference sequence and the range of alignment ratio between each accession and the reference was 52.6- 70.5% (Table 2).

SNP Discovery and SNP Filtering

Sequences with read depth over 25x were used for SNP discovery, and those that were obviously distinguishable and different among accessions were defined as SNPs. Based on these criteria, a total of 58,151 SNPs were identified.

From these, SNPs with only two types of genotypes and two alleles were filtered out. Among the remaining 57,502 SNPs, 33,315 were recognized as distinguishable in at least six different accessions (Table 3). In the next step, SNPs that showed a uniform segregation ratio were chosen.

Among the 33,315 SNPs tested, 4,508 segregated 4:4 or 3:5 in the eight accessions. Finally, from those 4,508 SNPs, 1,910 were selected based on not having any other SNPs within 60 bp in either direction (Table 3).

Development and Validation of SNP Markers

Among 1,910 SNPs, a total of 1,282 were positioned

on the hot pepper map produced by UC Davis. From these,

we further selected 412 SNPs that showed clear and

repeatable polymorphism, and that were evenly distributed

over a ~3-cM interval in each chromosome (Supplementary

Table 1). The linkage map showing the location of the

412 SNPs is presented in Fig. 1 and the SNP number per

chromosome is given in Table 4. The entire length of the

genetic map was 1,460.6 cM. There was an average of

34 SNPs in each linkage group, with the P1_Wild (177.1

cM) linkage group including the most SNPs. The P3 linkage

group had the highest density (0.40 SNP/cM). The fewest

(5)

Fig. 1. Location of 412 SNP markers on pepper linkage map.

(6)

Table 4. The number of SNPs and density in each pepper linkage group.

Chromosome SNPs Size (cM) SNP density (SNP/cM)

P1_Wild 69 177.1 0.39

P2 43 113.8 0.38

P3 57 141.6 0.40

P4 32 144.1 0.22

P5 25 101.6 0.25

P6 36 136.6 0.26

P7 21 104.2 0.20

P8_Wild 8 50.3 0.16

P9 22 110.2 0.20

P10 35 98.0 0.36

P11 33 90.0 0.37

P12 31 106.3 0.29

Total 412 1460.6 0.28

SNPs mapped to linkage group P8_Wild. The number of SNPs per cM ranged from 0.16 to 0.40, with an average of 0.28 SNPs per cM. Accordingly, there an average of 1 SNP per 3.55-cM interval in the genetic map (Table 4 and Fig. 1).

To validate the 412 SNP markers, 24 C. annuum and 3 C. chinense accessions (Supplementary Table 2) were tested for diversity of pepper genotypes (Fig. 2). Between C.

annuum accessions, the average number of SNPs was 143, ranging from 23 (ECW vs. ECW30R) to 205 (Takanotsume vs. YCM334). By contrast, between bell-type accessions of C. annuum (9003, Dempsey, ECW30R, ECW), the average number of SNPs was 51, ranging from 23 (ECW vs. ECW30R) to 69 (DRB vs. ECW). C. chinense accessions showed an average of 23 SNPs, ranging from 17 (Habanero vs. SNU11- 001) to 27 (Habanero vs. PI159236). The SNP number between C. annuum and C. chinense accessions averaged 179, ranging from 149 (VK-515S vs Habanero) to 209 (Dempsey vs PI159236). Overall, the average SNP number between all Capsicum accessions was 150, ranging from 17 (Habanero vs SNU11-001) to 209 (Dempsey vs PI159236).

Based on the genetic similarity results, a cluster dendrogram placed the 27 pepper accessions into two main clusters and clearly differentiated each accession (Fig. 2). The first main cluster (I) comprised 15 different C. annuum accessions (9093, Dempsey, ECW30R, ECW, DRB, YCM334, RS205, RS203, RS202, Jeju, LongSweet, 35001, AC2212, CM334, Bukang A ). The second cluster (II) consisted of 12 different accessions including seven C. annuum accessions (35009,

Yuwolcho, Tean, Takanotsume, Bukang C, VK-515R, and VK515S), two wild species of C. annuum accessions (Perennial and Lam 32) and three C. chinenese accessions (PI159236, Habanero, and SNU11-001).

Discussion

Various approaches have been used to find SNPs in hot pepper, such as targeting sequences using COSII markers (Jung et al., 2010) or PCR using primers based on BA C sequences (Yang et al., 2009). Recently, ESTs have been widely used to find SNPs in crop varieties including tomato and barley because of their abundance and easy accessibility to the data (Kota et al., 2001; Labate and Baldo, 2005).

The present work demonstrates that EST-derived SNP discovery using NGS is advantageous in hot pepper as well.

We prepared the reference sequence from Bukang ESTs using an approach similar to that described by Nicoli et al. (2012). However, we employed different SNP filtering methods to find valuable SNPs more effectively. By preparing a lengthy reference sequence after de novo assembly, we generated an alternative to WGS for reference sequence alignment to identify SNPs. Repeat areas are distributed throughout the genome in hot pepper. Therefore when preparing a reference sequence, repeat masking should be performed to find more accurate SNPs. In NGS for Jeju, LAM32, and Tean, parts of some reads contained low quality data and quality trimming resulted in small reductions in bases but not read number. However, for CM334, there was large amount of reduction due to low quality in both bases and reads. The sequences of SNU-001, Yuwolcho, PI201234, and YCM334 were high quality and did not show no much difference before and after trimming. Most accessions aligned to the reference with 50-70% of reads alignment.

The variations might be due to the different genetic relation- ships between the accessions and the reference.

Overall, we identified many SNPs by aligning NGS sequence to the reference. However, the SNPs were not all equally valuable. Several factors can lead to false SNP findings, including base calling errors from NGS (Nielsen et al., 2011), miss-calls including overlapping genotypes (Anney et al., 2008), and false discovery of polymorphic SNPs that are actually monomorphic (Pettersson et al., 2008). To address this, we performed quality filtering of the SNPs. Our in-house SNP filtering process significantly decreased the SNP numbers:

starting from 58,151 SNPs, the SNPs were filtered down

to 1,910. After positioning the SNPs on the genetic linkage

map, developing and testing SNP markers using the Fluidigm ®

EP1 TM genotyping system, 412 SNP markers were finally

(7)

Fig. 2. Polymorphism survey of the 412 SNP markers in 27 Capsicum cultivars and cluster dendrogram. SNP numbers are indicated for the comparisons between the Capsicum accessions indicated on the horizontal and vertical axes. Blue: SNP number for comparison between C. annuum accessions, red: SNP number for comparison between C. annuum and C. chinense, green:

SNP number for comparison between C. chinense accessions.

selected and validated using 27 Capsicum accessions.

For MABC, background selection focuses on both reduction of donor segments around target genes and recurrent parent genome recovery. Successful MABC depends on genome

size, population size, marker density in the map and the

use of high throughput marker systems. Recently, Herzog

and Frisch (2013) conducted computer simulations of MABC

in genetic models of sugar beet, rye, sunflower and rapeseed,

(8)

using the 10% quantile (Q10) value, the arithmetic mean and the standard deviation of the probability distribution of the proportion of recipient genome in the entire genome of selected individuals (as a percentage), for determining every backcross generation to measure recurrent parent genome recovery. Based on their data, the optimum designs, which minimize the required number of marker data points for target Q10 values of 96-99% in generation BC 2 or BC 3

in the model plants, employed marker densities of 2-20 cM intervals between markers and a population size of 50-100. In this study, the entire length of the genetic map covered by the SNP markers was 1,460.6 cM, suggesting that 73-730 markers (for 2-20 cM intervals) are needed for MABC in pepper. Our marker set produced an average of 150 SNPs between 27 accessions (corresponding to ~10 cM intervals), implying that our newly developed SNP markers should be useful for MABC between 27 accessions.

SNP numbers between C. annuum and C. chinense were much higher than those between accessions from the same species such as bell types of C. annuum and C. chinense.

This result implies that MA BC could be more difficult in closely-related accessions than in distant accessionss. Despite this, our new SNP markers clearly distinguished 27 Capsicum accessions.

Among the accessions tested, AC2212 was positioned in the C. annuum cluster, rather than in the C. chinense cluster. AC2212 was originally classified as C. chinense based on agronomic information from the Centre for Genetic Resources, the Netherlands (http://applicaties.

wageningenur.nl/applications/cgngenis/; Wahyuni et al., 2011). However, Wahyuni et al. (2013) reported out that AC2212 likely belongs to C. annuum instead of C. chinense, based on AFLP marker analysis. This result thus indicates that our newly developed SNP markers are accurate and can be used for the identification of diverse Capsicum accessions.

In conclusion, our SNP markers derived from transcriptome sequences will be valuable tools for MABC. In addition, the markers can be used for genetic mapping, comparative mapping and genetic diversity analyses in pepper and related species.

Literature Cited

Anney, R.J., E. Kenny, C.T. O'Dushlaine, and J. Lasky-Su. 2008.

Non-random error in genotype calling procedures: implications for family-based and case-control genome-wide association studies. Am. J. Med. Genet. B. 147B:1379-1386.

Ashrafi, H., T. Hill, K. Stoffel, A. Kozik, J. Yao, S.R. Chin-Wo,

and A. Van Deynze. 2012. De novo assembly of the pepper transcriptome (Capsicum annuum): A benchmark for in silico discovery of SNPs, SSRs and candidate genes. BMC Genomics 13:571.

Blum, E., K. Liu, M. Mazourek, E.Y. Yoo, M. Jahn, and I. Paran.

2002. Molecular mapping of the C locus for presence of pungency in Capsicum. Genome 45:702-705.

Flicek, P. and E. Birney. 2009. Sense from sequence reads:

Methods for alignment and assembly. Nat. Methods 6:S6-S12.

Goff, S.A., D. Ricke, T.H. Lan, G. Presting, R. Wang, M. Dunn, J. Glazebrook, A. Sessions, P. Oeller, H. Varma, D. Hadley, D.

Hutchison, C. Martin, F. Katagiri, B.M. Lange, T. Moughamer, Y. Xia, P. Budworth, J. Zhong, T. Miguel, U. Paszkowski, S. Zhang, M. Colbert, W.L. Sun, L. Chen, B. Cooper, S. Park, T.C. Wood, L. Mao, P. Quail, R. Wing, R. Dean, Y. Yu, A.

Zharkikh, R. Shen, S. Sahasrabudhe, A. Thomas, R. Cannings, A. Gutin, D. Pruss, J. Reid, S. Tavtigian, J. Mitchell, G.

Eldredge, T. Scholl, R.M. Miller, S. Bhatnagar, N. Adey, T.

Rubano, N. Tusneem, R. Robinson, J. Feldhaus, T. Macalma, A. Oliphant, and S. Briggs. 2002. A draft sequence of the rice genome (Oryza sativa L. ssp. japonica). Science 296:92-100.

Herzog, E. and M. Frisch. 2013. Efficient marker-assisted backcross conversion of seed-parent lines to cytoplasmic male sterility.

Plant Breed. 132:33-41.

Imelfort, M., C. Duran, J. Batley, and D. Edwards. 2009. Discovering genetic polymorphisms in next-generation sequencing data.

Plant Biotechnol. J. 7:312-317.

Johnson, M., I. Zaretskaya, Y. Raytselis, Y. Merezhuk, S. McGinnis, and T.L. Madden. 2008. NCBIBLAST: A better web interface.

Nucleic Acid Res. 36:W5-W9.

Jones, E., W.-C. Chu, M. Ayele, J. Ho, Ed Bruggeman, K. Yourstone, A. Rafalski, O.S. Smith, M.D. McMullen, C. Bezawada, J.

Warren, J. Babayev, S. Basu, and S. Smith. 2009. Development of single nucleotide polymorphism (SNP) markers for use in commercial maize (Zea mays L.) germplasm. Mol. Breed.

24:165-176.

Jung, J.K., S.W. Park, W.Y. Liu, and B.C. Kang. 2010. Discovery of single nucleotide polymorphism in Capsicum and SNP markers for cultivar identification. Euphytica 175:91-107.

Kang, B.C., S.H. Nahm, J.H. Huh, H.S. Yoo, J.W. Yu, M.H. Lee, and B.D. Kim. 2001. An interspecific (Capsicum annuum x C. chinese) F

2

linkage map in pepper using RFLP and AFLP markers. Theor. Appl. Genet. 102:531-539.

Kim, H.J., K.H. Baek, S.W. Lee, J. Kim, B.W. Lee, H.S. Cho, W.T. Kim, D. Choi, and C.G. Hur. 2008. Pepper EST database:

comprehensive in silico tool for analyzing the chili pepper (Capsicum annuum) transcriptome. BMC Plant Biol. 8:101.

Kota, R., R.K. Varshney, T. Thiel, K.J. Dehmer, and A. Graner.

2001. Generation and comparison of EST-derived SSRs and SNPs in barley (Hordeurn vulgare L.). Hereditas 135:145-151.

Labate, J.A. and A.M. Baldo. 2005. Tomato SNP discovery by

EST mining and resequencing. Mol. Breed. 16:343-349.

(9)

Lee, M.J., B.M. Popkin, and S. Kim. 2002. The unique aspects of the nutrition transition in South Korea: The retention of healthful elements in their traditional diet. Public Health Nutr.

5:197-203.

Li, H. and R. Durbin. 2009. Fast and accurate short read alignment with Burrows-Wheeler transform. Bioinformatics 25:1754-1760.

Li, H., B. Handsaker, A. Wysoker, T. Fennell, J. Ruan, N. Homer, G. Marth, G. Abecasis, R. Durbin, and 1000 Genome Project Data Processing Subgroup. 2009. The sequence alignment/map format and SAMtools. Bioinformatics 25:2078-2079.

McPherson, J.D. 2009. Next-generation gap. Nat. Methods 6:S2-S5.

Metzker, M.L. 2005. Emerging technologies in DNA sequencing.

Genome Res. 15:1767-1776.

Metzker, M.L. 2010. Sequencing technologies - The next generation.

Genetics 11:31-46.

Nicolai, M., C. Pisani, J.P. Bouchet, M. Vuylsteke, and A. Palloix.

2012. Discovery of a large set of SNP and SSR genetic markers by high-throughput sequencing of pepper (Capsicum annuum).

Genet. Mol. Res. 11:2295-2300.

Nielsen, R., J.S. Paul, A. Albrechtsen, and Y.S. Song. 2011.

Genotype and SNP calling from next-generation sequencing data. Nat. Rev. Genet. 12:443-451.

Paran, I., J.R. van der Voort, V. Lefebvre, M. Jahn, L. Landry, M. van Schriek, B. Tanyolac, C. Caranta, A.B. Chaim, K.

Livingstone, A. Palloix, and J. Peleman. 2004. An integrated genetic linkage map of pepper (Capsicum spp.). Mol. Breed.

13:251-261.

Perrier, X., A. Flori, and F. Bonnot. 2003. Data analysis methods, p. 43-46. In: P. Hamon, M. Seguin, X. Perrier, and J.C. Glaszmann.

(eds.). Genetic diversity of cultivated tropical plants. Gifield Science Publishers, Montpellier.

Pettersson, F., A.P. Morris, M.R. Barnes, and L.R. Cardon. 2008.

Goldsurfer2 (Gs2): A comprehensive tool for the analysis and visualization of genome wide association studies. BMC Bioinformatics 9:138.

Pompanon, F., A. Bonin, E. Bellemain, and P. Taberlet. 2005.

Genotyping errors: Causes. Consequences and solutions. Nat.

Rev. Genet. 6:847-859.

Rudd, S. 2003. Expressed sequence tags: alternative or complement to whole genome sequences? Trends Plant Sci. 8:321-329.

Shao, G.C., Z.Y. Zhang, N. Liu, S.E. Yu, and W.G. Xing. 2008.

Comparative effects of deficit irrigation (DI) and partial rootzone drying (PRD) on soil water distribution, water use, growth and yield in greenhouse grown hot pepper. Sci. Hortic. 119:11-16.

Shendure, J. and H.L. Ji. 2008. Next-generation DNA sequencing.

Nat. Biotechnol. 26:1135-1145.

Teo, Y.Y., A.E. Fry, T.G. Clark, E.S. Tai, and M. Seielstad. 2007.

Data sheet: Sentrix HumanHap550 genotyping BeadChip. Ann.

Hum. Genet. 71:701-703.

The Arabidopsis Genome Initiative. 2000. Analysis of the genome sequence of the flowering plant Arabidopsis thaliana. Nature 408:796-815.

Varshney, R.K., S.N. Nayak, G.D. May, and S.A. Jackson. 2009.

Next-generation sequencing technologies and their implications for crop genetics and breeding. Trends Biotechnol. 27:522-530.

Vignal, A., D. Milan, M. SanCristobal, and A. Eggen. 2002. A review on SNP and other types of molecular markers and their use in animal genetics. Genet. Sel. Evol. 34:275-305.

Wahyuni, Y., A.R. Ballester, E. Sudarmonowati, R.J. Bino, and A.G. Bovy. 2011. Metabolite biodiversity in pepper (Capsicum) fruits of thirty-two diverse cultivars: Variation in health-related compounds and implications for breeding. Phytochemistry 72:

1358-1370.

Wahyuni, Y., A.R. Ballester, Y. Tikunov, R.C.H. de Vos, K.T.B.

Pelgrom, A. Maharijaya, E. Sudarmonowati, R.J. Bino, and A.G. Bovy. 2013. Metabolomics and molecular marker analysis to explore pepper (Capsicum sp.) biodiversity. Metabolomics 9:130-144.

Weiss, E.A. 2002. Spice crops. CABI Publishing International, Oxon, UK p. 7-22.

Wittenberger, T., H.C. Schaller, and S. Hellebrand. 2001. An expressed sequence tag (EST) data mining strategy succeeding in the discovery of new G-protein coupled receptors. J. Mol.

Biol. 307:799-813.

Yang, H.B., W.Y. Liu, W.H. Kang, M. Jahn, and B.C. Kang.

2009. Development of SNP markers linked to the L locus in Capsicum spp. by a comparative genetic analysis. Mol. Breed.

24:433-446.

Yang, H.B., W.Y. Liu, W.H. Kang, J.H. Kim, H.J. Cho, J.H. Yoo, and B.C. Kang. 2012. Development and validation of L allele- specific markers in Capsicum. Mol. Breed.30:819-829.

Yi, G.B., J.M. Lee, S. Lee, D. Choi, and B.D. Kim. 2006.

Exploitation of pepper EST-SSRs and an SSR-based linkage map. Theor. Appl. Genet. 114:113-130.

Yoo, E.Y., S. Kim, Y.H. Kim, C.J. Lee, and B.D. Kim. 2003.

Construction of a deep coverage BAC library from Capsicum

annuum, ‘CM334’. Theor. Appl. Genet. 107:540-543.

수치

Table  1.  Sequencing  information  from  eight  pepper  accessions.
Table  2.  Results  of  alignment  of  each  accession  to  the  reference  sequence.
Fig.  1.  Location  of  412  SNP  markers  on  pepper  linkage  map.
Table  4.  The  number  of  SNPs  and  density  in  each  pepper  linkage  group.
+2

참조

관련 문서

The set-up of the printer was performed according to the installation guide provided in the printer user’s manual. The driver supplied with the printer was used.

It analyzes the 'Unification Attitude Survey 2010' survey dataset culled by the Institute for Peace and Unification Studies(IPUS) at Seoul National University

A laboratory experiment was performed to investigate the removal of nitrogen and phosphorus from plating factory effluent using the soil column.. Soil,

We determined the nucleotide sequences of the mitochondrial DNA (mtDNA) control region using cloning and sequencing, and obtained the complete sequence from the cattle bones

y 데스크톱 GIS 애플리케이션 개발을 위한 개발환경 y ArcGIS Desktop 기능의 GIS 컴포넌트와

그림 3.16 그림 3.13과 마찬가지로, 움직이는 파동묶음도 많은 독립된 파들로 구성되어 있다. 그 결과로 입자가 움직임에 따라서

2017 Copyright ã reserved by Mechanical and Aerospace Engineering, Seoul National University 75 The Beta distribution for reliability, its extreme distribution for

School of Mechanical and Aerospace Engineering Seoul National University..