DOI : http://dx.doi.org/10.5394/KINPR.2017.41.5.287
A Study on FSA Application to PRS for Safe Operation of Dynamic Positioning Vessel
Chong-Ju Chae*․†Yun-Chul Jung
*Associate Professor, Korea Institute of Maritime and Fisheries Technology, Busan 606-080, Korea
†Professor, Div. of Navigation Systems Engineering, Korea Maritime and Ocean University, Busan 606-701, Korea
Abstract: The Formal Safety Assessment (FSA) is a structured and systematic methodology developed by the IMO, aimed at assessing the risk of vessels and recommending the method to control intolerable risks, thereby enhancing maritime safety, including protection of life, health, the marine environment and property, by using risk analysis and cost-benefit assessment. While the FSA has mostly been applied to merchant vessels, it has rarely been applied to a DP vessel, which is one of the special purpose vessels in the offshore industry.
Furthermore, most of the FSA has been conducted so far by using the Fault Tree Analysis tool, even though there are many other risk analysis tools. This study carried out the FSA for safe operation of DP vessels by using the Bayesian network, under which conditional probability was examined. This study determined the frequency and severity of DP LOP incidents reported to the IMCA from 2001 to 2010, and obtained the Risk Index by applying the Bayesian network. Then, the Risk Control Options (RCOs) were identified through an expert brainstorming and DP vessel simulations. This study recommends duplication of PRS, regardless of the DP class and PRS type and DP system specific training. Finally, this study verified that the Bayesian network and DP simulator can also serve as an effective tool for FSA implementation..
Key words : Formal Safety Assessment, Dynamic Positioning System, Position Reference System, Risk Control Options, Bayesian, Network and Risk Index
†Corresponding author: ycjung@kmou.ac.kr 051) 410-4286
* katheshe76@naver.com 051) 620-5805
Note) This paper was presented on the subject of “A Study on FSA Application to PRS for Safe Operation of Dynamic Positioning Vessel” in 2017 Joint Conference KINPR proceedings(BEXCO, Busan, Korea. April 19-20, 2017 pp. 276-278).
1. Introduction
The Formal Safety Assessment (FSA) has been conducted by the IMO since 2007 and applied to merchant vessels including cruises, tankers, bulk carriers, container ships and liquified gas carriers. And through FSA, it is recommended to install the hardware system on a vessel (e.g., ECDIS, AIS radar integration system, installation of the Active Steering Gear Redundancy, etc.), implement new mandatory training courses (e.g., training on leadership and teamwork, leadership and managerial skill and ECDIS courses) and adopt new procedures (e.g., hot work procedures and training)(IMO, 2005), (IMO, 2006), (IMO, 2007). In other words, the FSA is used as a useful tool in the decision-making process of proposing amendments for the IMO’s mandatory instruments. The FSA has been applied to various vessel types, mostly focused on merchant vessels, but not to special purpose vessels such as the dynamic positioning vessels which mainly used in offshore plants. The DP vessel is known for its feature to maintain a certain position on the sea or accurately follow a path due
to the nature of its works, and there are around 7,000 or more DP vessels around the world. This study aims to implement the FSA for the safe operation of DP vessels.
The cause analysis of the Loss of Positioning (LOP) of DP vessels conducted in precedent studies showed that the major cause of DP LOP incidents for the decade was an error in the Position Reference System (PRS), accounting for 117 cases(Chae, 2015). Based on such findings, this study aims to examine the probable impact of PRS errors on DP LOP incidents by conducting the FSA to 117 DP LOP incidents caused by the PRS, presents propose the risk control options (RCOs) to prevent DP LOP incidents, and proposes the ways to mitigate hazard based on cost-benefit assessment.
2. Premise and Tools of Research
2.1 Research Premise
The cumulative data on human injury, property damage
and environmental pollution in the incident reports of DP vessels are necessary for the FSA implementation(IMO, 2008).
The FSA is used to recommend the methods to mitigate hazards such as human injury, environmental pollution, property damage, etc. resulting from marine incidents based on the cumulative data. One of incident reports on DP vessels is the IMCA’s DP Station Keeping Incidents.
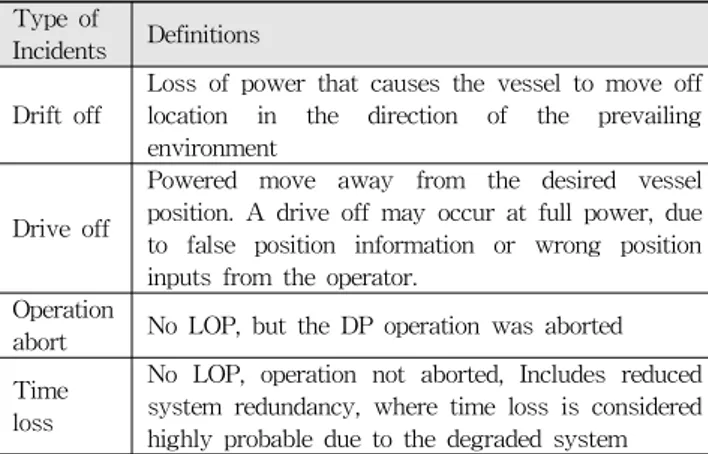
However, aforementioned hazards resulting from DP LOP incidents are not classified and analyzed in the data, these data cannot be regarded as risk factors. Therefore, in this study, it is considered the causes of DP LOP incidents and the severity by incident types as risk factors in conducting the FSA as in Table 1 with reference to previous studies.
Still, since drift off in Table 1 was caused by engine problems rather than by PRS errors, we excluded drift off from the incidents caused by PRS errors in the FSA implementation.
Type of
Incidents Definitions
Drift off Loss of power that causes the vessel to move off location in the direction of the prevailing environment
Drive off
Powered move away from the desired vessel position. A drive off may occur at full power, due to false position information or wrong position inputs from the operator.
Operation
abort No LOP, but the DP operation was aborted Time
loss
No LOP, operation not aborted, Includes reduced system redundancy, where time loss is considered highly probable due to the degraded system Table 1 Categorization of DP LOP Incidents(Shi, 2005).
2.2 Tools Used in the FSA
2.2.1 Brainstorming
Due to the limitations of finding designers and experts of the dynamic positioning system in Korea, supervisors of DP operation and Dynamic Positioning Operator(DPO) instructors mainly participated in brainstorming of this study. And, the FSA was mainly implemented in the aspect of operation.
Five individuals DPOs(2), a supervisor of DP operation(1), a DPO instructor(1) and a FMEA(Failure Mode and Effect Analysis) expert(1) carried out two rounds of brainstorming in order to determine the following:
A. Identifying the RCOs and setting priority
B. Deciding on amount of reduced risk by applying RCOs
2.2.2 Bayesian Network
The FSA implementation requires the analysis of all incidents that occurred for a certain period of time. This study analyzed prior probability and conditional probability of PRS errors on the drive off, time loss and operation abort of the DP vessels based on the application of the Bayesian Network. This enabled the quantitative analysis on the DP LOP incidents that occurred during a certain period of time, and we would like to propose effective methods to prevent DP LOP incidents in the areas with high frequency.
As a tool for the Bayesian Network, the GeNIe program developed by University of Pittsburg in the United States was used(IMO, 2006). GeNIe is a useful program that graphically displays prior probability and conditional probability by applying the incident data to the flow chart created based on qualitative analysis(Bayesfusion, 2015). DP LOP incidents data were arranged with MS Excel program because the GeNIe allows to analyze the Excel data format.
To this end, “0” was marked if there was any relevance between the cause and effect of DP LOP incidents, while
“1” was marked in case of no relevance, and the analysis was made on the GeNIe program. The causes of such incidents were referred to the DP LOP incident report.
3. Implementation of FSA
3.1 Hazard Identification(FSA Step 1)
The risk is assessed by multiplying the probability of incident by the consequence of damage. Quantified in the index, the Risk Index (RI) equals the Frequency Index (FI) added by the Severity Index (SI), and the notion is as follows.
Risk = Frequency × Consequence (1)
Log (Risk) = Log(Frequency) + Log (Consequence) (2) Risk Index = Frequency Index + Severity Index (3)
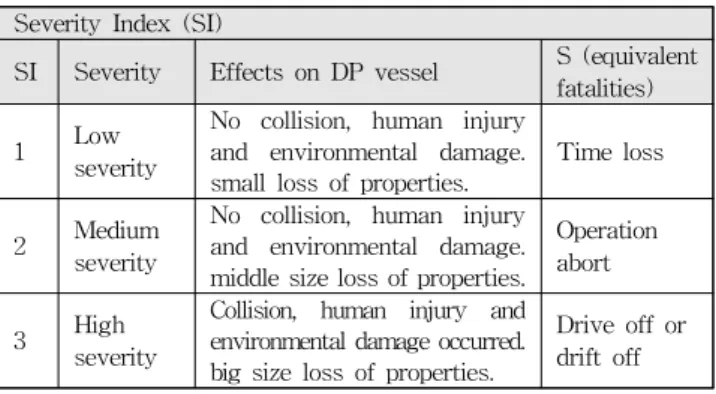
Table 2 classifies the severity of DP LOP incidents into drive off, operation abort and time loss, and quantifies it into the SI of LOP incidents based on the Table 1. Table 3 shows the FI of LOP incidents caused by PRS errors, which was determined in brainstorming based on the data of past incidents. The appropriate scope of FI standard can be determined based on incident reports. The RI based on the SI and the FI is shown in Table 4. Drive off (SI 3) in
case of FI 7 has the highest risk of 10 and time loss (SI 1) in case of FI 1 has the lowest risk of 2.
Severity Index (SI)
SI Severity Effects on DP vessel S (equivalent fatalities)
1 Low
severity
No collision, human injury and environmental damage.
small loss of properties. Time loss 2 Medium
severity
No collision, human injury and environmental damage.
middle size loss of properties.
Operation abort
3 High severity
Collision, human injury and environmental damage occurred.
big size loss of properties.
Drive off or drift off Table 2 Severity Index of LOP Incidents
Frequency Index (FI)
FI Frequency Definition F
7 Frequent 1 LOP during 1 month operation
of 1 DP vessel 10-1
6 Probable 1 LOP during 1 year operation of
1 DP vessel 10-2
5 Reasonably
probable 1 LOP during 1 year operation of
10 DP vessels 10-3
4 Unlikely 1 LOP during 1 year operation of
100 DP vessels 10-4
3 Remote 1 LOP during 1 year operation of
1,000 DP vessels 10-5
2 Very
remote 1 LOP during 1 year operation of
10,000 DP vessels 10-6
1 Extremely
remote 1 LOP during 20 years operation
of 5,000 DP vessels 10-7
Table 3 Frequency Index of PRS Error DP LOP Incidents
Risk Index (RI) of PRS
FI Frequency
Severity Index (SI)
1 2 3
Low (Time loss)
Medium (Operation
abort)
High (Drive off)
7 Frequent 8 9 10
6 Probable 7 8 9
5 Reasonably
probable 6 7 8
4 Unlikely 5 6 7
3 Remote 4 5 6
2 Very remote 3 4 5
1 Extremely
remote 2 3 4
Table 4 Risk Index of DP LOP Incidents(Chae, 2016)
3.2 Risk Analysis(FSA Step 2)
It is necessary to identify the frequency of LOP incidents in order to identify the hazard of DP LOP incidents caused by PRS errors. According to the IMO Guidance, the frequency of DP LOP incidents caused by PRS errors
equals the number of LOP incidents that occurred for a certain period of time divided by the duration in which a certain DP vessel was exposed to risks, or the DP vessel year(IMO, 2008). DP vessels do not operate 365 days a year and do not always use the DP system during operation.
Thus, such aspects should be taken into account in the calculation of the DP vessel year.
To this end, this study referred to previous studies on the DP vessel year, or the DP system operation period of a DP vessel in a year. Previous studies set the operation period of DP vessel and the period of DP system operation as 70%, respectively, and determined as follows (Shi, 2005).
365 × 0.7 × 0.7 = 178.85 (days) (4)
The number of the DP vessels exposed to risks was estimated based on the Clarkson (2012) and KMI (2012) reports. Since it was difficult to find data that classified the number of DP vessels separately, the average annual growth rate of 9% presented in the Clarkson (2012) report was reversely applied based on the total number of 6,052 DP vessels as of 2011 presented in the KMI (2012) report.
Accordingly, it was found that 38,840 DP vessels were operated for the decade from 2001 to 2010.
The total number of 38,840 DP vessels multiplied by the number of days a DP vessel was exposed to risks throughout the specified year, or 178.85 (days), equals the total number of days DP vessels were exposed to risks for a decade, which amounts to 6,946,534 (days). If the said figure is divided into 365 (days), it results in 19,032 DP vessel year. The frequency of DP LOP incidents related to the PRS for the decade based on such data is shown in Table 5. It is found that LOP incidents caused by PRS errors fall under the category of time loss, drive off and operation abort.
Incidents
scenario Numbers Incidents frequency
(per DP vessel hour) F-Proportion
Drive off 43 2.26 × 10⁻³ 36.75%
Operation
abort 10 5.25 × 10⁻⁴ 8.55%
Time loss 64 3.36 × 10⁻³ 54.70%
Total 117 6.15 × 10⁻³ 100%
Table 5 Frequency of DP LOP Incident Scenario Caused by PRS
In Table 6, the incidents that resulted in drive off, operation abort and time loss were classified into PRS types and the frequency was calculated. The frequency is calculated by dividing the number of PRS errors by the fleet at risks. It
is found that drive off and time loss caused by DGPS errors demonstrate the highest frequency.
Frequency of each PRS PRS Drive
off FrequencyOperation
abort Frequency Time
loss Frequency DGPS 31 1.63×10⁻³ 4 2.10×10⁻⁴ 31 1.63×10⁻³ Microwave
system 2 1.05×10⁻⁴ 1 5.25×10⁻⁵ 18 9.46×10⁻⁴ HPR 5 2.63×10⁻⁴ 3 1.58×10⁻⁴ 6 3.15×10⁻⁴ Taut-wire 2 1.05×10⁻⁴ 2 1.05×10⁻⁴ 2 1.05×10⁻⁴
Laser
reference 1 5.25×10⁻⁵ - - 2 1.05×10⁻⁴
DARPS 2 1.05×10⁻⁴ - - 5 2.63×10⁻⁴
Total 43 2.26×10⁻³ 10 5.25×10⁻⁴ 64 3.36×10⁻³ Fleet at risks: 19,032 DP vessel years
Frequency = Number of errors ÷ 19,032(DP vessel years) HPR : Hydro-acoustic Position Reference
DARPS : Differential Absolute and Relative Positioning Sensor Table 6 Error frequency of each PRS(Chae, 2016)
The RI in Table 7 was calculated based on Table 6 by applying the SI and the FI in Tables 3 and 4. It shows that drive off (RI 8) caused by the DGPS has the highest risk.
In the FSA, the hazard of incidents is expressed in the two-dimensional F-N curve(IMO, 2013). In the F-N curve of the IMO’s FSA, the horizontal axis “N” is the number of casualties in incidents and the vertical axis “F” is cumulative frequency(IEC, 2009).
Risk Index (RI)
Types of PRS
RI = FI + SI Drive off
SI = 3
Operation abort SI = 2
Time loss SI = 1
DGPS 8 6 6
Microwave system 7 5 5
HPR 7 6 5
Taut-wire 7 6 5
Laser reference 6 - 5
DARPS 7 - 5
Fleet at risks: 19,032 DP vessel years HPR : Hydroacoustic Position Reference
DARPS : Differential Absolute and Relative Positioning Sensor Table 7 RI of each PRS for DP LOP Incidents(Chae, 2016)
However, since the DP LOP incidents analyzed in this study do not include human injuries, this study set the aforesaid frequency of drive off, operation abort and time loss, caused by PRS errors as the horizontal axis “N” and the cumulative frequency as the vertical axis “F.”
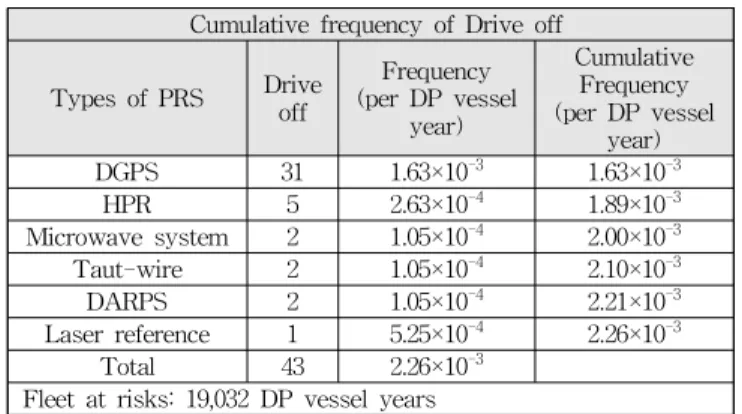
To this end, the frequency and cumulative frequency of LOP incidents with regard to drive off, operation abort and time loss were analyzed as in Tables 8 to 10. The
cumulative frequency is a value calculated by consecutively adding the frequency of each PRS.
Cumulative frequency of Drive off
Types of PRS Drive off
Frequency (per DP vessel
year)
Cumulative Frequency (per DP vessel
year)
DGPS 31 1.63×10⁻³ 1.63×10⁻³
HPR 5 2.63×10⁻⁴ 1.89×10⁻³
Microwave system 2 1.05×10⁻⁴ 2.00×10⁻³
Taut-wire 2 1.05×10⁻⁴ 2.10×10⁻³
DARPS 2 1.05×10⁻⁴ 2.21×10⁻³
Laser reference 1 5.25×10⁻⁴ 2.26×10⁻³
Total 43 2.26×10⁻³
Fleet at risks: 19,032 DP vessel years
Table 8 Cumulative Frequency of Drive Off(Chae, 2016)
Cumulative frequency Operation abort
Types of PRS Operation abort
Frequency (per DP vessel year)
Cumulative Frequency (per DP vessel year)
DGPS 4 2.10×10⁻⁴ 2.10×10⁻⁴
HPR 3 1.58×10⁻⁴ 3.68×10⁻⁴
Taut-wire 2 1.05×10⁻⁴ 4.73×10⁻⁴
Microwave system 1 5.25×10⁻⁵ 5.25×10⁻⁴
Total 10 5.25×10⁻⁴
Fleet at risks: 19,032 DP vessel years
Table 9 Cumulative Frequency of Operation Abort(Chae, 2016)
Cumulative frequency Time loss Types of PRS Time
loss
Frequency (DP vessel
year)
Cumulative Frequency (DP vessel year)
DGPS 31 1.63×10⁻³ 1.63×10⁻³
Microwave system 18 9.46×10⁻⁴ 2.57×10⁻³
HPR 6 3.15×10⁻⁴ 2.89×10⁻³
DARPS 5 2.63×10⁻⁴ 3.15×10⁻³
Taut-wire 2 1.05×10⁻⁴ 3.26×10⁻³ Laser reference 2 1.05×10⁻⁴ 3.36×10⁻³
Total 64 3.36×10⁻³
Fleet at risks: 19,032 DP vessel years
Table 10 Cumulative Frequency of Time Loss(Chae, 2016)
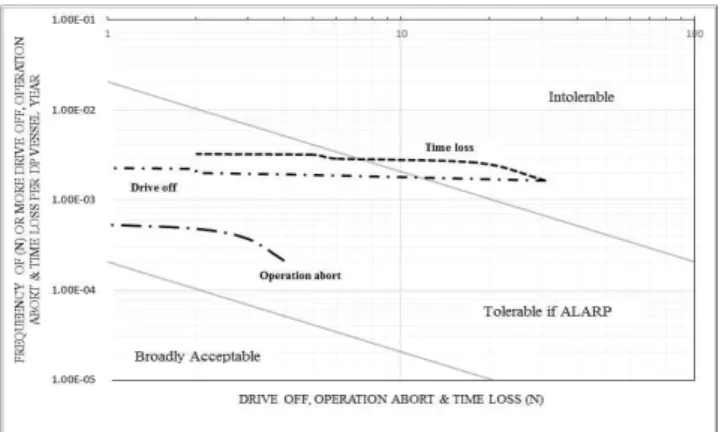
The F-N curve was created based on the cumulative frequency indicated in Tables 8 to 10 as in Fig. 1. As shown in Fig. 1, parts of time loss and drive off are beyond the boundary of As Low As Reasonably Practicable (ALARP). In Fig. 1, in general, Intolerable refers to the area where hazard should be reduced regardless of costs, Tolerable if ALARP refers to the area where hazard should be reduced to the extent that it is reasonably probable, and Broadly Acceptable refers to the area tolerable without further measures.
Fig. 1 F-N Curve of Drive off, Operation abort and Time loss(Lee et al, 2011), (IMO, 2007)
Various studies were carried out by industry on the permissible standard of ALARP boundary, which serves as the standard of such classifications(IMO, 2000). While the ratio of average casualties to the total production, the average death rate acceptable in the activities of DP vessels, the figure of economic value, etc. of certain activities are necessary, no research has been conducted on the permissible standard of social hazard and personal hazard in the operation of DP vessels.
No. Risks RI
1 Drive off caused by DGPS problems 8
2 Drive off caused by HPR problems 7
3 Drive off caused by Artemis problems 7 4 Drive off caused by Taut-wire problems 7 5 Drive off caused by DARPS problems 7 6 Drive off caused by Laser reference problems 6 7 Operation abort caused by DGPS problems 6
8 Time loss caused by DGPS problems 6
9 Operation abort caused by HPR problems 6 10 Operation abort caused by Taut-wire problems 6 11 Operation abort caused by Microwave system problems 5 12 Time loss caused by Microwave system problems 5
13 Time loss caused by HPR problems 5
14 Time loss caused by Laser reference problems 5 15 Time loss caused by DARPS problems 5 16 Time loss caused by Taut-wire problems 5 Table 11 Drive Off, Operation Abort & Time Loss Risks
Caused by PRS(Chae, 2016)
Based on the RI by PRS in Table 6 and the F-N curve in Fig. 1, the areas where it is necessary to control risks of LOP incidents caused by PRS errors were identified by the RI as in Table 11. Drive off caused by DGPS errors demonstrated the highest RI, followed by drive off caused by the HPR.
Next, the Bayesian Network was applied to quantitatively
examine the probability of PRS errors. In order to classify 117 PRS-related DP LOP incidents by the occurrence of failure in the MS Excel file, this study created a flow chart, ran the Excel file on the GeNIe, and examined the prior probability of DP LOP incidents as in Fig. 2. The leftmost factors indicate 10 kinds of errors by the PRS, and six factors represent the types of PRS used on the DP vessels.
As a result, the probability of LOP incidents caused by PRS errors is shown to be 48% for time loss, 41% for drive off and 14% for operation abort. In addition, in case of PRS, DGPS errors turned out to be the highest at 54%, the causes thereof were shown to be a signal weak or fail at 21% and hardware failure of PRS devices at 19%.
Fig. 2 Prior probability of PRS errors and LOP incidents
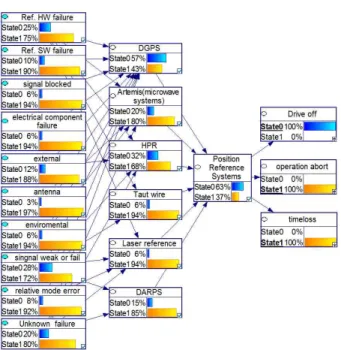
Fig. 3 shows, when the probability of occurrence of drive off is set at 100% (conditional probability), what would the probability of occurrence of causes be. According to Fig. 3, it is found that drive off would be caused by DGPS at 57%, by HPR at 31.7%, and by Artemis at 19.6%. In addition, the main causes of PRS errors are found to be signal weak or fail at 28.2%, hardware failure of the PRS at 25.0%, and the influence by external circumstances such as vessels surrounding the main vessel or other structures at 12.3%, etc.
Fig. 3 Conditional probability of Drive off
3.3 Risk Control Options(FSA Step 3)
Up to this point, this study have confirmed the PRS-related risk elements which mainly affect DP LOP incidents. In this paragraph, we would like to suggest Risk Control Options (RCOs) for the confirmed risk elements as above. We performed the identification of RCOs as per the following procedures.
① Identification of risks which need to be controlled (identified in the frequency analysis and the Bayesian Network)
② Identification of RCOs (brainstorming)
③ Determination of reduced risk level as per the application of RCOs (brainstorming and simulations were applied)
④ Identification and performance of RCOs, the cost-benefit assessment of which is necessary.
This study have proposed the RCOs to control risks of LOP incidents caused by PRS errors through experts’
brainstorming as provided in Table 12 based on the standards mentioned in the IMO’s FSA. In regard to brainstorming, we listed up the RCOs for each of the PRS device in advance and checked whether the experts agreed with each of the items listed therein.
To be granted the experts’ consent through brainstorming and determining priority of the proposed items, this study applied the expert concordance matrix as stated in MSC 83/INF. 2 and the equation is as follows(IMO, 2007).
·
(5) W = Expert Concordance Matrix
J = The total number of expert participants I = The number of proposed RCOs
Xij = Expert ‘j’ has thereby assigned rank Xijto scenario ‘i’
When W becomes “0”, it means that no agreement was made on the proposed scenario by experts; when W becomes “1”, it means that every expert agreed with the proposed scenario 100%. According to the Guidance, W >
0.7 shows a relatively high degree of expert concordance, 0.5 < W < 0.7 shows a middle degree of expert concordance, and W < 0.5 shows an unreliable degree of expert concordance(IMO, 2007). Table 12 is the result of brainstorming on the RCOs and the expert concordance stood at W = 0.91.
Table 12 Risk control options(Chae, 2016)
Types CodePRS RCOs
DGPS
A1 Installation of more than two types of PRS on theClass 1 DP vessel A2 Mandatory training on DGPS manufacturers A3 Use of more than two spot beam satellite servicesin the independent DGPS A4 Remote monitoring system of software on aregular basis
Artemis
B1 Installation of more than two types of PRS on theClass 1 DP vessel B2 Mandatory training on Artemis manufacturers B3 Insertion of the safety part in regard to thelocation of antenna installation in FMEA B4 Identification of problematic elements related to signals in advance and examination of them through a checklist
HPR
C1 Installation of more than two types of PRS on theClass 1 DP vessel C2 Mandatory training on HPR manufacturers C3 Output increase to strengthen the receipt andsending of sound waves Taut
-wire D1 Installation of more than two types of PRS on theClass 1 DP vessel D2 Mandatory training on taut-wire manufacturers
Laser reference
E1 Installation of more than two types of PRS on theClass 1 DP vessel E2 Mandatory training on laser reference
manufacturers
E3 Mandatory installation of remote monitoringsystem of software on a regular basis DARPS F1 Installation of more than two types of PRS on the
Class 1 DP vessel
F2 Mandatory training on DARPS manufacturers
Since it is inefficient to reduce the risk by applying all of the RCOs proposed in Table 12, this study determined the priority for application of RCOs as in Table 13 through another brainstorming.
Basically, the concept of redundancy is critically applied
to DP vessels. Accordingly, experts determined that installation of more than two types of PRS on the Class 1 DP vessel would be the RCO with the highest priority. In addition, the experts also agreed that providing training to manufacturers of PRS and related devices to ensure that they have a clear understanding of how to use equipment and limitations could become the RCO with highest priority.
PRS types High Medium Low
DGPS A1, A2 A3, A4
HPR C1, C2 C3
Artemis B1, B2 B3, B4
DARPS F1, F2
Taut-wire D1, D2
Laser reference E1, E2 E3
Table 13 Priority of RCOs(Chae, 2016)
In order to confirm the reduced risk level through the application of RCOs, this study checked the reduced risk level by applying DP simulation to A1, B1, C1 and E1. As D1 and F1 were not installed in the model DP vessel of a simulator, this study were not able to apply D1 and F1.
The DP simulator used in this case is the MT’s DP simulator of the United States installed in Korea in 2014.
Fig. 4 Concepts of DP vessel approach simulation
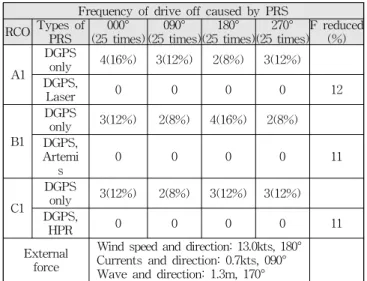
In order to confirm the frequency of reduced occurrence of drive off, operation abort and time loss in the DP simulation upon application of each of the RCOs, the DPO was set to make an Offshore Supply Vessel (OSV) approach a semi-submersible drilling rig. The approaches were made, by 25 times each, from places 250m apart from each side of the drilling rig as shown Fig. 4(Chae, 2016). In case more than two types of PRS are used on the DP vessel, there was a case where an error occurred actually in one of the PRS in the simulation. However, when the above was not the case, we triggered an artificial error in
PRS in the course of the operation, made the DPO responses to such error and checked the frequency of occurrence of drive off, operation abort and time loss.
As a result of the simulation performance, in case two PRS are installed and used as in Table 14, Drive off went down by 11% on average. Operation abort and time loss also went down by 10% and 15%, respectively .
Frequency of drive off caused by PRS RCO Types ofPRS 000°
(25 times) 090°
(25 times) 180°
(25 times) 270°
(25 times)F reduced (%)
A1
DGPSonly 4(16%) 3(12%) 2(8%) 3(12%) DGPS,
Laser 0 0 0 0 12
B1
DGPSonly 3(12%) 2(8%) 4(16%) 2(8%) DGPS,
Artemi
s 0 0 0 0 11
C1
DGPSonly 3(12%) 2(8%) 3(12%) 3(12%) DGPS,
HPR 0 0 0 0 11
External force
Wind speed and direction: 13.0kts, 180°
Currents and direction: 0.7kts, 090°
Wave and direction: 1.3m, 170°
Table 14 Frequency of Drive Off Caused by PRS during Simulation(Chae, 2016)
Based on the opinion of DPO instructors that about 30%
of those operating DP vessels do not receive any training on manufacturers, experts agreed through brainstorming that the reduced risk level caused by training of manufacturers about PRS equipment (A2, B2, C2, D2, E2 and F2) as in the RCOs of Table 12 would be 30%.
Based on the simulation result and 30% of the reduced risk level caused by training of manufacturers, this study applied the reduced risk level and drew F-N curve, and the result was shown as in Fig. 5.
Fig. 5 F-N curve after RCOs applied(Chae, 2016)
It is found that both time loss and drive off, which went beyond the boundary line in Fig. 1, moved to the Tolerable if ALARP part. Through the above, this study was able to confirm that installation of more than two types of PRS on every DP vessel and training about the relevant equipment would be able to bring resonable amount of reduction in the risk of incidents of drive off, operation abort and time loss on DP vessels.
3.4 Cost-benefit Assessment(FSA Step 4)
According to the IMO Guidance, Gross Cost of Averting a Fatality (GCAF) and Net Cost of Averting a Fatality (NCAF) are used as the standards to measure the cost-benefits of RCOs for reduction of risk.
GCAF measures the cost benefits of RCOs by checking the ratio of additional expenses of RCOs spent to reduce the risk to human life, whereas NCAF measures the cost benefits of RCOs by checking the ratio of additional expenses of RCOs spent to reduce the risk to human life in comparison with the economic benefit thereof(IMO, 2013).
The equations are as follows.
∆
∆
∆∆
(6)
∆
∆
∆∆
(7)
△Cost: Cost per ship of the risk control option during the lifetime of the vessel.
△EcomomicBenefit: Economic benefit per ship resulting from the implementation of the risk control option during the lifetime of the vessel.
△Risk : Risk reduction per ship, in terms of the number of fatalities averted, implied by the risk control option during the lifetime of the vessel.
This study calculated the expenses incurred to reduce the risk of LOP incidents of DP vessels. In addition, in case of NCAF, expenses incurred for protection of human life, values of vessel and cargo at the time of total loss, crew and repair expenses, etc. which are included in the economic benefits need to be quantified. However, since there is a limit to secure the relevant materials necessary.
therefor, we applied GCAF only (Lee et al, 2011). Based on such premise, this study performed the cost-benefit assessment as per the following procedures.
① Application of the simulation to confirm the reduced risk level caused by additional installation of PRS and confirm the reduced risk level (△R = T(lifetime) × △PLOP(Potential risk reduction of LOP incidents))
② Confirmation of the reduced risk level of LOP incidents obtained through brainstorming
③ Confirmation of the expenses incurred upon application of the RCOs by listening to opinions of manufacturers and vessel companies in order to confirm the price and maintenance cost of PRS device to be added (△C)
④ △C refers to the sum of expenses incurred from application of RCOs and is calculated by using NPV equation
⑤ Calculation of the GCAF on the RCOs
⑥ Confirmation of the reduced risk level expected upon application of the RCOs, the GCAF and the relevant equation
In this case, the PLOP refers to the reduced risk of LOP incidents per DP vessel years and △PLOP refers to the potential risk reduction of LOP incidents per DP vessel after the application of RCOs. The NPV in the equation (9) refers to the net present value, and the meaning of each factor is as follows.
⋯
(9)
Xt : Cost or benefit of RCO any given year
A : Amount spent initially for the RCO implementation r : Interest rate (5%)
T : Lifetime of ships (25 years)
The data on the initial installation costs of the PRS were provided by DP equipment manufacturers as in Table 15(Chae, 2016).
DGPS Artemis HPR Taut
-wire Laser DARPS Initial
installation
costs(A) 65,000 135,000 300,000 250,000 50,000 95,000 Maintenance
cost/year(Xt) 20,000 20,000 20,000 20,000 20,000 20,000 Table 15 PRS Installation & Maintenance Costs (Unit: USD)
The cost-benefit analysis on RCOs A1, B1 and C1 was carried out accordingly as in Tables 16 to 18(Chae, 2016).
RCO A1 Initial F %
Reduction F
Reduction PLOP Final Drive off 1.63×10⁻³ 12% 1.95×10⁻⁴ 1.43×10⁻³ Operation
abort 2.10×10⁻⁴ 8% 1.68×10⁻⁵ 1.93×10⁻⁴ Time loss 1.63×10⁻³ 16% 2.61×10⁻⁴ 1.37×10⁻³ Total 3.47×10⁻³ 4.73×10⁻⁴ 2.99×10⁻³
ReductionRisk
△R
Cost △C
(US$) GCAF
(US$)
RCO A1-1(HPR) 2.11 581,879 275,772
RCO A1-2(Taut-wire) 2.11 531,879 252,075 Table 16 Cost-benefit assessment for RCO A1
RCO B1 Initial F %
Reduction F
Reduction PLOP Final Drive off 1.05×10⁻⁴ 11% 1.16×10⁻⁵ 9.36×10⁻⁵ Operation
abort 5.25×10⁻⁵ 14% 7.36×10⁻⁶ 4.52×10⁻⁵ Time loss 9.46×10⁻⁴ 14% 1.32×10⁻⁴ 8.13×10⁻⁴ Total 1.10×10⁻³ 1.51×10⁻⁴ 9.52×10⁻⁴
reductionRisk
△R
Cost △C
(US$) GCAF
(USD) RCO B1-1 (HPR) 6.75×10⁻¹ 581,879 862,043 RCO B1-2 (Taut-wire) 6.75×10⁻¹ 531,879 787,969 Table 17 Cost-benefit assessment for RCO B1
RCO C1 Initial F %
Reduction F
Reduction PLOP Final Drive off 2.63×10⁻⁴ 11% 2.89×10⁻⁵ 2.34×10⁻⁴ Operation
abort 1.58×10⁻⁴ 14% 2.21×10⁻⁵ 1.36×10⁻⁴ Time loss 3.15×10⁻⁴ 16% 5.04×10⁻⁵ 2.65×10⁻⁴ Total 7.36×10⁻⁴ 1.01×10⁻⁴ 6.34×10⁻⁴
reductionRisk
△R
Cost △C
(US$) GCAF
(US$) RCO C1 (Taut-wire) 4.52×10⁻¹ 531,879 1,176,723 Table 18 Cost-benefit assessment for RCO C1
The GCAF of RCOs A1, B1 and C1 was found to be USD 275,772 (A1), USD 862,043 (B1), and USD 1,176,723 (C1), respectively. The IMO Guidance indicates the GCAF which costs USD 3,000,000 or less has cost benefits(IMO, 2006), (IMO, 2008). Therefore, RCOs A1, B1 and C1, which install more than two types of PRS on every DP vessel, are more reasonable in terms of cost-benefit assessment.
3.5 Recommendations(FSA Step 5)
So far, this study conducted the FSA from Steps 1 to 4, and based on the FSA on the PRS of the DP vessels in Step 5, this study make the following recommendations to mitigate risks of DP LOP incidents caused by PRS.
① RCO A1: Additional installation of HPR or taut-wire on the DP vessels where the DGPS is the only PRS
② RCO B1: Installation of HPR as the third PRS on the DP vessels where DGPS and Artemis are installed as the PRS
③ RCO C1: Installation of taut-wire as the third PRS on the DP vessels where DGPS and HPR are installed as the PRS
④ RCO A2, B2, C2, D2, E2 and F2: Recommendation to provide training for manufacturers of the PRS(PRS type specific) DP system.
4. Conclusion
This study conducted the FSA on PRS errors, the main cause of DP LOP incidents identified in previous studies, for safe operation of DP vessels, and the results are as follows.
First, 117 DP LOP incidents caused by PRS errors were analyzed based on the Bayesian Network, and the conditional probability of PRS in drive off was found to be 57.0% for the DGPS, 31.7% for the HPR, and 19.6% for the Microwave system. Moreover, it was verified that the main causes of such errors were signal weak or fail, hardware failure, external influences, etc.
Second, the F-N curve based on the analysis of frequency and Bayesian Network demonstrated that parts of drive off and time loss were beyond the reasonably tolerable risk of LOP incidents caused by PRS errors. In order to reduce risks to reasonably tolerable scope, this study proposed the RCO to install more than two types of PRS on every DP vessel. The effect of the proposed RCO was examined in simulation, and it was found that the average risk reduction stood at 17%. Moreover, as a result of brainstorming, it was found that training of PRS type specific may reduce the risk of LOP incidents by about 30%.
Third, after applying the amount of reduced risks to the F-N curve, this study found that drive off and time loss were within the scope of tolerable boundary of ALARP.
Moreover, it was confirmed in the cost-benefit assessment of the proposed RCOs that installing more than two types of PRS and providing training of PRS type specific were also reasonable in terms of cost-benefits.
Fourth, in the process of FSA implementation, it was found that the Bayesian Network could be useful in risk analysis. Further, simulations were found to be useful tools to prove effectiveness of the proposed RCOs.
In the future, based on this study, various researches should be carried out by conducting the FSA on hardware and human errors of domestic vessels and identifying necessary measures for safe operation of different types of vessels.
Acknowledgements
This paper is based on dissertation thesis of Chong-Ju Chae, titled ‘An Application of FSA for Safe Operation of Dynamic Positioning Vessels’
References
[1] 이종갑, 나성, 김홍태, 박재홍(2011), “국적일반화물선 초기 안전성평가(High-level FSA) 연구(2)”, 한국항해항만학회 지 제35권 제1호, pp. 23-30.
[2] 한국해양수산개발원(2012), Measures to Encourage OSV Market Entrance for National Wealth Creation(국부창출 을 위한 OSV 시장진출 활성화 방안 연구), p. 39.
[3] BAYESFUSION, LLC, 2015. Data Analytics, Mathematical Modeling, Decision Support.
http://www.bayesfusion.com/#!downloads/rxu9q.
[4] C. J. Chae, 2016. “An Application of FSA for Safe Operation of Dynamic Positioning Vessels”, Navigation System Engineering, KMOU, Busan, pp. 51-55, pp.
57-58, pp. 60-62, p. 64, pp. 70-81
[5] C. J. Chae and Y. C. Jung, 2015. An Analysis on Incident cases of Dynamic Positioning Vessels, J.
Navig. Port Res, Vol. 39, No. 3, pp. 150-153.
[6] CLARKSON, 2012. Overview of the Offshore Supply Vessel Industry, p. 10.
[7] IEC, 2009. Risk assessment techniques, risk management, international standard, IEC/FDIS 31010, pp. 21-27, p. 76, pp. 51-53. pp. 79-81.
[8] IMO, 2000. Formal Safety Assessment, Decision parameters including risk acceptance criteria, pp. 3-10, p. 20.
[9] IMO, 2005. Passenger ship Safety, Effective Voyage Planning for Passenger ship’s, FSA-Large Passenger Ships-Navigational Safety, Norway. Nav 51/10, pp.
36-37.
[10] IMO, 2006. Formal Safety Assessment, Consideration of utilization of Bayesian network at step 3 of FSA, Evaluation of the effect of ECDIS, ENC and Track control by using the Bayesian Network, Japan. MSC 81/18/1, pp. 2-4.
[11] IMO, 2006. Formal Safety Assessment, Possible improvements on FSA guidelines, MSC 82/INF. 3, p.
5, pp. 14-15.
[12] IMO, 2007. Formal Safety Assessment, FSA – container vessels, Denmark. MSC 83/21/2, pp. 16-17.
[13] IMO, 2007. Formal Safety Assessment, FSA – Liquefied Natural Gas(LNG) carriers, Denmark. MSC 83/21/1, pp. 15-17.
[14] IMO, 2007, Consolidated text of the Guidelines for Formal Safety Assessment for use in the IMO rule-making process MSC 83/INF. 2, pp. 49-55, pp.
60-62.
[15] IMO, 2008. Formal Safety Assessment(FSA)-Crude Oil Tankers, MEPC 58/17/2, p. 116.
[16] IMO, 2008. Formal Safety Assessment, FSA – Crude Oil Tankers, Denmark. MEPC 58/INF. 2, p. 132, pp.
136-137.
[17] IMO, 2008. Formal Safety Assessment, FSA – Cruise ships, Denmark. MSC 85/17/1, pp. 18-19.
[18] IMO, 2013. MSC-MEPC. 2/Circ.12. Revised guidelines for formal safety assessment(FSA) for use in the IMO Rule-making process, p. 3, p. 11, p.15, pp. 25-27, p.
45, p 50, p. 53.
[19] IMCA, 1994. Risk analysis of collision of Dynamically positioned support vessel with offshore installation, pp.
16-20.
[20] Shi Phillips and Martinez, 2005. Case Study of DP Vessels Performing SIMOPS, DYNAMIC POSITIONING CONFERENCE, p. 2.
[21] Sorensen, L. J. et al, 2014. Understanding Human Decision Making During Critical Incidents in Dynamic Positioning, Department of Maritime Technology and Innovation Marine Human Factors Group, Vestfold University College, pp. 1-7.
Received 7 August 2017 Revised 14 October 2017 Accepted 16 October 2017