* Corresponding author : Hyowon Lee, Korea National Open University, Seoul 110-791, Korea; Tel: +82-2-2652-2810; Fax: +82-2-3679- 2381; E-mail: [email protected]
Studies on 5 Protein Fractions Prediction of Forage Legume Mixture by NIRS
Hyo-Won Lee
1*, Sungkwon Jang
1, Hyo-Jin Lee
2and Hyung-Soo Park
31
Department of Agriculture, Korea National Open University, Seoul 110-791, Korea,
2
Department of Landscape Architecture, Sungkyunkwan University, Suwon 440-746, Korea,
3
National Institute of Animal Science, RDA, Cheonan 330-801, Korea
ABSTRACT
This study was conducted to assess the feasibility of near-infrared reflectance spectroscopy (NIRS) as a rapid and reliable method for the estimation of crude protein (CP) fractions in forage legume mixtures (sudangrass and pea mixture, and kidney bean and potato mixture). A total of 178 samples were collected and their spectral reflectance obtained in the range of 400~2,500 nm.
Of these, 50 samples were selected for calibration and validation, and 35 samples were used for calibration of the data set, and the modified partial least square regression (MPLSR) analysis was performed. The correlation coefficient (r2) and the standard error of cross-validation (SECV) of the calibration models in the CP fractions, A, B1, B2, B3, and C, were 0.94 (1.05), 0.92 (0.74), 0.96 (0.95), 0.91 (0.42), and 0.83 (0.38), respectively. Fifteen samples were used for equation validation, and the r2 and the standard error of prediction (SEP) were 0.87 (1.45), 0.91 (0.49), 0.94 (1.13), 0.36 (0.96), and 0.74 (0.67), respectively. This study showed that NIRS could be an effective tool for the rapid and precise estimation of CP fractions in forage legume mixtures.
(Key words : Five crude protein fractions, Forage, Legume, MPLSR, NIRS)
Ⅰ. INTRODUCTION
Efficient use of nitrogen feed is a key issue in reducing feed costs and in the desirable environmentally friendly production of beef and milk. Crude protein (CP) is subject to extensive degradation in the rumen and thus, part of the CP may become available for digestion and amino acid absorption in the small intestine (Kirchhof, 2010). Therefore, it is necessary to consider the biological availability of CP when estimating its nutritional value.
The kinetics of feed degradation is an important component for the determination of the total availability of ingested nutrients (Allen and Mertens, 1988). The in situ ruminal incubation method is the most commonly used approach in estimating the feeding value of feed ingredients.
However, this method is labor and cost intensive due to its dependence on ruminally cannulated animals. Another means of analysis is the in vitro gas production technique (Tilley and Terry, 1963; Menke and Steingass, 1988; Broderick, 1987), which requires less time and is more economical
compared to the in situ incubation method.
Currently, the Cornell Net Carbohydrate and Protein System (CNCPS) is widely used for the in vitro method (Sniffen et al., 1992). According to CNCPS system, CP is divided into three fractions, A, B, and C. Fraction A is defined as CP originating from non-protein nitrogen, fraction B is true protein and fraction C is unavailable protein for ruminants. Additionally, fraction B is further divided into three fractions, B1, B2, and B3, according to their different ruminal degradation rates. Fraction B1 is soluble in phosphate-borate buffer and is rapidly degraded in the rumen. Fraction B2 is insoluble in this buffer but is soluble in neutral media, has an intermediate rate of ruminal degradation, and partially escapes to the lower gut.
Fraction B3 is also insoluble in the buffer, as well as in neutral detergent, but is soluble in acid detergent solution.
Near infrared reflectance spectroscopy (NIRS) is a widely
used laboratory method for the rapid evaluation of chemical
composition for forage quality parameters such as CP,
neutral detergent fiber (NDF), and acid detergent fiber (ADF)
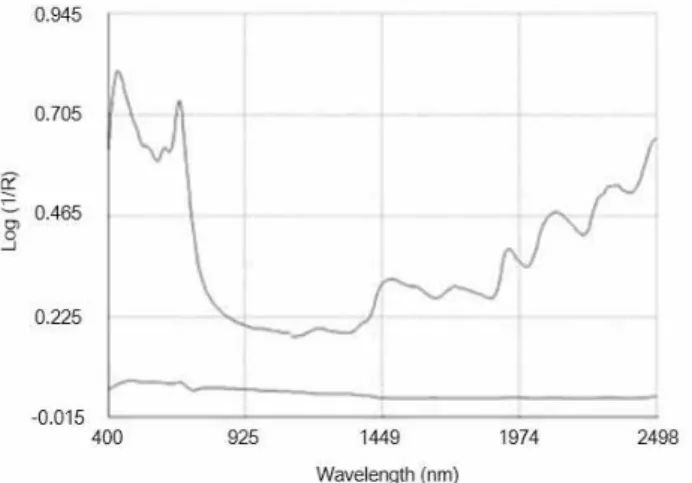
Fig. 1. Average NIR spectrum (upper line) and standard deviation (lower line) of all samples.
( Norris et al., 1976 ; Marten et al., 1984 ; Stimson et al., 1991 ; Berardo 1997 ). In Korea, the NIRS method was tested on various forages, such as Italian ryegrass (Lee, 1996), Italian ryegrass silages (Park et al., 2012), rice straw (Lee and Park, 2001), and corn silage (Park et al., 2006), for the estimation of forage quality parameters. However, NIRS has not been widely used for the estimation of the five CP fractions.
Therefore, the purpose of this study aims to identify the applicability of NIRS methods as an alternative analysis method for the prediction of forage CP fractions that is usually done using wet chemistry.
Ⅱ. METHODS
1. Forage sampling and spectral measurements
A total of 178 samples (154 sudangrass and pea mixed samples, and 24 kidney bean and potato mixed samples) were collected from Inchon in 2011 and from Kangwon in 2012. After drying at 105°C for 48 h in a forced-air oven, the samples were ground with a mill and passed through a sieve with a 0.5 mm mesh wire. The ground sample was put into a round cup of 55 mm diameter. All samples were then scanned at ambient temperature using a spectro- photometer (FOSS 6500, Foss NIRSystems, Silver Springs, MD, USA) with a spectral reflectance range of 400~1,050 nm and a sampling wavelength interval of 2 nm spectral.
Of the 178 samples, 50 were selected after the removal of samples with similar spectral patterns.
2. Fractionation of the crude protein
The CP of the selected 50 forage samples was determined by the Kjeldahl method, with a factor of 6.25 used in the conversion of N to CP (AOAC, 1995). The five CP fractions were then calculated by CP fractionation (Kirchhof, 2010). Fraction A was calculated as the difference between the total CP and the precipitated true protein, which was determined by Kjeldahl analysis of the residue obtained after precipitation with tungstic acid and subsequent filtration.
Fraction B1 was estimated as true protein minus buffer- insoluble protein; fraction B2 as buffer-insoluble protein
minus neutral detergent insoluble nitrogen (NDIN), multiplied by 6.25; and fraction B3 as NDIN (6.25) minus fraction C.
Fraction C is the acid detergent insoluble nitrogen or acid detergent insoluble CP.
3. Calibration and validation
To determine the ability of NIRS to predict the five CP fractions, analyses were performed using two-thirds of the samples (n = 35), randomly selected, as the calibration set and one-third of the samples (n = 15), randomly selected, as the validation set. Using reflectance and the data from the five fractions of CP of the calibration data set, prediction equations were calculated by a modified partial least square regression using WinISI software (Windows version 1.60, Foss, and Infrasoft International LLC, State College, PA) and the correlation coefficient (r
2), standard error of calibration (SEC), and standard error of cross validation (SECV) were recorded. After calibration, validation procedures were conducted by using the validation set and recording the r
2and SEC.
Ⅲ. RESULTS AND DISCUSSION
Fig. 1 shows the average and standard deviation (SD) of
the logarithm of the reciprocal reflectance values (log
10(1/R)),
where R is the percentage reflectance of 50 samples. The
results showed the spectral characteristics of the samples
from the mixtures of sudangrass and pea, and kidney bean
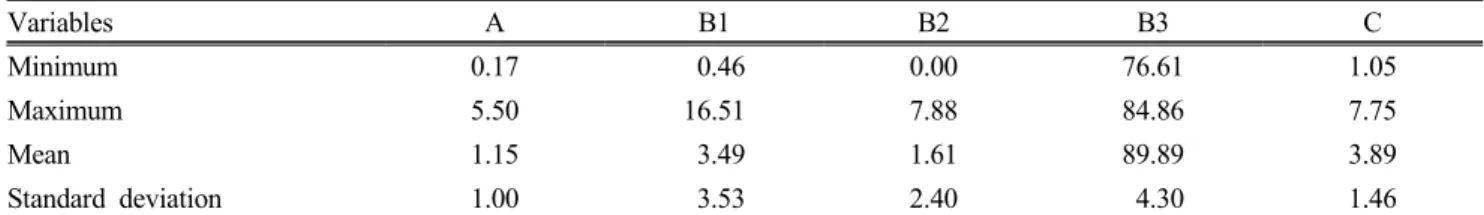
Table 1. Range and standard deviation of five fractions of 50 samples
Variables A B1 B2 B3 C
Minimum 0.17 0.46 0.00 76.61 1.05
Maximum 5.50 16.51 7.88 84.86 7.75
Mean 1.15 3.49 1.61 89.89 3.89
Standard deviation 1.00 3.53 2.40 4.30 1.46
Table 2. Standard error of calibration (SEC), multiple correlation coefficient (r
2) and standard error of cross validation (SECV) of the calibration and r
2and standard error of prediction (SEP) of the equation validation of five fractions
Fraction Calibration (n=35) Validation (n=15)
SEC
r2SECV SEP
r2A 0.85 0.94 1.05 1.45 0.87
B1 0.69 0.92 0.74 0.49 0.91
B2 0.76 0.96 0.95 1.13 0.94
B3 0.38 0.91 0.42 0.96 0.36
C 0.22 0.83 0.38 0.67 0.74
Fig. 2. Relationship between laboratory values and predicted values for (a) fraction A, (b) fraction B1, (c) fraction B2, (d) fraction B3, and (e) fraction C.
and potato. Table 1 shows the range (minimum, maximum, and mean values) and SD of crude protein fractions.
The characteristic spectrum absorption of forage samples
includes overlapping information regarding forage quality.
Therefore, it is difficult to identify which waveband corresponds
to a specific variable. However, this information provides
useful data for the prediction of various forage variables, such as the average spectrum peak (1.449 nm and 1974 nm), which was in accordance with the results of Lee et al., (2009) regarding forage crops and spring-sown forage crops (Lee, 2011).
Due to the nature of the NIRS spectra, which consists of overtones and combinations of fundamental infrared absorption frequencies (Marten et al., 1985), as well as small differences in the spectra, extensive mathematical manipulations are used to extract the useful information from the NIRS spectra (Osborne, 1981). In this study, the modified partial least square regression analysis was used. Table 2 shows the results of the calibration with SEC, r
2, and SECV and of the validation with r
2and SEP values of the five crude protein fractions.
The r
2values of fractions A, B1, B2, B3, and C were 0.94, 0.92, 0.96, 0.91, and 0.83, respectively. High r
2and a low SEC show the model has high predictive ability (Marten et al., 1989). The calibration model of fraction C exhibits a lower predictive ability compared to fractions A, B1, B2, and B3, which all showed a high predictive ability.
Fig. 2 shows the equation validation results for 15 samples.
The r
2values of fraction A, B1, B2, B3 and C were 0.87, 0.91, 0.94, 0.36, and 0.74, respectively. Fraction A, B1, and B2 showed higher predictive accuracy than fractions B3 and C, with fraction B1 having the highest accuracy.
Previous studies on nitrogen estimation using NIRS reported r
2values as 0.93 for animal waste (Ko, 2004), 0.86 for forage crops (Lee et al., 2009), and 0.97 for spring-sown forage crops (Lee et al., 2011). In comparison, our NIRS methods for the estimation of the five fractions of CP also showed high predictive ability. Thus, NIRS may be a simple and cost-effective laboratory method for the rapid evaluation and estimation of the five fractions of CP of forage.
Ⅳ. CONCLUSION
This study was conducted to test the applicability of NIRS methods as an alternative to wet analysis for the estimation of the five CP fractions. For mixed forage legumes (sudangrass and pea, and kidney bean and potato), the fractions A, B1, B2, and B3 showed high predictive ability,
while fraction C showed lower relative predictive ability.
NIRS as a laboratory method may thus be a simple and cost-effective method for the estimation of the five fractions of CP when compared with wet analysis, particularly for fractions A, B1, B2, and B3.
Ⅴ. ACKNOWLEDGEMENT
This research was supported by a 2013 Grant-in-Aid from Korea National Open University.
Ⅵ. REFERENCES
Allen, M.S. and Mertens, D.R. 1988. Evaluating constraints on fiber digestion by rumen microbes. Journal of Nutrition. 118:261-270.
A.O.A.C. 1995. Official methods of analysis 16th edition. Association of official analytic chemist (Washington D.C.).
Berardo, N. 1997. Prediction of the chemical composition of white clover by near-infrared reflectance spectroscopy. Grass and Forage Science. 52:27-32.
Broderick, G.A. 1987. Determination of protein degradation rates using a rumen in vitro system containing inhibitors of microbial nitrogen metabolism. British Journal of Nutrition. 58:463-475.
Kirchhof, S., Eisner, I., Gierus, M. and Sudekum K.-H. 2010.
Variation in the contents of crude protein fractions of different forage legumes during the spring growth. Grass and Forage Science. 65:376-382.
Ko, H.J. 2004. Application of NIRS analysis for assessment of compost, and investigation of odor emitted from animal wastes, and their source identification of nitrate-nitrogen (in Korean).
Ph.D. thesis. Seoul. Korea.
Lee, H.W. 2011. Prediction on the quality of forage crop seeded in spring by near infrared reflectance spectroscopy (NIRS) (in Korean). Journal of the Korean Society of Grassland and Forage Science. 31:409-414.
Lee, H.W. and Park, H.S. 2001. Application of near infrared reflectance spectroscopy to estimate forage quality (in Korean).
Journal of Korea National Open University. 32:205-213.
Lee, H.W., Kim, J.D., Kim, W.H. and Lee, J.K. 2009. Prediction on the quality of forage crop by near infrared reflectance spectroscopy (in Korean). Journal of the Korean Society of Grassland and Forage Science. 29:31-36.
Lee, H.W., Kim, J.D., Han, K.J. and Kim, D.A. 1996. Forage quality evaluation using NIRS. 1. Estimating ADF and NDF of Italian ryegrass using NIRS (in Korean). Journal of Korea National
Open University. 22:375-385.
Marten, G.C., Brink, G.E., Buxton D.R., Halgerson, J.L. and Hornstein, J.S. 1984. Near infrared reflectance spectroscopy analysis of forage quality in four legume species. Crop Science.
24:1179-1182.
Marten, G.C., Shenk, J.S. and Barton, F.E. 1985. Near infrared spectroscopy (NIRS): analysis of forage quality. USDA Agriculture Handbook. No. 643, US Govt. Print. Office, Washington DC, USA.
Marten, G.C., Shenk, J.S. and Barton, F.E. 1989. Near infrared reflectance analysis of forage quality. USDA Agriculture Handbook. No 643 (revised), US Govt. Print. Office, Washington DC, USA.
Menke, K.H. and Steingass, H. 1988. Estimation of the energetic feed value obtained from chemical analysis and in vitro gas production using rumen fluid. Animal Research and Development. 28:7-55.
Norris, K.H., Barnes, R.F., Moore, J.E. and Shenk J.S. 1976.
Predicting forage quality by infrared reflectance spectroscopy.
Journal of Animal Science. 43:889-897.
Osborne, B.G. 1981. Principles and practice of near infrared (NIR) reflectance analysis. Journal of food technology. 16:13.
Park, H.S., Lee, S.H., Choi, K.C., Lim, Y.C., Kim, J.G., Seo, S. and Jo, K.C. 2012. Effect of sample preparation on predicting chemical composition and fermentation parameters in Italian ryegrass silages by near infrared spectroscopy (in Korean). Journal of Livestock Housing and Environment. 18:257-266.
Park, H.S., Lee, J.K., Lee, H.W., Kim, S.G. and Ha, J.K. 2006.
Prediction of the digestibility and energy value of corn silage by near infrared reflectance spectroscopy (in Korean). Journal of the Korean Society of Grassland and Forage Science. 26:45-52.
Sniffen, C.J., O’Connor, J.D., Van Soest, P.J., Fox, D.G. and Russell, J.B. 1992. A net carbohydrate and protein system for evaluating cattle diets: II. Carbohydrate and protein availability. Journal of Animal Science. 70:3562-3577.
Stimson, C., Kellaway, R.C., Tassell, R.J. and Ison, R.L. 1991.
Prediction of the nutrient content of botanical fractions from annual legumes by near-infrared reflectance spectroscopy. Grass and Forage Science. 46:99-105.
Tilly, J.M. and Terry, R.A. 1963. A two-stage technique for the in vitro digestion of forage crops. Journal of the British Grassland Society. 18:104-111.
(Received September 1, 2014 / Revised September 16, 2014 / Accepted September 19, 2014