• 검색 결과가 없습니다.

Indoor to Outdoor Ratio of Fine Particulate Matter by Time of the Day in House According to Time-activity Patterns

N/A
N/A
Protected

Academic year: 2021

Share "Indoor to Outdoor Ratio of Fine Particulate Matter by Time of the Day in House According to Time-activity Patterns"

Copied!
9
0
0

로드 중.... (전체 텍스트 보기)

전체 글

(1)

시간활동양상에 따른 주택의 시간대별 실내·실외 초미세먼지 농도비

박진현*

,

** · 김은채* · 최영태* · 류현수* · 김순신*

,

*** · 우병렬* · 조만수* · 양원호*

,

**

*대구가톨릭대학교 산업보건학과, **대구가톨릭대학교 환경보건모니터링센터,

***대구지방환경청 구미화학재난합동방재센터

Indoor to Outdoor Ratio of Fine Particulate Matter by Time of the Day in House According to Time-activity Patterns

Jinhyeon Park*

,

**, Eunchae Kim*, Youngtae Choe*, Hyoensu Ryu*, Sunshin Kim*

,

***, Byung Lyul Woo*, Mansu Cho*, and Wonho Yang*

,

**

*Department of Occupational Health, Daegu Catholic University

**Center of Environmental Health Monitoring, Daegu Catholic University

***Gumi Joint Inter-agency Chemical Emergency Preparedness Center, Daegu Regional Environmental Office

GRAPHICAL ABSTRACT

ABSTRACT

Objective: The purpose of this study was to evaluate the indoor to outdoor ratio (I/O ratio) of time activity patterns affecting PM

2.5

concentrations in homes in Korea through a simulation.

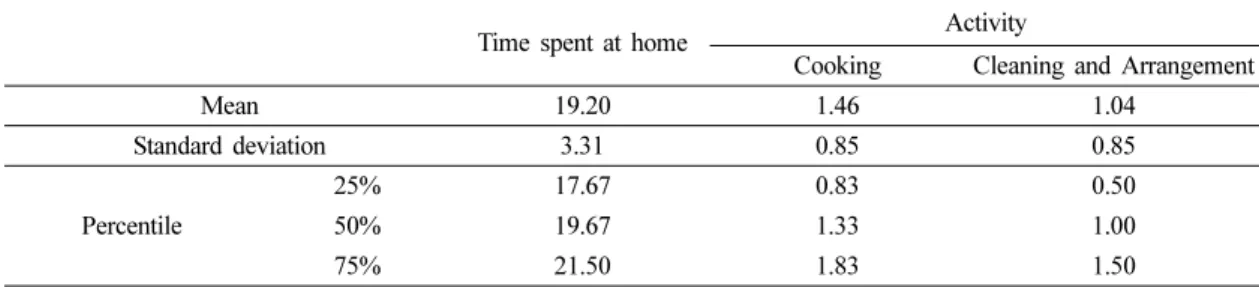
Methods: The time activity patterns of homemakers were analyzed based on the ‘Time-Use Survey’ data of the National Statistical Office in 2014. From September 30 to October 2, 2019, the experimenter lived in multi- family housing located in Guro-gu, Seoul. The I/O ratio of PM

2.5

concentration was measured by installing sensor-based instruments.

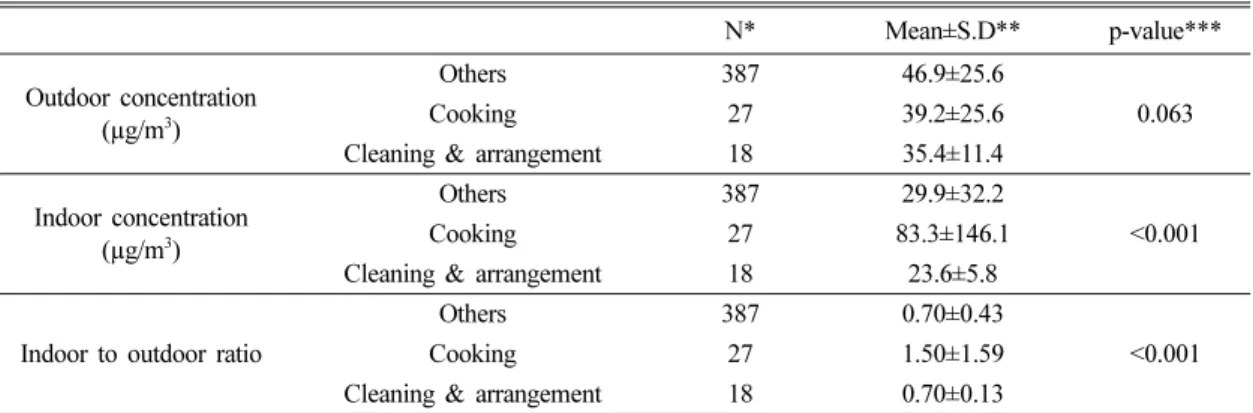
Results: The average indoor and outdoor PM

2.5

concentrations during the three days were 33.1±48.9 and 45.9±25.3 μg/m
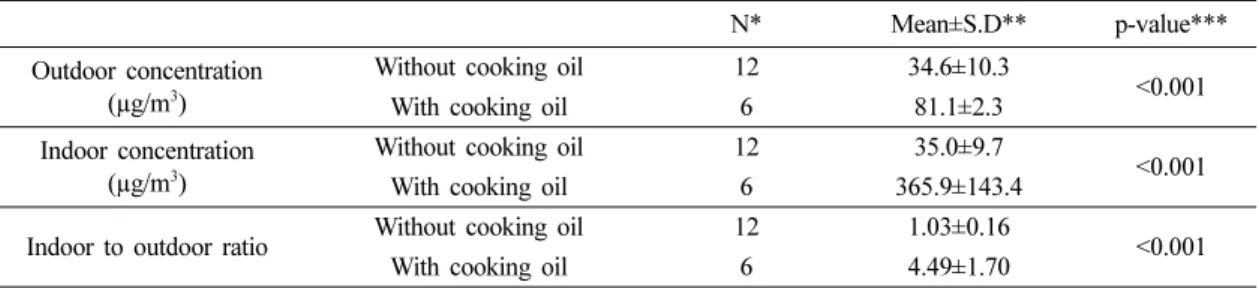
3

, respectively. The average I/O ratio was 0.75±0.60. The indoor concentration tended to increase

Corresponding author: Department of Occupational Health, Daegu Catholic University, Hayang-ro 13-13, Hayang- eup, Gyeongsan-si, Gyeongbuk 38430, Rep. of Korea, Tel: +82-53-850-3739, E-mail: [email protected]

Received: 15 September 2020, Revised: 12 October 2020, Accepted: 13 October 2020

원 저 Original articles

(2)

when PM

2.5

source activity such cooking and cleaning was present and outdoor PM

2.5

was supplied through ventilation.

Conclusions: This study could be used as basic data for estimating indoor PM

2.5

concentrations with personal activity pattern and weather conditions using outdoor concentrations.

Key words: Fine particulate matter, indoor air quality, indoor to outdoor ratio, time-activity pattern

I. 서 론

공기오염물질로 인한 건강영향을 고려할 때 사람 들은 실내환경에서 대부분의 시간을 보내기 때문에 노출평가 측면에서 실내공기질의 중요성이 증가하고 있다. 적절히 환기가 이루어지지 않은 공간 내에서 오염된 공기가 내부순환하게 되면 공기오염물질의 농도가 상승할 수 있어 실내공기는 실외 대기오염보 다 더 큰 문제를 유발할 수 있다.

1)

주요 실내 오염 물질로는 미세먼지, 이산화탄소, 일산화탄소, 이산화 질소, 중금속, 석면, 휘발성 유기화합물, 라돈 등이 있다.

초미세먼지(PM

2.5

) 는 국제 암 연구소(International Agency for Research on Cancer)에서 1급 발암물질 로 분류하였으며, 암을 비롯하여 다양한 건강 악영향 을 일으키는 공기오염물질이다.

2)

세계보건기구(World Health Organization, WHO) 와 Di 등은 PM

2.5

의 농도 가 10 µg/m

3

상승할 때마다 심폐질환으로 인한 사망 률의 위해도가 6~13% 증가한다고 발표하였다.

3,4)

주택의 실내환경은 조리 등으로 인한 연료의 연소 가 주요한 PM

2.5

의 발생원이며, 청소로 인한 침적먼 지의 비산도 주요한 발생원으로 알려져 있다.

5)

따라 서 주택에서의 PM

2.5

농도는 재실자의 행위의 영향 을 받을 수 있다. 사람은 1일 중 대략 60% 이상의 시간을 집에서 보내기 때문에 주택에서의 PM

2.5

노 출은 재실시간과 재실 동안 행위를 나타내는 시간활 동양상에 큰 영향을 받을 수 있다.

6-8)

주택을 포함한 실내환경 공기오염물질의 농도는 실외 공기오염물질의 농도와 환기를 통한 실외공기 질의 영향을 받기 때문에 농도 변화가 높을 수 있

다.

9,10)

주택에서의 PM

2.5

노출은 보건학적 관점에서

중요한 실내환경지만, 주택은 개인적인 공간(private space)이기 때문에 PM

2.5

농도 측정의 접근성이 낮 아 주택에서의 노출평가는 쉽지 않은 실정이다. 측 정이 어려운 실내환경에 대한 공기오염물질의 농도 는 실외 공기오염물질의 농도를 기반으로 통계적 방 법 또는 물질수지 모델을 통해 추정할 수 있다.

11,12)

이 중 비교적 간단한 방법은 실내 공기오염물질 농 도를 실외 공기오염물질로 나눈 비인 실내·실외 농 도비(indoor to outdoor concentration ratio, I/O ratio) 를 적용하는 것이다.

13,14)

본 연구의 목적은 우리나라 일반 주택에서 PM

2.5

농도에 영향을 미치는 표준화된 시간활동양상을 실 제 모의(active simulation)하여 행위에 따른 시간대 별 I/O ratio를 평가하는 것이다. 이 결과는 역학연 구 및 위해성평가에서 주택 실내환경의 PM

2.5

농도 를 실내·실외 PM

2.5

농도비를 적용하여 재실시간과 함께 노출평가를 수행할 때 이용될 수 있다.

II. 연구 방법 1. 시간활동양상

주택에서 PM

2.5

발생과 관련된 조리 및 청소 등을 포함한 전업주부의 시간활동양상은 통계청의 2014 년 생활시간조사 결과를 활용하여 분석하였다.

15)

총 32,427 개의 평일 데이터 중 서울시에 거주하고, 조 사 당시 근무 또는 수학 중이지 않으며, ‘일을 하지 않은 주된 이유’는 ‘자녀보육’ 또는 ‘가사’를 선택한 19~64 세의 기혼 또는 이혼 상태의 여성 397명의 데 이터를 추출하였다.

통계청의 생활시간조사에서 행위분류 코드 중 PM

2.5

발생에 영향을 미치는 음식준비(D1)와 청소 및 정 리(D3)를 선정하였다.

16,17)

음식준비는 식사준비(D120) 와 간식·비일상적 음식만들기(D140)를 대상으로 하 였으며, 조리에 해당하지 않는 설거지·식후정리(D160) 및 음식 관련 서비스 받기(D180)는 제외하였다. 또 한 청소 및 정리의 경우 쓰레기 버리기(D360)를 제 외한 청소(D320)와 정리(D340)만을 분석하였다.

시간활동양상 분석결과와 동일한 시간 동안 음식

준비와 청소 및 정돈을 재현하였으며(active simulation),

음식준비의 특성에 따른 차이를 확인하기 위하여 첫

날에는 식용유를 이용한 음식준비(군만두), 둘째날과

셋째 날에는 동일한 시간 동안 식용유를 사용하지

(3)

않는 토스트와 라면 등을 조리하였다. 음식준비 시 에는 모두 가스렌지(gas range)를 이용하여 조리하 였다. 또한 실험 셋째 날에는 강우로 인하여 실외 PM

2.5

농도가 감소하여 비가 오지 않은 날과의 I/O ratio를 비교하였다(Table 1).

2. 주택 실내ㆍ실외 PM

2.5

농도비

2019 년 9월 30일부터 10월 2일까지 실험자는 서 울시 구로구에 위치한 공동주택에서 생활하였다.

PM

2.5

농도의 I/O ratio는 공동주택의 실내 및 실외 에 MicroPEM (RTI International, NC, USA)을 각 1대씩 설치하여 측정하였다. 실외는 베란다의 개방 된 창문 앞에 설치하였고, 실내는 거실에 설치하였 다. MicroPEM은 광산란법을 이용한 실시간 모니터 링과 중량법을 이용한 측정이 동시에 가능하며, 광 산란법으로 측정한 값을 중량법으로 측정한 값으로 보정하여 측정의 정확성을 높일 수 있게 하는 PM

2.5

모니터링 장비이다.

18)

MicroPEM은 0.5 L/min의 유 량으로 72시간 동안 연속으로 측정하였으며, PM

2.5

농도는 10초 간격으로 수집되었고, 측정한 PM

2.5

농 도는 시간활동양상과의 비교를 위하여 10분 간격으 로 평균하였다.

시간에 따른 PM

2.5

의 I/O 농도비 변화를 파악하기 위하여 I/O ratio를 시간별 평균으로 분석하였으며, 실내의 PM

2.5

농도에 영향을 줄 수 있는 전업주부의 행위와 실외 PM

2.5

농도에 영향을 줄 수 있는 강수 등의 조건에 따라 일원배치 분산분석(one-way analysis of variance, ANOVA) 을 수행하였다. 모든 통계적 분 석은 SPSS (ver. 19)를 이용하였다.

III. 연구 결과 1. 시간활동양상

서울시 전업주부 397명의 시간활동양상을 분석하 여 전업주부의 시간대별 집에서의 재실율과 하루 중 음식준비와 청소 및 정리의 각 시간별 비율을 Fig.

1 에 나타내었다. 전업주부의 1일 중 집 재실율은 1:00 부터 4:30까지 99.0%로 가장 높았으며, 8:30부터 Table 1. Activity and condition in relation to cooking during active simulation period

Day Cooking type Cleaning and arrangement Weather

1

st

With cooking oil With vacuum Sunny

2

nd

Without cooking oil With vacuum Sunny

3

rd

Without cooking oil With vacuum Rain

Fig. 1. The percentage of time spent at home, and rate of activity of cooking, cleaning and arrangement of housewives

(4)

90.0% 미만으로 감소하기 시작하였고, 14:00에 47.4%

로 최저였다. 음식준비는 오전 6:30부터 7:40까지와

오후 5:00부터 6:50까지 집중되어 있었으며, 청소 및 정리는 오전 9:00부터 10:50까지 집중되었다. 전업 Table 2. Time spent in house and activity of cooking, cleaning and arrangement of housewives (hour)

Time spent at home Activity

Cooking Cleaning and Arrangement

Mean 19.20 1.46 1.04

Standard deviation 3.31 0.85 0.85

Percentile

25% 17.67 0.83 0.50

50% 19.67 1.33 1.00

75% 21.50 1.83 1.50

Table 3. Hourly variation of indoor to outdoor PM

2.5

concentration ratio by the time of day

Time 1

st

day 2

nd

day 3

rd

day

Average

I/O ratio Event I/O ratio Event I/O ratio Event

0:00 0.42±0.04 0.54±0.07 0.46±0.04 0.48±0.07

1:00 0.35±0.02 0.43±0.03 0.41±0.02 0.40±0.04

2:00 0.34±0.01 0.43±0.03 0.39±0.05 0.39±0.05

3:00 0.32±0.02 0.51±0.06 0.32±0.05 0.38±0.10

4:00 0.35±0.04 0.51±0.02 0.34±0.02 0.40±0.09

5:00 0.35±0.04 0.57±0.01 0.32±0.01 0.41±0.12

6:00 0.33±0.02 0.60±0.01 0.35±0.01 D1: 6:30~6:39 0.43±0.13

7:00 0.45±0.08 0.66±0.06 D1:7:40~7:49 0.48±0.10 0.53±0.12

8:00 0.73±0.30 D1:8:30~8:59 0.69±0.04 0.55±0.06 0.66±0.18

9:00 0.75±0.15 D3: 9:30~9:49 0.73±0.04 D3: 9:30~9:49 0.65±0.04 D3: 9:30~9:49 0.71±0.10 10:00 0.51±0.02 D3: 10:10~10:49 0.79±0.03 D3: 10:10~10:49 0.80±0.06 D3: 10:10~10:49 0.70±0.15

11:00 0.59±0.13 0.75±0.04 0.85±0.04 0.73±0.14

12:00 0.60±0.07 0.78±0.06 0.82±0.03 0.74±0.11

13:00 0.65±0.08 1.10±0.14 0.82±0.07 0.86±0.21

14:00 0.66±0.04 0.92±0.05 0.74±0.08 0.77±0.13

15:00 0.60±0.09 0.93±0.04 0.75±0.08 0.76±0.16

16:00 0.88±0.67 D1 with cooking oil: 16:50~17:49

1.08±0.08

D1: 16:30~17:49 0.69±0.10

D1: 16:40~17:59 0.88±0.41

17:00 4.65±1.46 1.02±0.17 0.84±0.07 2.17±1.98

18:00 2.26±0.49 0.63±0.09 0.91±0.06 1.27±0.78

19:00 1.14±0.21 0.42±0.03 0.99±0.05 0.85±0.34

20:00 0.73±0.09 0.51±0.03 1.15±0.03 0.79±0.28

21:00 0.64±0.04 0.62±0.06 1.23±0.09 0.83±0.30

22:00 0.55±0.02 0.66±0.03 1.34±0.24 0.85±0.38

23:00 0.64±0.04 0.51±0.06 1.69±0.18 0.94±0.55

Total 0.81±0.95 0.68±0.21 0.75±0.36 0.75±0.60

I/O ratio: indoor to outdoor ratio D1: cooking

D3: cleaning and arrangement

(5)

주부가 1일 평균 집에서 보낸 시간은 19.20±3.31 hr 이었으며, 음식준비와 청소 및 정리 시간은 각 1.46±0.85 hr와 1.04±0.85 hr이었다(Table 2).

2. PM

2.5

의 실내·실외 농도비

Table 3 에는 실험 3일 동안의 시간대별 PM

2.5

의 I/

O ratio 를 제시하였으며, Table 4에는 날짜별 평균 실내 및 실외농도와 I/O ratio를 나타내었다. 3일간 의 전체 평균 실내 및 실외 PM

2.5

농도는 각각 33.1±48.9, 45.9±25.3 µg/m

3

이었으며, 평균 I/O ratio 는 0.75±0.60이었다.

시간에 따른 PM

2.5

의 실내 및 실외농도, I/O ratio 와 전업주부의 시간별 행위 및 강수 시간을 Fig. 2 에 나타내었다. 음식준비 시에 I/O ratio의 농도가 상 승(peak)하는 것이 관측되었으며, 식용유를 이용한 조리 시에는 더욱 크게 상승하였다. 실험 3일 차 오

전 9시부터 강수가 시작됨에 따라 실외 PM

2.5

농도 가 감소하였으며, I/O ratio는 증가하였다.

PM

2.5

의 실내 및 실외의 회귀분석 결과를 Fig. 3에 나타내었다. 날짜에 따른 결정계수(R

2

) 는 첫째날부터 0.160, 0.579, 0.782 순으로 나타났으며, 3일 전체 비 교 결과 R

2

값은 0.170으로 나타내었다.

전업주부의 행위에 따른 PM

2.5

의 실내·실외 농도 및 I/O ratio의 평균 및 ANOVA 분석 결과를 Table 5 에 나타내었다. 10분 간격으로 분류된 3일간의 실 험 기간 중(n=432) 음식준비와 청소 및 정리는 각 270 분과 180분이었으며, 행위에 따른 실외 농도의 차이는 통계적으로 유의하지 않았으나(p=0.063) 실 내 농도 및 I/O ratio는 모두 통계적으로 유의한 차 이를 나타내었다(p<0.001).

조리 시 식용유 사용 여부에 따른 I/O ratio 분석 결과를 확인하기 위하여 식용유를 사용한 첫째 날 저녁 음식준비와, 사용하지 않은 첫째날 아침, 둘째 날 점심, 그리고 저녁 식사 준비로 나누어 차이를 비교하였다(Table 6). 셋째 날은 강수로 인하여 I/O ratio에 영향을 받을 수 있기 때문에 제외하였다.

ANOVA 분석결과 식용유 여부에 따른 실내·실외 농도 및 I/O ratio 모두 통계적으로 유의한 차이가 있었다(p<0.001).

Table 7은 강수에 따른 실내·실외 농도 및 I/O ratio 를 제시하였다. 측정 셋째날 오전 9시부터 비가 Table 4. Indoor and outdoor concentration and indoor to

outdoor PM2.5 concentration ratio

Day Concentration (µg/m

3

) Indoor to outdoor ratio Indoor Outdoor

1

st

54.0±79.6 60.3±21.6 0.81±0.95 2

nd

29.9±8.3 48.6±22.8 0.68±0.21 3

rd

15.2±5.9 28.9±20.9 0.75±0.36 Total 33.1±48.9 45.9±25.3 0.75±0.60

Fig. 2. Indoor and outdoor concentration and indoor to outdoor ratio of PM2.5 over time

(6)

왔으며, 둘째날 오전 9시부터 자정까지와, 셋째날 오 전 9시부터 자정까지를 비교하였다. ANOVA 분석

결과 강수 여부에 따른 실내·실외 농도 및 I/O ratio 모두 통계적으로 유의한 차이가 있었다(p<0.001).

Fig. 3. Regression analysis between indoor and outdoor PM

2.5

concentrations

Table 5. Variation of air concentrations and indoor to outdoor ratio according to the activity of housewives

N* Mean±S.D** p-value***

Outdoor concentration (µg/m

3

)

Others 387 46.9±25.6

0.063

Cooking 27 39.2±25.6

Cleaning & arrangement 18 35.4±11.4 Indoor concentration

(µg/m

3

)

Others 387 29.9±32.2

<0.001

Cooking 27 83.3±146.1

Cleaning & arrangement 18 23.6±5.8

Indoor to outdoor ratio

Others 387 0.70±0.43

<0.001

Cooking 27 1.50±1.59

Cleaning & arrangement 18 0.70±0.13

*Number of sample (10 min)

**Standard deviation

***One-way analysis of variance

(7)

IV. 고 찰

전업주부의 시간활동양상 분석 결과, 하루 약 80%

(19.20±3.31 hr)를 주택에서 보내는 것으로 나타났다.

이것은 Lee 등(2014)이 전업주부를 대상으로 시간활 동양상을 연구한 결과인 19.15±3.31 hr와 유사하였 다.

19)

전업주부는 집에서 보내는 시간이 다른 인구 집단에 비해 상대적으로 많으며, 음식준비 등으로 인 해 발생하는 PM

2.5

에 직접적으로 노출될 수 있기 때 문에 집에서의 PM

2.5

노출에 따른 건강영향이 높을 수 있다.

20)

일반적으로 실내 발생원이 없는 건물에서의 PM

2.5

의 I/O ratio는 1 미만이지만, 본 연구결과에서 PM

2.5

농도의 평균 I/O ratio는 0.75±0.60로 나타났다.

21)

국 립환경과학원에서 150개의 단독주택과 226개의 다 세대/연립주택을 대상으로 PM

2.5

의 I/O ratio는 0.7로 나타나 본 연구의 결과와 유사하였다.

22)

반면, 환경 부 보고서에 따르면 일반 주택에 비하여 실내 인구 밀집도가 높은 어린이집, 노인요양시설, 지하역사, 지

하상가, 실내 주차장 등의 다중이용시설의 PM

2.5

의 I/O ratio 는 지하상가를 제외하고 모두 1 이상으로 나타났다.

23)

중국의 경우 주택에서 측정한 PM

2.5

의 평균 I/O ratio는 0.73±0.54로 본 연구와 유사하게 나타났다.

24)

Massey 등(2009)이 인도에서 6개월간 도시지역에서 측정한 I/O ratio는 평균 0.92로 본 연 구보다 높게 나타났으나, 이것은 실내 흡연이 기여 한 것으로 판단된다.

25)

날짜별 PM

2.5

의 I/O ratio는 둘째날, 셋째날, 첫째날 순으로 나타났는데, 둘째날의 경우 일반 주택 등에 서의 선행연구와 유사하게 나타났으며, 강수로 인해 실외 PM

2.5

농도가 감소하였던 셋째날과 식용유를 이 용한 조리로 인해 실내 PM

2.5

농도가 증가하였던 첫 째 날에는 I/O ratio가 상승하는 것이 관측되었다.

Lee 등(2001)이 식당의 실내 PM

2.5

농도를 측정한 결 과, 조리하는 음식의 종류에 따라 실내 PM

2.5

농도에 차이가 있는 것이 확인되었다.

26)

실내 PM

2.5

농도 추 정 시, 음식준비 등의 재실자의 행위뿐만 아니라 조 리의 종류 또한 중요한 요인이 될 것으로 판단된다.

Table 6. Variation of air concentrations and indoor to outdoor ratio by usage of oil during cooking

N* Mean±S.D** p-value***

Outdoor concentration (µg/m

3

)

Without cooking oil 12 34.6±10.3

<0.001

With cooking oil 6 81.1±2.3

Indoor concentration (µg/m

3

)

Without cooking oil 12 35.0±9.7

<0.001

With cooking oil 6 365.9±143.4

Indoor to outdoor ratio Without cooking oil 12 1.03±0.16

<0.001

With cooking oil 6 4.49±1.70

*Number of sample (10 min)

**Standard deviation

***One-way analysis of variance

Table 7. Variation of air concentrations and indoor to outdoor ratio by weather condition

N* Mean±S.D** p-value***

Outdoor concentration (µg/m

3

)

Sunny day 90 38.1±11.2

<0.001

Rainy day 90 13.6±6.3

Indoor concentration (µg/m

3

)

Sunny day 90 27.2±4.8

<0.001

Rainy day 90 11.5±3.3

Indoor to outdoor ratio Sunny day 90 0.76±0.22

<0.001

Rainy day 90 0.95±0.29

*Number of sample (10 min)

**Standard deviation

***One-way analysis of variance

(8)

실내와 실외 PM

2.5

농도의 회귀분석 결과에서 강 력한 실내 발생원인 식용유를 이용한 조리가 없었던 둘째날과 셋째날에는 각 0.579와 0.782로 나타났으 며, 실내 PM

2.5

농도가 높을 때 실내 및 실외의 PM

2.5

농도의 관계가 낮은 것으로 나타났다. 따라서, 실내 PM

2.5

농도는 I/O ratio를 이용하여 실내 농도의 추 정이 가능하지만, 강력한 실내발생원이 있으면 실내 농도 추정에 한계가 있음을 알 수 있다.

행위에 따른 PM

2.5

의 실내 및 실외농도와 I/O ratio 분석 결과 실외농도는 통계적으로 유의한 차이가 없 었던 반면, I/O ratio는 유의한 차이가 있음을 나타 내어 실내 활동이 I/O ratio에 영향을 미친 것을 확 인할 수 있었다. 기존 보고서에 따르면 PM

2.5

농도의 I/O ratio 가 1.2를 초과할 경우 발생원이 실내에 있 음을 알 수 있는데, 본 연구에서 음식준비 시의 I/O ratio 는 1.50±1.59로 해당 연구결과와 일치하였다.

27)

따라서I/O ratio를 이용한 실내농도 추정 시에는 재 실자의 행위에 대한 정보가 요구되며, 이를 고려할 필요가 있을 것으로 판단된다.

음식준비 시에 식용유 여부에 따른 PM

2.5

농도의 I/O ratio 의 차이가 관측되었다. 이것은 조리 시에 발 생하는 PM

2.5

로 인해 실내농도가 급격하게 상승하였 기 때문으로 판단된다, 따라서 주택에서 오랜 시간 을 보내며, PM

2.5

에 직접적으로 노출되는 전업주부 에 대하여 노출관리가 필요할 것으로 판단된다.

28)

본 연구는 비교적 짧은 기간 동안 실내외 PM

2.5

농도를 실시간으로 연속 측정하여 I/O ratio를 1시간 단위로 산출함으로써 대표성이 낮다는 한계점이 존 재할 수 있다. 그러나 통계청의 전업주부를 대상으 로 시간활동과 행위의 표준값을 모의실험하여 시간 대별 농도 변이 및 I/O ratio 값을 제시하였다. 추후 일반 주택을 대상으로 장기간 연속 측정이 요구되겠 지만, 개인공간의 주택 실내ㆍ외의 실시간 농도 측 정의 어려움을 고려할 때 실외 농도값을 이용하여 주택의 실내 농도를 추정할 수 있는 방안을 제시하 였다는 것에 의의가 있다. 또한 향후 실내에서 PM

2.5

농도를 급격하게 상승시킬 수 있는 행위들에 대한 조사가 필요하다.

V. 결 론

본 연구에서는 주택에서의 재실자의 행위 및 기상

조건에 따른 PM

2.5

농도의 시간대별 I/O ratio를 산 출하고자 하였다. 3일간 서울시 전업주부의 대표적 인 시간활동양상을 재현하며 주택에서 1시간 단위의 PM

2.5

농도 I/O ratio를 평가하였다. 측정 3일 동안 전체 평균 실내 및 실외 PM

2.5

농도는 각각 33.1±48.9, 45.9±25.3 µg/m

3

이었으며, 평균 PM

2.5

농도 I/O ratio 는 0.75±0.60이었다. 조리 및 청소 등으로 실내 PM

2.5

발생원이 존재할 때, 그리고 실외 PM

2.5

이 환기를 통 해 유입될 때 실내농도가 증가하는 경향을 보였다.

본 연구의 결과는 시간대별 실외 PM

2.5

농도값을 이 용하여 주택실내의 PM

2.5

농도를 추정할 때 이용할 수 있으며, 역학연구 및 위해성평가에서 인구집단의 PM

2.5

노출평가시 주택실내의 농도 측정이 현실적으 로 어려울 때 이용할 수 있다.

감사의 글

본 연구는 환경부의 재원으로 한국환경산업기술원 의 생활공감환경보건기술사업의 지원을 받아 수행되 었습니다(과제번호: 2018001350001).

References

1. Choe Y, Heo J, Park J, Kim E, Ryu H, Kim DJ, et al. Evaluation of carbon dioxide concentrations and ventilation rates in elementary, middle, and high schools. J. Environ. Health Sci. 2020; 46(3): 344- 352.

2. International Agency for Reseach on Cancer (IARC). IARC Monographs Vol. 109: Outdoor air pollution. 2015 Available from https://www.iarc.fr/

wp-content/uploads/2018/07/pr221_E.pdf [accessed 11 October 2015].

3. World Health Organization. Health effects of partic- ulate matter. 2013. Available from http://www.euro.

who.int/__data/assets/pdf_file/0006/189051/Health- effects- of-particulate-matter-final-Eng.pdf [accessed 11 October 2015].

4. Di Q, Wang Y, Zanobetti A, Wang Y, Koutrakis P, Choirat C, et al. Air pollution and mortality in the Medicare population. New England Journal of Med- icine. 2017; 376: 2513-2522.

5. Nadali A, Arfaeinia H, Asadgol Z, Fahiminia M.

Indoor and outdoor concentration of PM

10

, PM

2.5

and PM

1

in residential building and evaluation of

negative air ions (NAIs) in indoor PM removal.

(9)

Environ Pollut Bio. 2020; 32(1): 47-55.

6. Yang W, Lee K, Park K, Yoon C, Son B, Jeon J, et al. Microenvironmental time activity patterns of weekday and weekend on Korean. Journal of Korean Society for Indoor Environment. 2009; 6(4):

267-274.

7. Hwang Y, Lee K, Contribution of microenviron- ments to personal exposures to PM

10

and PM

2.5

in summer and winter. Atmospheric Environment.

2018; 175: 192-198.

8. Burke J, Zufall M, Özkaynak H. A population exposure model for particulate matter: case study results for PM

2.5

in Philadelphia, PA. J Expo Anal Environ Epidemiol. 2001; 11: 470-489.

9. Leung D. Outdoor-indoor air pollution in urban environment: challenges and opportunity. Front.

Environ. Sci. 2015; 2: 1-7.

10. Diapouli E, Chaloulakou A, Koutrakis P. Estimat- ing the concentration of indoor particles of outdoor origin: a review. J. Air Waste Manag. Assoc. 2013;

63(10): 1113-1129.

11. Park J, Ryu H, Kim E, Choe Y, Heo J, Lee J, et al.

Assessment of PM

2.5

population exposure of a com- munity using sensor- based air monitoring instru- ments and similar time-activity groups. Atmos.

Pollut. Res. In press

12. Yang W, Park J, Cho M, Lee C, Lee J, Lee C.

Environmental health surveillance system for a pop- ulation using advanced exposure assessment. Tox- ics. In press

13. Bo M, Salizzoni P, Clerico M, Buccolieri R.

Assessment of indoor-outdoor particulate matter air pollution: A review. Atmosphere. 2017; 8: 1-18.

14. Chen C, Zhao B. Review of relationship between indoor and outdoor particles: I/O ratio, infiltration factor and penetration factor. Atmospheric Environ- ment. 2011; 45: 275-288.

15. Statistics Korea. Time-Use Survey. 2014.

16. Huang Y, Chen H, Han B, Liu C, Chuang H, Lin L et al. Personal exposure to household particulate matter, household activities and heart rate variabil- ity among housewives. PLoS One. 2014; 9: 1-5.

17. Massey D, Kulshrestha A, Masih J, Taneja A. Sea- sonal trends of PM

10

, PM

5.0

, PM

2.5

& PM

1.0

in indoor and outdoor environments of residential homes located in North-Central India. Build. Envi- ron. 2012; 47: 223-231.

18. Cho S, Chartier R, Mortimer K, Dherani M, Tafa- tatha T. A personal particulate matter exposure monitor to support household air pollution expo- sure and health studies. 2016 IEEE Global Human-

itarian Technology Conference (GHTC), Seattle, WA, 2016; 817-818.

19. Lee H, Lee S, Lee B, Heo J, Kim S, Yang W. Esti- mation of personal exposure to air pollutants for housewives using time activity pattern and evaluat- ing air quality of microenvironments, Journal of Odor and Indoor Environment. 2014; 13(3): 159- 167.

20. Dou C, Zhang J, Qi C. Cooking oil fume-derived PM

2.5

induces apoptosis in A549 cells and MAPK/

NF-кB/STAT1 pathway activation. Environ. Sci.

Pollut. Res. 2018; 25: 9940-9948.

21. Kim H, Jung K. Seasonal Variations of Human Exposure to Residential Fine Particles (PM

2.5

) and Particle-Associated Polycyclic Aromatic Hydrocar- bons in Chuncheon. J. Environ. Toxicol. 2006;

21(1): 57-69.

22. National Institute of Environmental Research.

Indoor environment and noise research division environmental infrastructure research Department National Institute of Environmental Research. 2010.

23. Korean Ministry of Environment. Research for par- ticulate matter management plan for multi-use facil- ities. 2015.

24. Zou J, Ji W, Ben Y, Hassan MA, Fan W, Bates L, Dong Z. Using big data from air quality monitors to evaluate indoor PM

2.5

exposure in buildings: case study in Beijing. Environment Pollution. 2018; 240:

839-847.

25. Massey D, Julshrestha JM, Habil M, Taneja A.

Indoor/outdoor relationship of fine particles less than 25 μm (PM

2.5

) in residential homes locations in central Indian region. Building and Environment.

2009; 44: 2037-2045.

26. Lee S, Li W, Yin Chan L. Indoor air quality at restaurants with different styles of cooking in met- ropolitan Hong Kong. Sci. Total Environ. 2001;

279: 181-193.

27. Korean Environmental Industry & Technology Insti- tute. Exposure characteristics to particulate matter of children in urban susceptible buildings and facil- ities. 2019.

28. Huang Y, Chen H, Han B, Liu C, Chuang H, Lin L, et al. Personal exposure to household particulate matter, household activities and heart rate variabil- ity among housewives. Plos One. 2014; 9.

<저자정보>

박진현(연구원), 김은채(대학원생), 최영태(대학원생),

류현수(대학원생), 김순신(연구원), 우병렬(연구원),

조만수(교수), 양원호(교수)

수치

Fig. 1. The percentage of time spent at home, and rate of activity of cooking, cleaning and arrangement of housewives
Table 3. Hourly variation of indoor to outdoor PM 2.5  concentration ratio by the time of day
Fig. 2. Indoor and outdoor concentration and indoor to outdoor ratio of PM2.5 over time
Table 5. Variation of air concentrations and indoor to outdoor ratio according to the activity of housewives
+2

참조

관련 문서

The positive change pattern of CK-MB according to time on acute myocardiac infarction patient.. The positive change pattern of troponin-T according to time on

Component ratio and solid content of solution used in the duration time experiment by addition ratio of coco betain.. Component ratio and solid content of solution used

In paragraph 2, this study defined the concept, meaning, and educational significance of art education using play activity, defined games in creativity

Fresh samples were immediately tested for antioxidant activity, and antioxidant activity was compared according to gestational age and measured the difference

This study aims to suggest a basic data for the activation of aromatherapy pimple treatment program with the pimple skin care and treatment by testing the actual

• The reset time and the derivative time should increase as the ratio of time delay to dominant time constant increases. • The ratio between derivative time and reset time

(1) The Administrator shall by regulation prescribe (and from time to time revise) in accordance with the provisions of this section, standards applicable to the emission of

This study was conducted to identify key factor of sugar accumulation through analyzing the change in sugar concentration and activity of related