Sentinel-1 SAR 데이터를 이용한 우리나라 농지의 토양수분 산출 실험
이수진*, 홍성욱**, 조재일***, 이양원*†
*부경대학교 지구환경시스템과학부 공간정보공학전공, **세종대학교 환경에너지공간융합학과,
***전남대학교 응용식물학과
Experimental Retrieval of Soil Moisture for Cropland in South Korea Using Sentinel-1 SAR Data
Soo-Jin Lee*, Sungwook Hong**, Jaeil Cho*** and Yang-Won Lee*†
*Department of Spatial information Engineering, Pukyong National University
**Department of Environment, Energy, and Geoinfomatics, Sejong University
***Department of Applied Plant Science, Chonnam National University
Abstract : Soil moisture plays an important role to affect the Earth’s radiative energy balance and water cycle. In general, satellite observations are useful for estimating the soil moisture content. Passive microwave satellites have an advantage of direct sensitivity on surface soil moisture. However, their coarse spatial resolutions (10-36 km) are not suitable for regional-scale hydrological applications. Meanwhile, in-situ ground observations of point-based soil moisture content have the disadvantage of spatially discontinuous information. This paper presents an experimental soil moisture retrieval using Sentinel-1 SAR (Synthetic Aperture Radar) with 10m spatial resolution for cropland in South Korea. We developed a soil moisture retrieval algorithm based on the technique of linear regression and SVR (support vector regression) using the ground observations at five in-situ sites and Sentinel-1 SAR data from April to October in 2015-2017 period. Our results showed the polarization dependency on the different soil sensitivities at backscattered signals, but no polarization dependence on the accuracies. No particular seasonal characteristics of the soil moisture retrieval imply that soil moisture is generally more affected by hydro-meteorology and land surface characteristics than by phenological factors. At the narrower range of incidence angles, the relationship between the backscattered signal and soil moisture content was more distinct because the decreasing surface interference increased the retrieval accuracies under the condition of evenly distributed soil moisture (during the raining period or on the paddy field). We had an overall error estimate of RMSE (root mean square error) of approximately 6.5%. Our soil moisture retrieval algorithm will be improved if the effects of surface roughness, geomorphology, and soil properties would be considered in the future works.
Key Words : Soil Moisture, SAR, Sentinel-1, Backscatter
Received September 29, 2017; Revised October 16, 2017; Accepted November 28, 2017.
†Corresponding Author: Yang-Won Lee ([email protected])
This is an Open-Access article distributed under the terms of the Creative Commons Attribution Non-Commercial License (http://creativecommons. org/licenses/by-nc/3.0) which permits unrestricted non-commercial use, distribution, and reproduction in any medium, provided the original work is properly cited.
Korean Journal of Remote Sensing, Vol.33, No.6-1, 2017, pp.947~960
http://dx.doi.org/10.7780/kjrs.2017.33.6.1.4 ISSN 1225-6161 ( Print )
ISSN 2287-9307 (Online)
Article
1. 서 론
토양내의 수분함량은 현열과 잠열의 배분비율을 조 절하여 지구복사에너지 평형에 영향을 미치며, 강수의 유출과 침투량을 결정하여 물순환에 영향을 주는 중요 한 인자이므로, 수문학 연구에 있어서 토양수분의 함 량을 파악하는 것은 매우 중요하다(Falloon et al., 2011;
Zhang and Zhou, 2016). 위성원격탐사 분야에서는 토양 수분 함량의 산출에 있어 주로 마이크로파 센서를 이용 한다. 습윤한 토양은 건조한 토양보다 유전상수가 크게 나타나고 이에 따라 마이크로파의 세기가 증가하는데 (Dubois et al., 1995), 선행연구에서는 이러한 특성을 이 용하여 토양수분 함량을 산출하고 있다(Lakshmi, 2013;
Wagner et al., 2009; Morvan et al., 2008).
마이크로파 위성센서는 지면으로부터 자연적으로 방 출되는 마이크로파 에너지를 측정하는 수동형 센서와, 마이크로파를 송신한 후 지면으로부터 반사되는 전파 를 수신하여 그 에너지를 측정하는 능동형 센서로 나 뉜다. 수동형에서는 밝기온도 등을 이용하여, 그리고 능동형에서는 후방산란계수 등을 이용하여 토양의 유 전상수를 도출함으로써 토양수분을 산출한다. 현재 수 동형 센서로는SMOS(Soil Moisture and Ocean Salinity) 위 성의MIRAS(Microwave Imaging Radiometer with Aperture Synthesis), GCOM-W1(Global Change Observation Mission-
Water) 위성의 AMSR2(Advanced Microwave Scanning Radiometer 2), 그리고 SMAP(Soil Moisture Active Passive) 위성센서가10~36 km 해상도의 토양수분자료를 제공 하고 있다. 이러한 자료는 매일 전 지구를 커버하지만 저해상도이기 때문에 공간적 불확실성이 커서 국지규 모의 수문분석에 사용하기에는 어려움이 있다(Zhao and Li, 2013). 능동형 센서인 레이더(radar)는 송신 전파 의 주파수를 조절하여 짧고 강한 마이크로파를 이용할 수 있기 때문에 수동형 센서와는 달리 고해상도의 토양 수분 산출이 가능하다. SMAP 위성의 레이더는 3 km 해 상도의 토양수분자료도 함께 제공할 예정이었으나 기 계적인 결함으로2015년 발사 직후에 자료 제공이 중단 되었고, 이를 대체할 위성으로 ESA(European Space Agency)의 Sentinel-1이 주목받고 있다.
Sentinel-1은 2014년에 발사된 Sentinel-1A와 2016년에 발사된Sentinel-1B로 구성되며, 중심주파수가 5.405 GHz인 C밴드 SAR(Synthetic Aperture Radar)를 탑재하 고 있다. SAR는 후방산란된 신호들을 합성하여 방위각 방향의 해상도를 증가시킨 레이더 센서이다. Sentinel-1 은 송수신 방향을 기준으로VV(VerticalTransmit–Vertical Receive), VH(Vertical Transmit – Horizontal Receive), HH (Horizontal Transmit – Horizontal Receive), HV(Horizontal Transmit – Vertical Receive)의 4가지 편파 영상이 제공 되며, HH와 HV는 주로 극지방에서 사용된다. 시간 해 요약 : 토양수분은 지구복사에너지평형과 물순환에 영향을 미치는 중요한 인자이므로, 수문학 연구에 있 어서 토양수분의 함량을 파악하는 것은 매우 중요하다. 현재 수동형 마이크로파 위성의 토양수분 자료는 10~36 km의 저해상도로서 국지규모의 수문분석에 사용하기에는 어려움이 있다. 또한 현장관측 토양수분 자료는 지점 자료이므로 공간연속성을 보장하지 못하는 한계가 있다. 이에 본 연구에서는 Sentinel-1의 SAR(Synthetic Aperture Radar) 영상을 이용하여 우리나라 농지에서 10 m 해상도의 토양수분 산출 가능 성을 살펴보았다. 2015-2017년 4월부터 10월까지 5개의 토양수분 지상관측지점을 대상으로, Sentinel-1 후방산란을 이용하여 선형회귀와 SVR(support vector regression) 방법으로 토양수분 산출을 수행하였다.
편파에 따라 후방산란계수의 토양수분에 대한 민감도가 다르지만, 산출정확도는 VV 편파와 VH 편파가 유 사하였다. 토양수분은 식물계절학(phenology)보다는 수문기상과 지면특성에 보다 더 영향을 받기 때문에 토양수분 산출에 있어 특별한 계절성은 발견되지 않았다. 대체로 입사각이 작을수록 후방산란과 토양수분간 의 관계 패턴이 더 뚜렷하게 나타났으며, 또한 지면에 수분이 충분히 고르게 분포하는 경우 표면 간섭이 줄 어들어(시간적으로는 강수시, 공간적으로는 논에서) 산출정확도가 상대적으로 높게 나타났다. 전체적으로 RMSE(root mean square error) 6.5% 정도의 오차를 보였으나, 향후 지면 거칠기, 지형, 토성 등 다양한 지면 변수의 영향을 반영한다면 보다 더 정확도 높은 토양수분을 산출할 수 있을 것으로 사료된다.
상도는12일이고, 유럽 등 일부지역의 경우에는 6일마다 영상 취득이 가능하며, 영상취득 모드로는 SM(Stripmap), IW(Interferometric Wide Swath), EW(Extra-Wide Swath), WV(Wave)의 4가지가 있다. 그 중 육지를 촬영하는 IW 모드는 공간해상도가10 m인 영상을 제공하고 있는데, 상용위성에 버금가는 고해상도 위성영상이 촬영 후24 시간 이내에 인터넷을 통해 무료로 배포되어 실용가치 가 매우 높다. 이러한 Sentinel-1을 이용한 10 m 해상도 의 토양수분 자료는 국지규모의 수문분석에 매우 유용 할 것임에 틀림없지만, 현재 ESA에서는 공식적인 토양 수분 산출물을 제공하지 않는다.
지난 몇 년간Sentinel-1을 이용하여 토양수분을 산출 하기 위한 알고리듬이 개발되어 왔다. Paloscia et al.(2013) 과Alexakis et al.(2017)은 인공신경망을 이용하여 토양수 분을 산출하는 알고리듬을 제시하였고, Mattia et al.
(2015)는 SAR 영상의 시계열적인 변화를 이용하여 토양 수분을 산출하였으며, Hornacek(2012)는 건조 토양에서 의 후방산란을 기준으로 후방산란의 변화량을 이용하 여 토양내 수분함량을 추정하는TU Wien 모델(Wagner et al., 1999)을 이용하여 토양수분을 산출하였다. 이들은 주로 레이더 후방산란과 토양수분 간의 통계적인 관계 를 이용하였으며, 레이더 후방산란에 영향을 주는 센서 요소(편파, 입사각) 및 지면요소(토양수분, 식생, 거칠 기)(Ulaby et al., 1982)를 통계모형에 반영하기도 하였다.
또한 식생층에 의해 발생하는 산란이 토양수분 산출에 노이즈로 작용할 수 있는데, 이를 감쇠시키는 연구도 이 루어져 왔다(Prakash et al., 2012; Paloscia et al., 2013). 연구 지역에 있어서는 대부분 지면이 평탄한 나지, 초지, 농 지를 대상으로 하였다(Paloscia et al., 2013; Mattia et al., 2015; Alexakis et al., 2017; Gao et al., 2017).
그러나 우리나라의 경우, Sentinel-1 SAR를 이용한 토 양수분 산출에 관한 연구는 아직 보고된 바 없다. 또한 국외 사례들에서 후방산란과 토양수분의 통계적인 관 계를 이용하여 만들어진 경험적 모델은 특정 지역을 대 상으로 하여 수립되었기 때문에 우리나라에 그대로 적 용할 수는 없고, 우리나라 토양에 대한 Sentinel-1 SAR의 적용성 실험이 우선적으로 이루어져야 한다. 이에 본 연 구에서는 우리나라 농지를 대상으로Sentinel-1 SAR의 후방산란계수를 이용한 토양수분 산출 가능성을 타진 해보고자 한다. 일반적으로 SAR의 C밴드 전파는 울창
한 산림에서 캐노피를 투과하지 못하여(Li and Chen, 2005) 산림에서의 토양수분 산출은 매우 어렵기 때문에 농지를 연구지역으로 선정하였다. 2015-2017년 4월부터 10월까지의 우리나라 농지의 Sentinel-1 SAR 영상 및 농 촌진흥청의 토양수분 지상관측자료를 분석하였으며, 후방산란에 영향을 줄 수 있는 편파, 입사각, 강수이벤 트 등에 따른 후방산란과 토양수분의 관계 특성을 알아 보았다. 이때 선형회귀 및 SVR(support vector regression) 을 이용하여 후방산란계수로부터 토양수분을 산출하 고 정확도 비교를 수행하였다.
2. 자료와 방법
1) 연구지역
농촌진흥청 농업기상정보시스템(http://weather.rda.
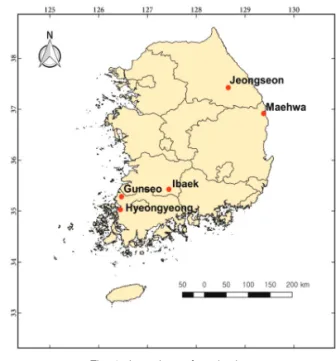
go.kr)의 토양수분 관측지점 192개를 환경부의 중분류 토지피복도와 중첩하여 농지에 해당하는 지점92개를 일차 선정하였다. 항공사진을 통해 이들 92개 지점을 육 안으로 확인해본 결과, TDR(Time Domain Reflectometry) 센서가 매립된 곳 인근에 건물, 도로 등이 혼재하는 경 우가 다수 발견되었다. 따라서 이들 중에서 지면 구성 의 이질성이 적고 주변이 대부분 농지로 이루어진 관측 지점5개를 선별하여 본 연구에 사용하였다(Fig. 1). 이
Fig. 1. Locations of study sites.
중 밭에 해당하는 지역은 울진군 매화면, 정선군 정선 읍, 무안군 현경면이고, 남원시 이백면과 영광군 군서면 은 논에 해당한다.
2) 사용 자료
연구 기간은2015-2017년의 4월부터 10월까지이며, 단2017년의 경우에는 4월과 5월의 자료가 사용되었다.
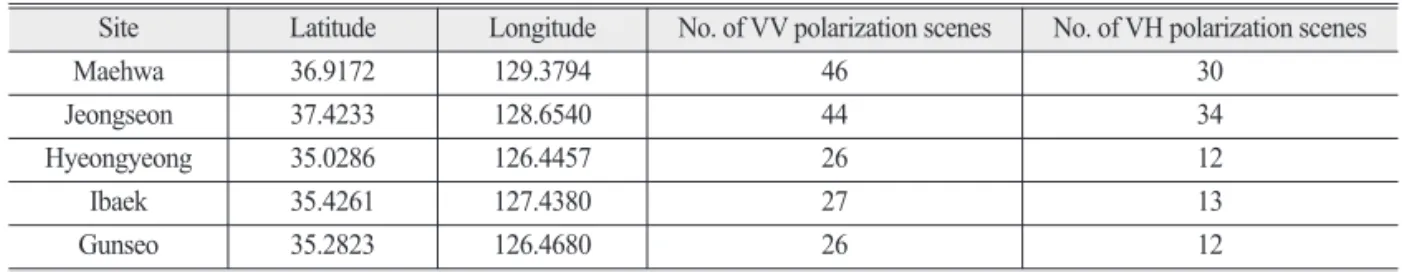
대체로 동절기에 해당하는11월부터 3월까지는 땅이 얼어있을 가능성이 존재하기 때문에 연구기간에서 제 외하였다. Sentinel-1A와 Sentinel-1B의 SAR 영상은 IW 모드의GRD(Ground Range Detected) 레벨1 자료를 사 용하였다. 육상의 IW 모드에서 GRD 레벨1 자료는 WGS84(World Geodetic System 1984) 투영법을 사용하여 지면 화소의 가로와 세로 길이가 동일하도록 구성되며 (Torres et al., 2012), 화소 간격은 10미터이다. 본 연구에 서는 극지방에 사용되는HH, HV를 제외하고 VV, VH 편파 자료를 사용하였는데, 일반적으로 송수신 방향이 동일한(co-polarization) VV 편파가 송수신 방향이 상이 한(cross-polarization) VH 편파에 비해 상대적으로 큰 후 방산란 값을 가진다. 따라서 편파방향에 따라 토양수분 에 대한 민감도가 달라질 수 있기 때문에(Baghdadi et al., 2007) 동일 지역이라도 편파별로 구분하여 분석할 필요 가 있다. 각 지점별로 수집된 Sentinel-1 영상의 개요는 Table 1과 같다. 아직 완전한 안정기는 아니기 때문에,
시기에 따라 단일편파(VV)와 이중편파(VV, VH) 자료 가 모두 제공되거나, 단일편파 자료만 제공되거나, 이중 편파 자료만 제공되는 등 자료제공의 불규칙성이 존재 하여, 본 연구에서 사용한 자료의 경우 단일편파와 이 중편파 모두에 해당하는VV 편파의 개수가 더 많다.
수집된 영상들은ESA에서 제공하는 Sentinel-1 자료 처리도구인SNAP(Sentinel Application Platform)을 이 용하여 전처리하였으며, 궤도 보정, 노이즈 제거, 방사 보정, 지형 보정이 수행되었다. 일반적으로 초기 자료 생성 시에는 정확한 궤도정보가 입력되지 않은 상태인 데, 궤도 보정을 통하여 정확한 위성의 위치 및 속도 정 보를 업데이트 할 수 있다. SAR 영상의 열잡음(thermal noise)이나 스펙클(speckle)은 SNAP의 열잡음 보정기능 과 공간필터링 기능에 의해 보정되었다. 방사 보정은 각 화소의 강도(intensity)로부터 후방산란계수를 산출 하기 위해서 수행되는 과정이며, 지형 보정에는 STRM (Shuttle Radar Topography Mission) DEM(digital elevation model)이 사용되었다. 입사각은 SAR 전파가 지면과 수 직인 축에 대해 이루는 각도로서, 지형보정을 거친 후 계 산된 연구지역의 입사각 정보는Table 2와 같다. Sentinel- 1의 상승경로와 하강경로는 각각 우리나라 상공을 3시 30분경과 15시 30분경에 통과하는데, 입사각은 궤도상 의 위성 위치와 관측지점의 위치 및 지형에 따라서 달라 Table 1. Summary of acquired SAR images for study sites
Site Latitude Longitude No. of VV polarization scenes No. of VH polarization scenes
Maehwa 36.9172 129.3794 46 30
Jeongseon 37.4233 128.6540 44 34
Hyeongyeong 35.0286 126.4457 26 12
Ibaek 35.4261 127.4380 27 13
Gunseo 35.2823 126.4680 26 12
Table 2. Incidence angles for study sites
Polarization VV polarization VH polarization
Track Ascending Descending Ascending Descending
Maehwa 45° 37° 42°, 43° 39°
Jeongseon 38° 34°, 44° 39° 33°, 44°
Hyeongyeong 35°, 36° 30°, 31°, 42°, 43° 37° 40°, 41°
Ibaek 38°, 39° 40° 40° 39°
Gunseo 34° 32°, 34° 33°, 34° 44°
Decimal points were omitted for the sake of convenience
진다. 이러한 일련의 보정처리를 거쳐 후방산란계수는 10*log(후방산란계수의 절대값)을 취하여 dB(decibels) 단위로 표현하였다.
농촌진흥청 농업기상정보시스템의 토양수분 관측 자료는 지면으로부터 약10 cm 깊이에 설치한 TDR 센 서를 통해 측정된 값이며, 단위는 토양 중 수분이 차지 하는 부피 또는 무게의 비율(%)로 표시된다. 이 자료는 1시간 단위로 제공되는 자료이므로, SAR 영상이 촬영된 로컬 시간대를 기준으로 가장 근접한 시간대의 자료를 선택하여 사용하였으며, 따라서 시간차이는 최대 30분 이다.
3) 분석방법
토양수분 관측소의 지점자료를Sentinel-1 화소에 대 응시키기 위하여, 각 지점이 포함되는 화소를 중심으로 3×3 윈도우를 설정하고 RGB 영상의 육안확인을 통해 9개 화소 중 가장 지면의 이질성이 적어보이는 1개 화 소를 선택하여 사용하였다. 후방산란계수와 토양수분 의 관계 특성을 알아보기 위하여 상관계수를 계산하고 민감도 분석을 수행하였다. 후방산란계수로부터 토양 수분을 산출하는 방법으로는 선형회귀 및SVR을 이용 하였다. 일반적으로 토양수분은 후방산란과 선형적 관 계를 가지기 때문에, 후방산란으로부터 토양수분을 산 출하는 방법으로 선형회귀 분석이 활용되고 있다 (Lakshmi, 2013; Wagner et al., 2009; Morvan et al., 2008).
SVR은 비선형성에 대응하기 위한 기계학습 기법의 일 종으로, 자료들을 유사성 기준으로 최적분류하고 분류 그룹별로 회귀식을 적용하는 것이다(Vapnik, 1998).
후방산란계수와 토양수분간의 관계 특성 및 토양수 분 산출 정확도의 특성을 알아보기 위해서 분석은5가 지로 수행하였다. 우선, 송수신 편파방향에 따라서 후방 산란의 강도와 토양수분에 대한 민감도가 다르게 나타 날 수 있기 때문에(Baghdadi et al., 2016), VV 편파와 VH 편파로 나누어 분석하였다. 두 번째로, 농작물 생장의 계절성이 후방산란과 토양수분 간의 관계 및 산출 정확 도에 영향을 미치는지 알아보기 위하여, 봄(4-5월), 여름 (6-8월), 가을(9-10월)로 나누어 분석하였다. 세 번째로, 지점별로 입사각의 분포에 따라 자료를 분류하여 분석 하였다. 일반적으로 입사각이 증가할수록 후방산란 강 도가 감소하는 경향이 있으므로(van Emmerik et al., 2015;
Tan et al., 2015) 입사각에 대한 후방산란의 민감도 특성 은 후방산란과 토양수분의 관계 및 토양수분 산출 정확 도에 영향을 미칠 수 있다. 네 번째로 강수시와 비강수 시의 토양수분 산출 정확도가 어떻게 달라지는지 분석 하였다. 강수 이벤트는 농촌진흥청 농업기상정보시스 템에서 토양수분과 함께 제공되는 강수량 정보를 참고 하였다. 마지막으로, 농지의 배수 특성이 토양수분의 산 출 정확도에 영향을 미치는지 알아보기 위하여 논과 밭 으로 구분하여 분석하였다. 논은 점토의 비율이 높고 벼 의 생장기 동안에 토양수분이 포화상태인 경우가 많으 며(Reshmidevi et al., 2008), 밭은 상대적으로 배수가 잘 이루어지는 경향이 있다.
4) 산출 정확도
선형회귀 및SVR을 이용하여 후방산란계수로부터 산출된 토양수분의 추정치와 관측된 토양수분간의 산 출 정확도를 알아보기 위해서, 추정치에서 관측치를 뺀 오차의 평균인 평균편의(Mean Bias), 오차 절대값의 평균 인MAE(Mean Absolute Error), 오차 제곱의 평균에 제곱 근을 취한RMSE(Root Mean Square Error)를 구하였다.
3. 결과 및 고찰
1) 편파별 토양수분 산출 특성
일반적으로 토양수분이 많을수록 지면으로부터 반 사되어 돌아오는 레이더의 후방산란 값이 크게 나타나 는데(Lu and Meyer, 2002; Kasischke et al., 2009), 이는 토 양의 유전상수가 수분이 많이 상태에서 높게 나타나고 그에 따라 마이크로파의 후방산란이 증가하는 특성을 가지기 때문이다(Dubois et al., 1995). 이러한 관계는 연 구지역의Sentinel-1 후방산란 자료와 농촌진흥청 토양 수분 자료 간의 관계에서도 확인할 수 있었다(Fig. 2).
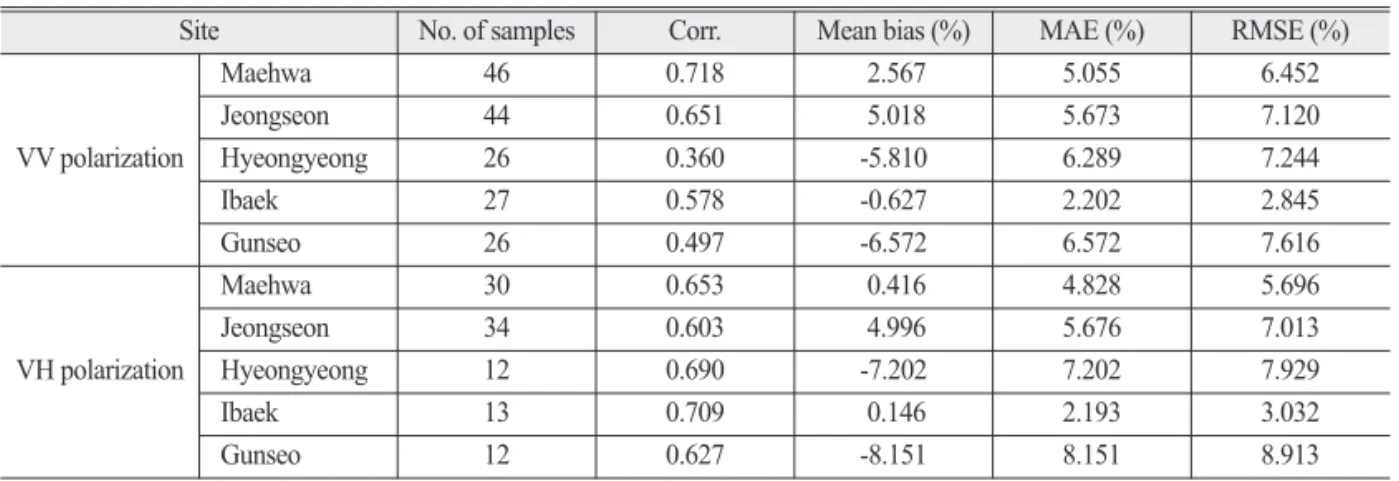
VV편파 169개와 VH편파 101개의 샘플에서 후방산란 계수와 토양수분 간의 상관계수는 각각r=0.422과 r=0.424이지만, 이를 각 지점별로 나누어 살펴보면 대 부분r>0.6으로서(Table 3), VV 편파의 경우 울진군 매 화면에서 가장 높은 상관성을 보였고(r=0.718), VH 편 파의 경우 남원시 이백면에서 가장 높은 상관성이 나타 났다(r=0.709). 후방산란과 토양수분의 상관성은 동일
한 지역에서도 편파에 따라 차이를 보이는데, 이는 송 수신 방향에 따라 신호 특성이 다르기 때문이다. VV 편 파는 송수신이 모두 수직 방향이지만, VH 편파는 수직 방향으로 송신하고 수평 방향으로 수신하여 에너지 손 실이 발생하기 때문에, VV 편파에 비해 전반적으로 후 방산란계수가 작은 값을 가진다(Chevalier, 2002). 이러 한 특성은Fig. 2에서도 나타난다. 결과적으로 편파에 따 라 후방산란계수의 토양수분에 대한 민감도가 다를 수 있기 때문에(Baghdadi et al., 2007), 편파별 상관계수의 차 이가 발생하는데, Fig. 2의 경향선 기울기에 해당하는 VV와 VH 편파 후방산란계수의 민감도는 각각 0.1379, 0.1532로 나타났다.
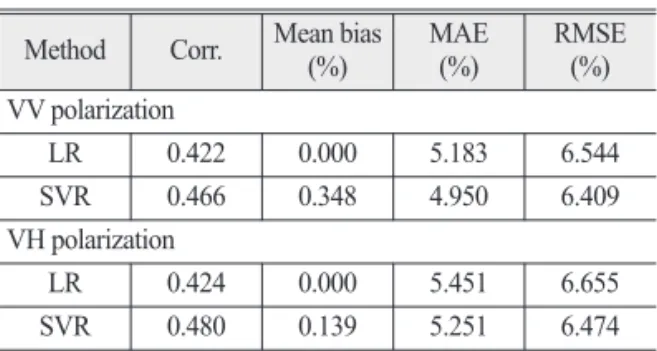
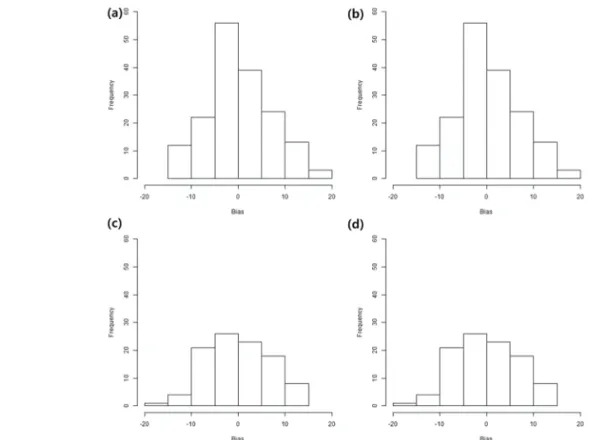
편파별 후방산란과 관측 토양수분의 관계 특성을 바 탕으로 선형회귀 및SVR을 이용하여 토양수분을 산출 하였으며, 산출된 토양수분의 정확도 통계는 Table 4와 같다. VV편파와 VH편파 모두 선형회귀에 비해 SVR의 MAE, RMSE, 상관계수가 다소 우수하게 나타났다. SVR 의 평균편의가 약0.14~0.35%로서 약간의 과대추정이 존재할 뿐이었으며, 두 방법 모두 RMSE 6.4~6.7% 내외 의 오차를 보였다. Fig. 3에서 볼 때, 편의의 분포는 선형
회귀와SVR의 산출 결과가 대체로 비슷한 것으로 나타 났으며, VH편파를 사용한 경우에는 샘플수가 작아 그 특징이 두드러지지 않지만, VV편파와 마찬가지로 대체 로-5~5% 사이의 편의가 존재하였다. 지역별로 볼 때, 남원시 이백면에서VV 편파와 VH 편파 모두 평균편의, MAE, RMSE가 가장 작게 나왔으며, 이는 선형회귀 (Table 5)와 SVR(Table 6)에서 마찬가지였다. Fig. 4에서 남원시 이백면은 논의 특성상 토양수분의 변화량이 크 지 않았으며, 1:1 선에 가장 가깝게 분포하는 것으로 나 타났다.
Fig. 5는 토양수분과 VV편파 후방산란계수의 상관성 이 가장 높게 나왔던 울진군 매화면에 대하여 토양수분 의 공간분포를 지도로 나타낸 것으로서, 매화면 VV편 파 자료46개를 이용하여 수립한 선형회귀식을 인근 농 지로 적용하여 그 추정치를 매핑하였다. Fig. 5의 항공 사진에 중첩하여 표시한 적색선은 환경부 토지피복도 에 밭으로 분류된 영역이지만, 육안으로 볼 때 일부 건 물이나 도로도 포함하고 있는 것으로 보이며, 따라서 피 Table 3. Correlations between in-situ soil moisture and VV/VH-
polarized backscattering coefficient for study sites Site VV polarization VH polarization
Maehwa 0.718 0.653
Jeongseon 0.651 0.603
Hyeongyeong 0.360 0.690
Ibaek 0.578 0.709
Gunseo 0.497 0.627
Fig. 2. Relationships between in-situ soil moisture and backscattering coefficient for (a) VV and (b) VH polarization.
Table 4. Accuracy statistics for soil moisture estimated by linear regression (LR) and support vector regression (SVR) methods
Method Corr. Mean bias
(%) MAE
(%) RMSE
(%) VV polarization
LR 0.422 0.000 5.183 6.544
SVR 0.466 0.348 4.950 6.409
VH polarization
LR 0.424 0.000 5.451 6.655
SVR 0.480 0.139 5.251 6.474
Fig. 4. Comparisons between in-situ and estimated soil moisture by linear regression (LR) and support vector regression (SVR) methods from VV/VH-polarized backscattering coefficient: (a) VV with LR (b) VV with SVR, (c) VH with LR, and (d) VH with SVR.
Fig. 3. Bias distribution of soil moisture estimated by linear regression (LR) and support vector regression (SVR) methods from VV/VH- polarized backscattering coefficient: (a) VV with LR (b) VV with SVR, (c) VH with LR, and (d) VH with SVR.
Table 5. Accuracy statistics of soil moisture estimated by linear regression (LR)
Site No. of samples Corr. Mean bias (%) MAE (%) RMSE (%) VV polarization
Maehwa 46 0.718 2.567 5.055 6.452
Jeongseon 44 0.651 5.018 5.673 7.120
Hyeongyeong 26 0.360 -5.810 6.289 7.244
Ibaek 27 0.578 -0.627 2.202 2.845
Gunseo 26 0.497 -6.572 6.572 7.616
VH polarization
Maehwa 30 0.653 0.416 4.828 5.696
Jeongseon 34 0.603 4.996 5.676 7.013
Hyeongyeong 12 0.690 -7.202 7.202 7.929
Ibaek 13 0.709 0.146 2.193 3.032
Gunseo 12 0.627 -8.151 8.151 8.913
Table 6. Accuracy statistics of soil moisture estimated by support vector regression (SVR)
Site No. of samples Corr. Mean bias (%) MAE (%) RMSE (%) VV polarization
Maehwa 46 0.703 2.382 4.624 6.035
Jeongseon 44 0.671 5.636 5.983 7.591
Hyeongyeong 26 0.398 -5.444 5.865 6.894
Ibaek 27 0.602 -0.164 1.870 2.717
Gunseo 26 0.486 -5.876 6.064 7.060
VH polarization
Maehwa 30 0.614 0.435 4.777 5.721
Jeongseon 34 0.658 5.078 5.578 6.906
Hyeongyeong 12 0.686 -6.327 6.327 7.233
Ibaek 13 0.708 -0.344 2.328 3.330
Gunseo 12 0.630 -7.600 7.600 8.454
Fig. 5. Spatial distribution of soil moisture estimated by linear regression from VV-polarized backscattering coefficient in Maehwa.
치 못하게 건물이나 도로 상에 표현된 토양수분 값은 유 의미하지 않은 것으로 간주할 수 있다. 이에 향후에는 보다 정밀한 토지피복도를 사용하여 공간분포를 매핑 할 필요가 있다. Fig. 5에서 2015년 5월 25일의 경우, 전 반적으로 토양수분이 매우 낮은 값을 보이고 있는데, 이 시기에 매화면을 비롯한 울진군의 가뭄이 매우 심각하 여 지역문제로 대두된 바 있다.
2) 계절별 토양수분 산출 특성
계절별 후방산란과 토양수분 간의 상관계수는VV 편파의 경우, 여름(=0.522), 가을(=0.482), 봄(=0.400) 순 으로 나타났으며, VH 편파는 봄(=0.537), 가을(=0.425), 여름(=0.358) 순으로 나타나, 특별한 경향성을 찾을 수 는 없었다(Table 7). 또한 월별로 산출된 토양수분의 정 확도에서 약간의 차이는 존재하지만 특징적인 패턴이 존재하지는 않았다(Table 8). 즉, 작물 생장주기 상의 계 절성이 후방산란의 민감도 및 후방산란과 토양수분과 의 상관성에 미치는 영향이 명확하지 않다고 볼 수 있 는데(Pratola et al., 2014), 이는 토양수분이 식물계절학 (phenology)보다는 여러 가지 수문기상요소(강수, 기온, 증발산 등)와 지면특성(지형, 거칠기, 토성 등)에 보다
더 영향을 받기 때문이며, 이러한 부분은 향후 연구를 통하여 보다 깊이 있게 다루어져야 할 것이다.
3) 입사각에 따른 후방산란계수와 토양수분간의 관계 특성
지점별로 차이가 있기는 하지만, VV 편파는 대체로 입사각이 작을 때(약 40° 미만) 상관계수가 높아지는 경 향을 보였다(Table 9). 일반적으로 입사각이 작을수록 후방산란 변화율이 줄어드는 특징이 있기 때문에 (Baghdadi et al., 2007), 작은 입사각 에서 후방산란과 토 양수분간의 관계 패턴이 더 뚜렷하게 나타날 가능성이 크다. 그러나 예외적으로 현경면과 이백면에서는 입사 각이40°도 이상인 경우에 상관계수가 더 높게 나타났 는데(Table 9), 이는 입사각과 같은 지오메트리 이외에 도 지형, 거칠기, 토성 등의 지면요소의 영향을 받기 때 문이다(Das and Paul, 2015; Pratola et al., 2014).
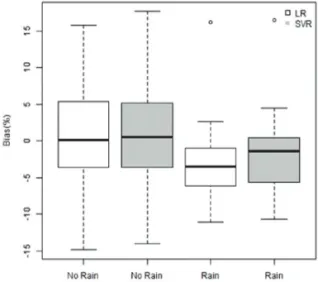
4) 강수이벤트에 따른 토양수분 산출 특성
강수이벤트에 따른 토양수분 산출 특성은VV 편파 자료들에 대하여 살펴보았다. 강수시의 정확도가 비강 수시보다 높게 나타났으며(Table 10, Fig. 6), 이는 강수 Table 7. Correlations between in-situ soil moisture and VV/VH-polarized backscattering coefficient by seasons: spring (Apr-May),
summer (Jun-Aug), and fall (Sep-Oct)
Polarization No. of samples Apr-Oct Apr-May Jun-Aug Sep-Oct
VV 169 0.422 0.400 0.522 0.482
VH 101 0.424 0.537 0.358 0.425
Table 8. Accuracy statistics for soil moisture estimated by linear regression (LR) and support vector regression (SVR) methods by seasons: spring (Apr-May), summer (Jun-Aug), and fall (Sep-Oct)
Method Month No. of samples Corr. Mean bias (%) MAE (%) RMSE (%) polarizationVV
LR
Apr-May 72 0.400 -1.332 5.534 7.032
Jun-Aug 53 0.522 2.315 5.240 6.774
Sep-Oct 44 0.482 -0.609 4.541 5.317
SVR Apr-May 72 0.452 -0.989 5.259 6.822
Jun-Aug 53 0.548 2.406 5.132 6.713
Sep-Oct 44 0.502 0.059 4.226 5.227
polarizationVH
LR Apr-May 45 0.537 -1.504 5.336 6.974
Jun-Aug 32 0.358 2.055 5.592 6.623
Sep-Oct 24 0.425 0.080 5.479 6.057
SVR
Apr-May 45 0.579 -0.997 5.177 6.781
Jun-Aug 32 0.426 2.002 5.311 6.415
Sep-Oct 24 0.507 -0.212 5.310 5.940
시와 같이 지면의 수분이 충분하면서 고르게 분포하는 경우, 표면 간섭이 줄어들어 안정적인 산출이 가능하기 때문으로 사료된다(Brocca et al., 2011). 평균편의는 비강 수시가0에 더 근접했으나 편의의 분포가 넓게 분산되 어 있는 반면, 강수시의 편의는 작은 음수의 값으로 한
정되는 경향을 보였다(Fig. 7).
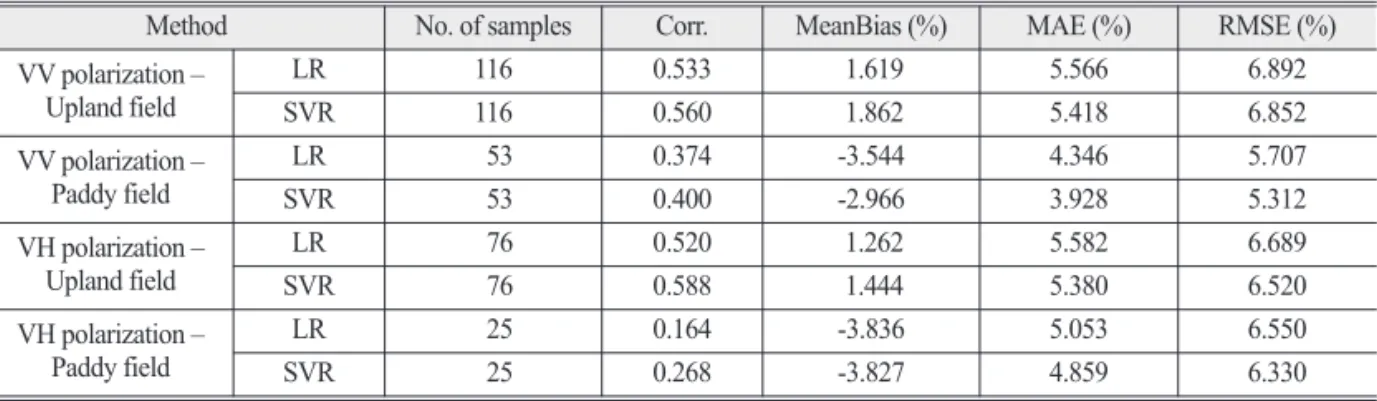
5) 논과 밭에 따른 토양수분 산출 특성
월별 토양수분의 분포도를 보면(Fig. 8) 논은 밭보다 대 체로 토양수분의 양이 많고 월별 변화가 크지 않는 반면, Table 9. Sensitivity of VV-polarized backscattering coefficient to in-situ soil moisture and correlation between VV-polarized
backscattering coefficient and in-situ soil moisture according to incidence angle
Site Incidence angle Sensitivity Corr. No. of samples
Maehwa 37° ≤ θ < 38° 0.160 0.825 29
45° ≤ θ < 46° 0.153 0.689 17
Jeongseon 34° ≤ θ < 39° 0.206 0.720 23
44° ≤ θ < 45° 0.233 0.695 21
Hyeongyeong 30° ≤ θ < 37° 0.143 0.257 17
42° ≤ θ < 44° 0.234 0.587 9
Ibaek 38° ≤ θ < 40° 0.204 0.525 16
40° ≤ θ < 41° 0.522 0.735 11
Gunseo 32° ≤ θ < 35° 0.197 0.552 17
44° ≤ θ < 45° 0.201 0.493 9
Table 10. Accuracy statistics for soil moisture estimated by linear regression (LR) and support vector regression (SVR) methods from VV-polarized backscattering coefficient according to the presence of rainfall event
Method No. of samples Corr. MeanBias (%) MAE (%) RMSE (%)
No rainfall LR 142 0.303 0.558 5.281 6.660
SVR 142 0.351 0.812 5.117 6.526
Rainfall LR 27 0.643 -2.936 4.670 5.894
SVR 27 0.561 -2.094 4.071 5.754
Fig. 6. Comparisons between in-situ and estimated soil moisture by linear regression from VV-polarized backscattering coefficient in terms of rainfall event.
Fig. 7. Bias distribution of soil moisture estimated by linear regression (LR) and support vector regression (SVR) methods from VV-polarized backscattering coefficient according to rainfall event.
밭의 경우에는 시계열적으로 토양수분 변동이 큰 것으 로 나타났다. 밭은 배수가 잘 되기 때문에 강수이벤트 및 관개에 따라 토양수분의 변화 가능성이 크지만, 논 은 배수가 잘 되는 구조가 아니기 때문이다. MAE와 RMSE는 밭보다 논에서 다소 좋게 나왔으나, 평균편의 를 볼 때 논의 경우 일정정도 과소추정 되었음을 알 수 있다(Table 11, Fig. 9). 논이 밭보다 오차가 적은 것은 강 수시와 마찬가지로, 지면의 수분이 충분하면서 고르게 분포하는 경우, 표면 간섭이 줄어들어 산출 정확도가 높 아질 가능성이 크다(Brocca et al., 2011).
4. 결 론
본 연구에서는Sentinel-1의 C밴드 SAR 영상을 이용 하여 우리나라 농지에서10 m 해상도의 토양수분 산출 가능성을 검토하였다. 2015-2016년 4월부터 10월, 2017 년4월부터 5월까지의 기간을 대상으로 5개의 토양수 분 관측지점에 대하여, Sentinel-1 후방산란을 이용하여
선형회귀와SVR의 방법으로 토양수분 산출을 수행하 였다. 산출 결과는 편파, 계절, 입사각, 강수이벤트, 논밭 에 따라 나누어 살펴보았으며, 전체적으로 RMSE 6.5%
정도의 오차를 보였다. 대체로 지면에 수분이 충분히 고 르게 분포하는 경우 표면 간섭이 줄어들어(시간적으로 는 강수시, 공간적으로는 논에서) 산출정확도가 상대적 으로 높게 나타났다. 향후 장기간의 Sentinel-1 자료가 구 축이 되고, 다양한 지면요소(지형, 토성, 거칠기 등)의 영향을 정교하게 반영한다면 보다 더 정확도 높은 토양 수분을 산출할 수 있을 것으로 사료된다.
저해상도의 마이크로파 자료와 포인트 기반의 현장 관측 자료의 한계를 극복하고, 향후 공간연속성을 가진 고해상도 토양수분 자료를 획득하기 위해서는Sentinel- 1의 적극적인 활용이 필요할 것이다. 본 연구는 국내에 서 그 첫 시도를 통하여Sentinel-1의 적용가능성을 확인 하였다는 데 의의가 있다. 또한 차세대 중형위성의 일 환으로 준비 중인C밴드 SAR의 기술개발을 위해서도 유사한 제원을 가진Sentinel-1의 활용이 매우 중요하다 고 할 수 있다. 무엇보다 토양수분 산출의 정확도 향상 Table 11. Accuracy statistics for soil moisture estimated by linear regression (LR) and support vector regression (SVR) methods
according to cropland type
Method No. of samples Corr. MeanBias (%) MAE (%) RMSE (%) VV polarization –
Upland field LR 116 0.533 1.619 5.566 6.892
SVR 116 0.560 1.862 5.418 6.852
VV polarization –
Paddy field LR 53 0.374 -3.544 4.346 5.707
SVR 53 0.400 -2.966 3.928 5.312
VH polarization –
Upland field LR 76 0.520 1.262 5.582 6.689
SVR 76 0.588 1.444 5.380 6.520
VH polarization –
Paddy field LR 25 0.164 -3.836 5.053 6.550
SVR 25 0.268 -3.827 4.859 6.330
Fig. 8. Monthly in-situ soil moisture distribution in (a) upland field and (b) paddy field.
을 위하여 물리과정기반 모델, 통계기반 모델, 인공지능 등의 다양한 방법론(Nichols et al., 2011; Das and Paul, 2015)에 대한 종합적인 검토와, 이를 융합 활용하여 우 리나라에 최적화된C밴드 SAR 토양수분 알고리듬을 개발하여야 한다. 우리나라처럼 지면 구성이 국지적으 로 매우 다양한 경우에는 토양수분 산출에 있어서 여러 가지 난점이 존재하는데, 이는 레이더 후방산란이 토양 수분뿐만 아니라 식생이나 지면요소의 영향을 받기 때 문에 토양수분의 효과만을 고유하게 추출해내기 쉽지 않기 때문이다. 이를 위해서는 식생, 지형, 토성, 거칠기 등 우리나라 지면 구성에 대한 고해상도 상세정보의 데 이터베이스 구축이 선행되어야 하며, 이에 대한 별도의 정교한 처방이 이루어져야 할 것이다.
References
Alexakis, D. D., F. D. K. Mexis, A. E. K. Vozinaki, I.
N. Daliakopoulos, and I. K. Tsanis, 2017. Soil moisture content estimation based on Sentinel-1 and auxiliary earth observation products: A hydrological approach, Sensors, 17(6): 1455.
Baghdadi, N. N., M. E. Hajj, M. Zribi, and I. Fayad, 2016. Coupling SAR C-band and optical data for soil moisture and leaf area index retrieval over irrigated grasslands, IEEE Journal of Selected Topics in Applied Earth Observations and Remote Sensing, 9(3): 1229-1243.
Baghdadi, N., M. Aubert, O. Cerdan, L. Franchisteguy, Fig. 9. Comparisons between in-situ and estimated soil moisture by linear regression (LR) and support vector
regression (SVR) methods from VV/VH-polarized backscattering coefficient according to cropland type: (a) VV with LR, (b) VV with SVR, (c) VH with LR, and (d) VH with SVR.
C. Viel, M. Eric, and J. F. Desprats, 2007.
Operational mapping of soil moisture using synthetic aperture radar data: application to the Touch basin (France), Sensors, 7(10): 2458-2483.
Brocca, L., S. Hasenauer, T. Lacava, F. Melone, T.
Moramarco, W. Wagner, W. Dorigo, P. Matgen, J. Martinez-Fernandez, P. Llorens, J. Latron, C.
Martin, and M. Bittelli, 2011. Soil moisture estimation through ASCAT and AMSR-E sensors:
An intercomparison and validation study across Europe, Remote Sensing of Environment, 115(12):
3390-3408.
Chevalier, F. L., 2002. Principles of Radar and Sonar Signal Processing, Artech House, Norwood, MA, USA.
Das, K. and P. K. Paul, 2015. Present status of soil moisture estimation by microwave remote sensing, Cogent Geoscience, 1(1): 1084669.
Dubois, P. C., J. van Zyl, and T. Engman, 1995.
Measuring soil moisture with imaging radars, IEEE Transactions on Geoscience and Remote Sensing, 33(4): 915-926.
Falloon, P., C. D. Jones, M. Ades, and K. Paul, 2011.
Direct soil moisture controls of future global soil carbon changes: An important source of uncertainty, Global Biogeochemical Cycles, 25(3).
Gao, Q., M. Zribi, M. J. Escorihuela, and N. Baghdadi, 2017. Synergetic Use of Sentinel-1 and Sentinel- 2 Data for Soil Moisture Mapping at 100 m Resolution, Sensors, 17(9): 1966.
Hornacek, M., W. Wagner, D. Sabel, H. L. Truong, P.
Snoeij, T. Hahmann, E. Diedrich, and M.
Doubková, 2012. Potential for high resolution systematic global surface soil moisture retrieval via change detection using Sentinel-1, IEEE Journal of Selected Topics in Applied Earth Observations and Remote Sensing, 5(4): 1303-1311.
Kasischke, E. S., L. L. Bourgeau-Chavez, A. R. Rober, K. H. Wyatt, J. M. Waddington, and M. R.
Turetsky, 2009. Effects of soil moisture and water depth on ERS SAR backscatter measurements from an Alaskan wetland complex, Remote Sensing of Environment, 113(9): 1868-1873.
Lakshmi, V., 2013. Remote sensing of soil moisture, ISRN Soil Science, 2013: 33.
Li, J. and W. Chen, 2005. A rule-based method for mapping Canada’s wetlands using optical, radar and DEM data, International Journal of Remote Sensing, 26(22): 5051-5069.
Lu, Z. and D. J. Meyer, 2002. Study of high SAR backscattering caused by an increase of soil moisture over a sparsely vegetated area:
implications for characteristics of backscattering, International Journal of Remote Sensing, 23(6):
1063-1074.
Mattia, F., G. Satalino, A. Balenzano, M. Rinaldi, P.
Steduto, and J. Moreno, 2015. Sentinel-1 for wheat mapping and soil moisture retrieval, 2015 IEEE International Geoscience and Remote Sensing Symposium (IGARSS), Milan, Italy, Jul.
26-31, pp. 2832-2835.
Morvan, A. L., M. Zribi, N. Baghdadi, and A. Chanzy, 2008. Soil moisture profile effect on radar signal measurement, Sensors, 8(1): 256-270.
Nichols, S., Y. Zhang, and A. Ahmad, 2011. Review and evaluation of remote sensing methods for soil-moisture estimation, Journal of Photonics for Energy, 028001-028001.
Paloscia, S., S. Pettinato, E. Santi, C. Notarnicola, L.
Pasolli, and A. Reppucci, 2013. Soil moisture mapping using Sentinel-1 images: Algorithm and preliminary validation, Remote Sensing of Environment, 134: 234-248.
Prakash, R., D. Singh, and N. P. Pathak, 2012. A fusion approach to retrieve soil moisture with SAR and optical data, IEEE Journal of Selected Topics in Applied Earth Observations and Remote Sensing, 5(1): 196-206.
Pratola, C., B. Barrett, A. Gruber, G. Kiely, and E.
Dwyer, 2014. Evaluation of a global soil moisture product from finer spatial resolution SAR data and ground measurements at Irish sites, Remote Sensing, 6(9): 8190-8219.
Reshmidevi, T. V., R. Jana, and T. I. Eldho, 2008.
Geospatial estimation of soil moisture in rain- fed paddy fields using SCS-CN-based model, Agricultural Water Management, 95(4): 447-457.
Tan, L., Y. Chen, M. Jia, L. Tong, X. Li, and L. He, 2015. Rice biomass retrieval from advanced synthetic aperture radar image based on radar backscattering measurement, Journal of Applied Remote Sensing, 9(1): 097091-097091.
Torres, R., P. Snoeij, D. Geudtner, D. Bibby, M.
Davidson, E. Attema, P. Potin, B. Rommen, N.
Floury, M. Brown, I. N. Traver, P. Deghaye, B.
Duesmann, B. Rosich, N. Miranda, C. Bruno, M. L’Abbate, R. Croci, A. Pietropaolo, M.
Huchler, and F. Rostan, 2012. GMES Sentinel-1 mission, Remote Sensing of Environment, 120:
9-24.
Ulaby, F. T., A. Aslam, and M. C. Dobson, 1982. Effects of vegetation cover on the radar sensitivity to soil moisture, IEEE Transactions on Geoscience and Remote Sensing, GE-20(4): 476-481.
van Emmerik, T., S. C. Steele-Dunne, J. Judge, and N.
van de Giesen, 2015. Impact of diurnal variation in vegetation water content on radar backscatter from maize during water stress, IEEE Transactions on Geoscience and Remote Sensing, 53(7):
3855-3869.
Vapnik., V., 1998. Statistical Learning Theory, Wiley, New York, NY, USA.
Wagner, W., D. Sabel, M. Doubkova, A. Bartsch, and C. Pathe, 2009. The potential of Sentinel-1 for monitoring soil moisture with a high spatial resolution at global scale, Symposium of Earth Observation and Water Cycle Science, Frascati, Italy, Nov. 18-20.
Wagner, W., G. Lemoine, and H. Rott, 1999. A method for estimating soil moisture from ERS scatterometer and soil data, Remote sensing of environment, 70(2): 191-207.
Zhang, D. and G. Zhou, 2016. Estimation of soil moisture from optical and thermal remote sensing: A review, Sensors, 16(8): 1308.
Zhao, W. and A. Li, 2013. A downscaling method for improving the spatial resolution of AMSR-E derived soil moisture product based on MSG- SEVIRI data, Remote Sensing, 5(12): 6790-6811.