Article Info
Received October 13, 2020 Revised October 27, 2020 Accepted October 28, 2020 Corresponding Author Oh-yun Kwon
E-mail: [email protected] https://orcid.org/0000-0002-9699-768X
Key Words Hamstring muscles Knee joint
Patellofemoral pain syndrome Quadriceps muscle
Background: Prolonged standing during work causes a lower extremity pain and disorders.
Patellofemoral pain syndrome (PFPS) is one of the common diagnoses of the knee pain. Al- though the etiology of PFPS is not completely understood, it is considered to be multifactorial.
Objects: The purpose of this study was to investigate difference in strength of knee muscles, quadriceps:hamstring muscles strength ratio (Q:H ratio), asymmetry ratio of knee muscles strength and dorsiflexion range of motion (ROM) between standing workers with and without PFPS.
Methods: Twenty-eight standing workers with PFPS and 26 age-, height-, and weight- matched standing workers without PFPS participated in this study. A tension sensor measured knee muscle strength, and motion sensor measured dorsiflexion ROM. The asymmetry ratio of knee muscles was calculated by a specific formula using the knee muscles strength of the dominant side and the sound side. An independent t-test was used to identify significant dif- ferences in the strength, ROM, Q:H ratio, and asymmetry ratio between the PFPS and normal groups.
Results: The standing worker with PFPS have significantly lower dorsiflexion ROM (p <
0.000) and higher asymmetry ratio of the hamstring muscles strength (p < 0.000) compare to the standing worker without PFPS. No significant differences were seen in the strength of quadriceps muscle and hamstring muscles, Q:H ratio, and asymmetry ratio of quadriceps muscle strength.
Conclusion: There was a significant difference in the asymmetry ratio of the isometric ham- string muscle strength. This finding suggests that the asymmetry ratio of isometric hamstring muscle strength may be more important than measuring only the hamstring muscle strength of the PFPS side. Furthermore, the results of this study showed a significant difference in dor- siflexion ROM between the standing industrial workers with and without PFPS. Dorsiflexion ROM and isometric hamstring muscle strength should be considered when evaluating the subjects with PFPS.
Copyright ⓒ Korean Research Society of Physical Therapy
This is an Open Access article distributed under the terms of the Creative Commons Attribution Non-Commercial License (http://creativecommons.org/licenses/by-nc/4.0) which permits unrestricted non-commercial use, distribution, and reproduction in any medium, provided the original work is properly cited.
INTRODUCTION
Standing is considered a versatile and effective position for many process-related jobs in industrial workplaces due to the increased mobility and degree of freedom of the legs. How- ever, when workers spend long periods of time in the standing position during their working hours, they may feel discomfort and experience muscle fatigue by the end of the workday [1].
Prolonged standing or walking can increase the duration of compressive forces, exacerbate fatigue, and lead to damage in
the leg and foot tissues [2,3]. Prolonged work-related risk fac- tor could lead to progressive abnormal biomechanical function and result in a greater risk of chronic lower extremity muscu- loskeletal symptoms and malalignment [4,5].
Knee pain is a common musculoskeletal symptom among people of working age. Epidemiological studies have reported that prolonged standing at work is associated with lower- extremity pain and discomfort [6,7]. Patellofemoral pain syn- drome (PFPS) is one of the common diagnoses of knee pain [8].
Individuals with PFPS often report pain in the retro patellar or
Physical Therapy Korea
PTK https://doi.org/10.12674/ptk.2020.27.4.241 pISSN: 1225-8962 eISSN: 2287-982X Phys Ther Korea. 2020;27(4):241-249
Original Article
Comparison of Knee Muscle Strength and Ankle Dorsiflexion Range of Motion Between Standing Workers With and Without Patellofemoral Pain Syndrome
Young-soo Weon
1,2, BPT, PT, Sun-hee Ahn
2,3, PhD, PT, Jun-hee Kim
2,3, PhD, PT, Gyeon-tae Gwak
1,2, BPT, PT, Oh-yun Kwon
2,3, PhD, PT
1
Department of Physical Therapy, The Graduate School, Yonsei University,
2Kinetic Ergocise Based on Movement Analysis Laboratory,
3
Department of Physical Therapy, College of Health Science, Yonsei University, Wonju, Korea
peri patellar region during tasks that increase patellofemoral joint loading [9], likely due to altered tracking or increased stress in the lateral patellofemoral joint [10]. Although the eti- ology of PFPS is not completely understood, it is considered to be multifactorial [11]. A complex two-way interaction of kine- matics and kinetics exists in the lower extremities, which in- dicates that the kinematics and kinetics around the knee joint are affected by distal and proximal factors [12]. This implies that foot, knee, and hip alignment may all be important in the pathogenesis of PFPS [13,14].
Impaired muscle function is often found in patients with PFPS. The quadriceps and hamstrings muscles are the largest contributors to articular loading on the knee during walking and impact the distribution of load across the knee [15,16].
The quadriceps muscle is often weakened in patients with PFPS, and the decreased quadriceps torque, especially with eccentric knee extension, is found to be associated with PFPS [17,18]. Additionally, muscle strength imbalances be- tween the quadriceps and hamstring muscles are evident in patients with PFPS [19]. This muscle imbalance usually re- flects weakened quadriceps muscles but normal strength of the hamstring muscles, which subsequently results in a lower quadriceps:hamstring muscles (Q:H) ratio [20].
Tightness of soft tissues, such as the gastrocnemius, have also been suggested to influence PFPS. Lack of flexibility of the gastrocnemius and soleus complex is associated with limited ankle dorsiflexion [21]. Lack of ankle dorsiflexion during gait may result in excessive subtalar joint pronation and tibial in- ternal rotation to gain additional range of motion (ROM) for the terminal stance phase of gait [22]. Excessive tibial internal rotation leads to an increased Q-angle and femoral internal ro- tation and consequently increased patellofemoral stresses [23].
However, no studies have compared the knee muscle strength, Q:H ratio, asymmetry ratio of knee muscle, and ankle ROM be- tween standing industrial workers with and without PFPS. The main purpose of this study was therefore to investigate the dif- ferences in the quadriceps muscle strength, hamstring muscle strength, Q:H strength ratio, asymmetry ratio of knee muscle strength, and dorsiflexion ROM between standing industrial workers with and without PFPS.
MATERIALS AND METHODS
1. Subjects
Fifty-four male standing industrial workers (mean age ± standard deviation [SD], 44.69 ± 7.92 years; range, 31 –59 years) who worked for forty a week were recruited from an automobile assembly factory. Twenty-eight standing industrial workers with PFPS and 26 age-, height-, and weight-matched standing industrial workers without PFPS participated in this study. All the subjects were provided with an explanation of the risks and benefits associated with the study and signed an informed consent form. Workers with PFPS were included if they had a positive sign in two or more PFPS screening tests and in two of the specific PFPS tests. The PFPS screening and specific PFPS tests were conducted by an inspector, with 5 years’ experience as a musculoskeletal practitioner. The PFPS screening tests were (a) vague or localized patella or retropa- tella pain for > 3 months [23]; (b) pain > 3/10 on a numeric rating scale reproduced with running [24] and at least one of the following [23]: stair descent or kneeling or squatting or prolonged sitting. The specific PFPS tests used in this study were the patellar apprehension test [25] and Clarke’s test [26].
The exclusion criteria were a history of dislocation or fracture of the patella [23], and lower limb surgery within the previous 4 months [27]. This study was approved by the Yonsei Univer- sity Mirea Institutional Review Board (approval No. 1041849- 202007-BM-078-01).
2. Experimental Instruments 1) Smart KEMA motion sensor
A Smart KEMA motion sensor (KOREATECH Co., Ltd., Seoul, Korea) was used to measure the kinematics of dorsiflexion.
The unit of the Smart KEMA motion sensor output is degrees for all ROM measurements. The motion sensors were mounted on a plastic frame and placed in a Smart KEMA motion strap (KOREATECH Co., Ltd.) to fix the motion sensors in position.
The motion sensors contained a tri-axillar gyroscope, a mag-
netometer, and an accelerometer, as well as a signal converter
and a signal transmission sensor. The motion sensor data were
transmitted to a recording Android tablet with Smart KEMA
software, using a 25 Hz sampling frequency. The value of the
real-time angle for 5 seconds was recorded at the end of the
ROM, and the Smart KEMA software computed the average of
the angle data for the middle 3 seconds for the data analysis.
2) Smart KEMA tension sensor
The isometric muscle strength of knee flexion and extension were measured using a Smart KEMA tension sensor (KOREAT- ECH Co., Ltd.). The tension sensor contained a load cell that had a measurement range of 0 –1,960 N with an accuracy of ± 4.9 N. The tension sensor data were transmitted at a sampling frequency of 10 Hz to a recording Android tablet that was run- ning the Smart KEMA software and computed the average of the data for the middle 3 seconds for the data analysis. In pre- vious studies, a tension sensor was used to measure isometric strength, and this showed high intra-rater reliability [28]. The tension sensor had two rings. One side was fixed to a glass suction cup or a stable material using an orthopedic belt and the other side was fixed to a body segment using the Smart KEMA tension strap (KOREATECH Co., Ltd.).
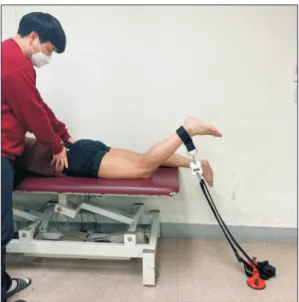
3. Outcome Measures 1) Dorsiflexion ROM
To measure ankle dorsiflexion ROM, each subject was re- quired to lie in the prone position with the knee extended and the foot positioned beyond the edge of the plinth. The Smart KEMA motion sensor was fixed to the lateral aspect of the sub- ject's fifth metatarsal using the Smart KEMA motion strap. To prevent compensation such as pronation of the subtalar joint, the examiner neutralized the subtalar joint. The examiner held the subject’s metatarsals and dorsiflexion direction until resis- tance was felt. The dorsiflexion ROM was measured when the examiner felt the end-feel of the ankle joint (Figure 1).
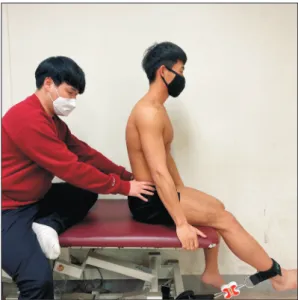
2) Quadriceps muscle strength
To measure the isometric strength of the quadriceps mus- cles, the length of the restraining belt was adjusted so that the subjects could reach a knee extension of 45°. The subjects performed knee extensions against a strap anchored by the therapeutic table to measure the maximal voluntary isometric contraction (MVIC) twice (Figure 2). An ankle strap was placed on the ankle above the lateral malleolus. The subjects were shown how to stabilize themselves by holding onto the side of the table with their hands while sitting upright. To prevent compensation such as posterior of the pelvis, the examiner fixed the pelvis (Figure 3). Strength was analyzed by averaging the middle 3 seconds of 5 seconds measurement. Strength was
Figure 1.
Figure 1. Dorsiflexion range of motion.
Figure 2.
Figure 2. Quadriceps muscle strength.
Figure 3.
Figure 3. Quadriceps muscle strength.
normalized by the subject’s body weight (N/kg). Strength was measured two times and averaged for the data analysis.
3) Hamstring muscle strength
The isometric strength measurement of the hamstring mus- cles was performed with the subject in the prone position. The subject flexed the knee at 45°. The knee flexion was performed against a strap anchored by a glass suction cup to measure the MVIC twice. An ankle strap was placed on the ankle above the lateral malleolus. To prevent compensation such as anterior of the pelvis, the examiner fixed the pelvis (Figure 4). Strength was analyzed by averaging the middle 3 seconds of 5 seconds measurement. Strength was normalized by body weight (N/kg), measured two times, and averaged for the data analysis.
4) Asymmetry ratio
The asymmetry ratio between the sound and PFPS sides was calculated using the following formula: percent asymmetry ratio of the strength of the quadriceps and hamstring muscles
= (sound side – PFPS side)/ (sound side + PFPS side) × 100. To calculate the percent asymmetry ratio of knee muscle strength in the standing workers without PFPS, the dominant side was replaced with the sound side in the asymmetry ratio formula when comparing the normal worker group to the PFPS group with a sound side, and the non-dominant side was replaced with the PFPS side when comparing the normal worker group to the PFPS group with a PFPS side [29,30].
4. Experimental Procedures
Before data collection, the subjects were familiarized with the testing protocol. Provided instructions, and asked to prac- tice the dorsiflexion ROM and knee strength measurement to ensure proper test. Then, dorsiflexion ROM and knee muscle strength (quadriceps, hamstrings) was measured in random or- der. The random order was determined by drawing lots. Mean values from two measurements of dorsiflexion ROM and knee strength were used for data analysis.
5. Data Collection
The data from the Smart KEMA motion sensor and Smart KEMA tension sensor were recorded at sampling frequencies of 25 Hz and 10 Hz, respectively, and transmitted to an Android tablet over a Bluetooth connection using the Smart KEMA ap- plication software (KOREATECH Co., Ltd.). The dorsiflexion ROM data were expressed in degrees and the knee muscle strength measurement data were expressed in kilograms. The collected knee muscle strength data were normalized to body weight. The normalized strength was represented as a percent- age of body weight, where percentage of body weight = (maxi- mal strength of each trial [kg]/body weight [kg]) × 100 [31].
The average strength values of the two measurements were calculated for subsequent analyses.
6. Statistical Analysis
In this study, the data were expressed as mean ± SD. All the data were tested for normal distribution using the Kolmogorov–
Smirnov normality test. An independent t-test was used to identify significant differences in the strength, ROM, Q:H ratio, and asymmetry ratio between the PFPS and normal groups. All the analyses were performed using SPSS 25.0 (IBM Corp., Ar- monk, NY, USA). The level of significance was set at p = 0.05.
RESULTS
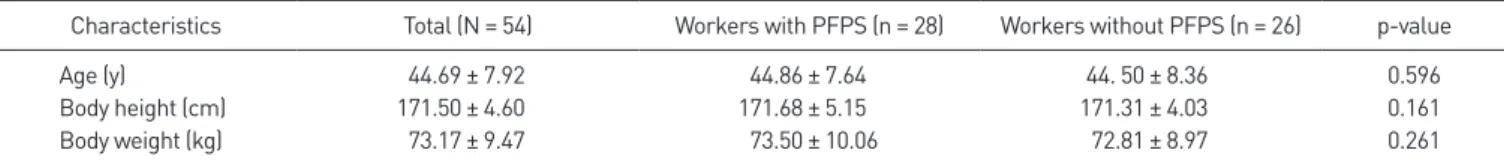
Table 1 summarizes the characteristics of the participants in each group at baseline. The mean age of the participants was nearly 45 years with a range of 31-59 years. Independent t-tests were performed on the baseline outcome measures, and there was no significant differences in the age, height and weight of the participants between the groups.
Figure 4.
Figure 4. Hamstring muscles strength.
1. Dorsiflexion ROM and Strength of Knee Muscles The results of the independent t-test indicated that the workers with PFPS had a significantly lower dorsiflexion ROM than the workers without PFPS (p < 0.05). However, there was no significant difference in the isometric muscle strength of the quadriceps and hamstring muscles and the Q:H ratio be- tween the workers with and without PFPS (p > 0.05) (Table 2).
2. Asymmetry of Knee Muscles Strength
The asymmetry ratios of the isometric muscle strength of the hamstring muscles was significantly higher in the workers with PFPS compared to those without PFPS (p < 0.05). However, there were no significant differences in the asymmetry ratio of isometric muscle strength of the quadriceps muscles between the two groups (p > 0.05) (Table 3).
DISCUSSION
The primary purpose of this study was to compare the knee joint muscle strength, ankle joint dorsiflexion ROM, and asym- metry ratio of the knee muscles strength between standing workers with and without PFPS. The standing worker with PFPS demonstrated significantly lower dorsiflexion ROM and a significantly higher asymmetry ratio of isometric hamstring
muscles strength. However, there were no differences in the isometric strength of the quadriceps and hamstring muscles, isometric Q:H strength and asymmetry ratio of isometric quad- riceps muscle strength.
Similarly to our results, a study by Rabin et al. found a re- duction in dorsiflexion ROM among individuals with PFPS compared to the asymptomatic group [32]. The results of a study by Arndt et al. were also consistent with those of our study. Arndt et al reported a maximum of 18.7° of dorsiflex- ion during gait on a flat surface [33]. Therefore, if patients with PFPS have insufficient dorsiflexion ROM, they may use compensatory mechanisms such as excessive subtalar joint pronation and consequently increased external rotation of the tibia, or perhaps femur internal rotation, to gain additional motion during terminal stance phase of gait [23]. Stergio et al. [34] suggested that tight plantar flexors and increased sub- talar joint pronation could increase ground reaction impact forces and lateral deviation of the tibia as a rebound effect due to the increased impact with the ground during gait and may be a source of various injuries. In contrast, Mølgaard et al. [35] reported a significantly larger dorsiflexion ROM in the PFPS group (22.28° vs. 17.78°) in their study, and Powers et al.
[36] demonstrated greater ankle dorsiflexion in patients with PFPS compared with the control group when the patients were Table 1.
Table 1. Characteristics of the workers with and without PFPS
Characteristics Total (N = 54) Workers with PFPS (n = 28) Workers without PFPS (n = 26) p-value
Age (y) 44.69 ± 7.92 44.86 ± 7.64 44. 50 ± 8.36 0.596
Body height (cm) 171.50 ± 4.60 171.68 ± 5.15 171.31 ± 4.03 0.161
Body weight (kg) 73.17 ± 9.47 73.50 ± 10.06 72.81 ± 8.97 0.261
Values are presented as mean ± standard deviation. PFPS, patellofemoral pain syndrome.
Table 2.
Table 2. Comparison of the dorsiflexion ROM, knee muscle strength, and Q:H ratio between the workers with and without PFPS
Workers with PFPS (n = 28) Workers without PFPS (n = 26) p-value
Dorsiflexion ROM (°) 9.52 ± 3.17 13.45 ± 3.38 < 0.000*
Quadriceps muscle strength (kgf·BW
–1) 44.04 ± 15.69 47.81 ± 17.74 0.413
Hamstring muscles strength (kgf·BW
–1) 23.05 ± 9.12 18.77 ± 6.67 0.402
Q:H ratio 1.97 ± 0.07 2.19 ± 0.13 0.152
Values are presented as mean ± standard deviation. ROM, range of motion; Q:H, quadriceps muscles:hamstring muscles; PFPS, patellofemoral pain syn- drome. *p < 0.05.
Table 3.
Table 3. Comparison of the asymmetry ratio of knee strength between the workers with and without PFPS