JESK
http://jesk.or.kr eISSN:2093-8462A Study on Office Environment Satisfaction and Worker's Subjective Symptoms
Byung Yong Jeong, Dong Seok Shin, Myoung Hwan Park
Department of Industrial and Management Engineering, Hansung University, Seoul, 136-792
Corresponding Author Myoung Hwan Park Department of Industrial and Management Engineering, Hansung University, Seoul, 136-792 Phone : +82-2-760-4121 Email : [email protected]
Received : March 22, 2015 Revised : March 24, 2015 Accepted : April 06, 2015
Objective:This study aims to investigate the correlation between office environment satisfaction levels and workers' subjective symptoms by conducting surveys asking office workers to state their subjective symptoms and office satisfaction levels.
Background: The increased number of office workers and their work hours have led to new understandings of the importance of office environments including its temperature, humidity, noise levels, lighting, space arrangements, and quality of air.
Method: Specific details on office work, office environment, office space satisfaction levels, workplace related symptoms, absence from work, due to workplace-related symptoms, were analyzed based on the survey answers given by 451 office workers who were the subjects of this research.
Results: Office workers showed different characteristics of subjective symptoms depending on their gender, age, work experience, and time spent resting and on computers. Also, differences in symptoms were found for workers with different satisfaction levels for office environment (temperature, humidity, noise levels, quality of air, lighting) and office space arrangements (location of monitors, area and display of office space, chairs and desks).
Conclusion and Application: Relationship between workers' satisfaction levels with the office environment and their subjective symptoms is expected to be serve as essential data for systematic management of the workplace.
Keywords: Office worker, Sick building syndrome, Work environment, Subjective comfort
Copyright@2015 by Ergonomics Society of Korea. All right reserved.
○ccThis is an open-access article distributed under the terms of the Creative Commons Attribution Non-Commercial License (http://
creativecommons.org/licenses/by-nc/3.0/), which permits unrestricted non-commercial use, distribution, and reproduction in any medium, provided the original work is properly cited.
1. Introduction
Nowadays, modern people spend most daily life within indoor spaces including offices. As the ratio of office workers goes up, and they spend most time in office, office space need to conform to work efficiency and comfort (Jeong, 2015; Jeong and Yoon, 2014). As the population is aging, it is critically recognized to consider the elderly-friendly design or universal design concept so that elderly workers can efficiently work, when designing work space, as the number of elderly workers increases (Baik et al., 2014; Jeong and Shin, 2014).
As the size of building enlarges and high rise building becomes common, people pay attention to the indoor environment of offices. Especially, the importance of air
quality of offices related to sick building syndrome (SBS), caused by the use of insulators containing chemicals, emphasized. The symptoms of SBS are diverse, such as irritation of eye, nose and throat, skin rash and headache, and also include mental fatigue resulting decreased work efficiency and declined memory (Burge et al., 1987; Burge, 2004; Li and Yang, 2004). In Korea, air quality is divided into outdoor air and indoor air, and the outdoor air is specified by the Air Environmental Conservation Act and Special Act on Air Environmental Improvement in Seoul Metropolitan Area. The indoor air is specified by the Building Act, Public Sanitary Management Act, School Health Act and Industrial Health and Safety Act, as well as the Indoor Air Quality Management Act for Multiuse Facilities (Jeong, 2015).
The preceding studies on office environment include the following: Impacts of indoor air quality on health (Burge et al., 1987;
Burge, 2004; Li and Yang, 2004; Kwon and Park, 2007), Relationship between hours of office equipment use and SBS (Jaakkola et al., 1999), Relationship between computer use time and SBS (Kubo et al., 2006), Relationship between VDT (Video Display Terminal) syndrome and office environment (Jeong et al., 2009; Sim and Lee, 2008).
In summary, preceding researches on office workers and office environment focus on how design factors on office environment and office work space are related to subjective symptom of sick building syndrome, VDT syndrome, pain complaint of musculoskeletal body parts, subjective satisfaction, productivity and stress. Relatively, this study investigates the impacts of design factors of office environment and office work space on subjective symptom associated with satisfaction and sick building syndrome, excluding musculoskeletal pain complaints or VDT syndrome.
For comfortable office environment, it is important to keep office workers healthy and enhance work efficiency by managing the various factors of lighting, noise, air environment and office space (Passarelli, 2009). This study investigates general work characteristics, working conditions, satisfaction on office environment and office space, the status of subjective symptoms of sensitive organs, and the status of absence from work and medical treatment due to pain of sensitive organs of office workers working in the public agencies for many hours.
2. Methods 2.1 Data collection
This study conducts a questionnaire survey on office environment targeting office workers working in the offices all day long.
The details of the questionnaire consist of office workers' general characteristics, satisfaction on office environment, subjective symptom of sensitive organs and the status of absence from work and medical treatment due to pain of sensitive organs.
General characteristics consist of gender, age, length of service, working hours, resting time (break time) and hours of computer use.
This study expressed general satisfaction on office environment (temperature and humidity, noise, air quality, lighting), office space characteristics (monitor arrangement without glare, office space area and passage and arrangement, functional features of desks and chairs) with 5-point scale (1: very uncomfortable, 2: uncomfortable, 3: moderate, 4: comfortable, 5: very uncomfortable). The status of subjective symptom of sensitive organs (eye, nose, throat, skin, headache) was expressed with 5-point scale (1: Never, 2:
Sometimes, 3: From time to time, 4: Frequent, 5: Always) The complaints of subjective symptom of sensitive organs were expressed as follows: eye (burning or blurry, dry) nose (dry or blocked, runny nose), throat (throat discomfort, stinging, phlegm stuck), skin (chapped skin or skin trouble, itchy), headache (feeling pressure on chest or headache due to bad air). This study also investigated the status of absence from work and medical treatment for the past one year, due to pain on of sensitive organs.
2.2 Subjects
This study surveyed satisfaction and pain complaints of office environment targeting 451 office workers working at public agencies.
451 office workers consisted of 302 males (66.9%) and 149 females (33.0%). The age distribution was 148 people in their 30s (32.8%), 182 in their 40s (40.4%) and 121 in their 50s (26.8%). The distribution of length of service was 54 people with less than five years (12.0%), 80 people with 5~less than 10 years (17.7%), 51 people with 10~less than 15 years (11.3%), 84 people with 15~less than 20 years (18.6%) and 182 people with more than 20 years (40.4%).
The distribution of daily working hours using computers was 64 people with less than 6 hours (14.2%), 86 people with 6~less than 8 hours (19.1%), 141 people with 8~less than 10 hours (31.3%) and 160 people with more than 10 hours (35.5%). Actually, 66.8% answered they used computers for eight hours and more.
2.3 Data analysis
This study analyzed the relationships among the gender, age, length of service, working hours, break time and computer use time of the pain complainers, who responded with frequent or constant subjective symptom by sensation part. This study also investigated relations between office environment (temperature and humidity, lighting and air quality) and satisfaction with office space characteristics (monitor arrangement, office space area and arrangement, functions of desks and chairs). For those who receive medical treatment due to pain for the recent one year, this study analyzed whether there were differences between work characteristics and mean satisfaction on office environment elements using a variance analysis method.
3. Results
3.1 Subjective conformance for office environment
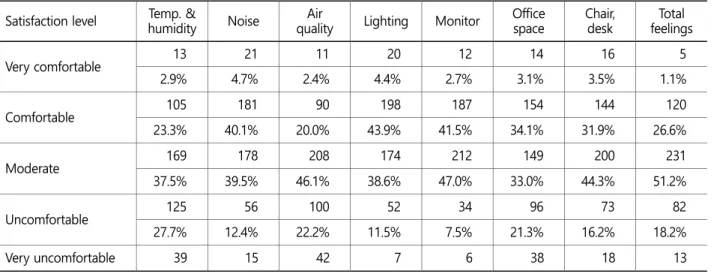
Table 1 shows the satisfaction ratios of 451 office workers with satisfaction level on office environment and office work space characteristics.
Table 1. Subjective conformance levels (5 scales) for office environment Satisfaction level Temp. &
humidity Noise Air
quality Lighting Monitor Office
space Chair,
desk Total feelings
Very comfortable 13 21 11 20 12 14 16 5
2.9% 4.7% 2.4% 4.4% 2.7% 3.1% 3.5% 1.1%
Comfortable 105 181 90 198 187 154 144 120
23.3% 40.1% 20.0% 43.9% 41.5% 34.1% 31.9% 26.6%
Moderate 169 178 208 174 212 149 200 231
37.5% 39.5% 46.1% 38.6% 47.0% 33.0% 44.3% 51.2%
Uncomfortable 125 56 100 52 34 96 73 82
27.7% 12.4% 22.2% 11.5% 7.5% 21.3% 16.2% 18.2%
Very uncomfortable 39 15 42 7 6 38 18 13
From Table 1, the response ratio of "comfortable" on general satisfaction was 27.7%, higher than 21.1% of the response,
"uncomfortable". The items for which uncomfortable ratio was higher thant that of comfortable were temperature & humidity and air quality. Looking at the ratios of dissatisfaction, temperature and humidity was 36.4%, followed by air quality (31.5%), office space area and arrangement (29.7%) and functions of desks and chairs (20.2%). Dissatisfaction ratio on temperature and humidity control and air quality seems to be high, because many office workers work in narrow space together in the office for many hours. And also budget limit makes it difficult to provide chairs with height-adjustable arm rest or neck rest, and height- adjustable desks.
3.2 Pain experienced from sick building syndrome
Table 2 reveals the status of pain complaints by 451 office workers. The office workers, who answered they experienced no pain, were only 12.9%. Meanwhile, 41.7% of the respondents said they experienced frequent or constant pain on such parts as nose, eye, throat, skin and also headache. By pain item, the subjective symptom complaining ratios of eye (35.5%) and nose (22.8%) were higher than those of throat (15.1%), headache (15.1%) and skin (10.4%). The reason why pain complaints against eye and nose were relatively higher was that eye and nose are relatively more sensitive to pain, and that higher dissatisfaction on temperature and humidity and air quality, together with long time computer work, was also reflected.
60 office workers (15.5%) among 451 subjects revealed they had experience of medical treatment due to pain.
3.3 Distribution of experienced pain by office worker characteristics
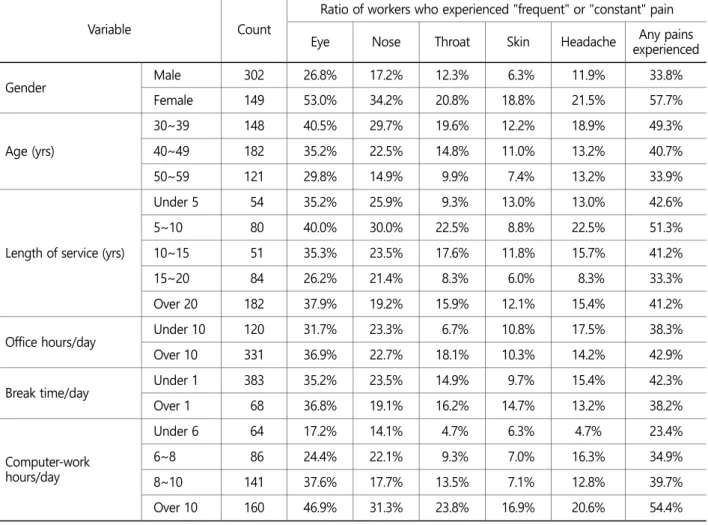
Table 3 shows the distributions of 188 respondents, who said they experienced frequent or constant pain, according to gender, age, length of service, office hours, break time and computer work hours.
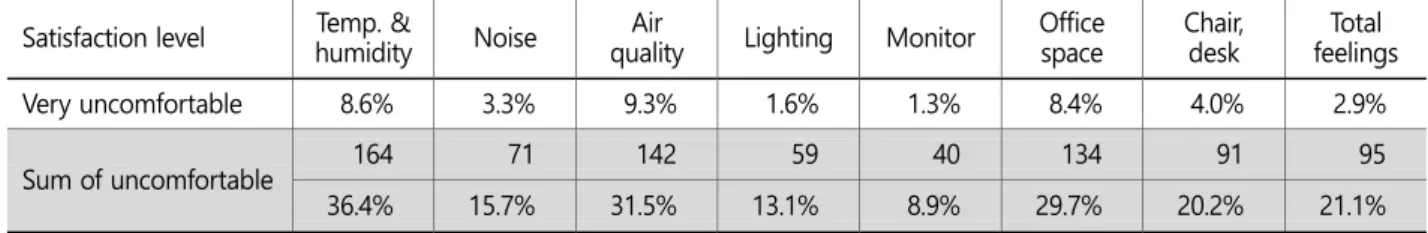
In Table 3, female was 57.7% among the pain complainers, who answered they experienced frequent or constant pain, which Table 1. Subjective conformance levels (5 scales) for office environment (Continued)
Satisfaction level Temp. &
humidity Noise Air
quality Lighting Monitor Office
space Chair,
desk Total feelings
Very uncomfortable 8.6% 3.3% 9.3% 1.6% 1.3% 8.4% 4.0% 2.9%
Sum of uncomfortable 164 71 142 59 40 134 91 95
36.4% 15.7% 31.5% 13.1% 8.9% 29.7% 20.2% 21.1%
Table 2. Pain experienced from sick building syndrome No pain
experienced
Ratio of workers who experienced "frequent" or "constant" pain
Total subjects
Eye Nose Throat Skin Headache No. of pain
experienced
58 160 103 68 47 68 188 451
12.9% 35.5% 22.8% 15.1% 10.4% 15.1% 41.7% 100%
was higher than male (33.8%). This is consistent with the results of Stenberg and Wall (1995), and Reijula (2004). Especially, female office workers' complaints against eye (53.0%) and nose (33.8%) were high.
As for complaining ratio by age, it was higher in the following order: 30s (49.3%), 40s (40.7%) and 50s (33.9%). Actually, the pain complaint ratio of the respondents in their 30s was rather higher. Especially, pain complaining ratios of eye (40.5%) and nose (29.7%) of those in their 30s were high. This indicates that the pain complaining ratios of the office workers in their 30s, who work longer in offices than 40s and 50s, are higher.
Concerning pain complaining ratio by length of service, the office workers having 5~10 years of length of service ranks the highest, 51.3%, followed by those having less than 5 years (42.6%). The office workers having 10~15 years (41.2%) and more than 20 years (41.2%) showed similar ratio, and those having 15~20 years (33.3%) showed relatively lower ratio.
As for pain complaining ratio by office hours, the pain complaining ratio of the office workers having ten hours and more of office hours was 42.9%, higher than those having less than ten hours (38.3%), even though the gap is not huge.
Table 3. Distribution of experienced pain by office worker characteristics
Variable Count
Ratio of workers who experienced "frequent" or "constant" pain Eye Nose Throat Skin Headache Any pains
experienced
Gender Male 302 26.8% 17.2% 12.3% 6.3% 11.9% 33.8%
Female 149 53.0% 34.2% 20.8% 18.8% 21.5% 57.7%
Age (yrs)
30~39 148 40.5% 29.7% 19.6% 12.2% 18.9% 49.3%
40~49 182 35.2% 22.5% 14.8% 11.0% 13.2% 40.7%
50~59 121 29.8% 14.9% 9.9% 7.4% 13.2% 33.9%
Length of service (yrs)
Under 5 54 35.2% 25.9% 9.3% 13.0% 13.0% 42.6%
5~10 80 40.0% 30.0% 22.5% 8.8% 22.5% 51.3%
10~15 51 35.3% 23.5% 17.6% 11.8% 15.7% 41.2%
15~20 84 26.2% 21.4% 8.3% 6.0% 8.3% 33.3%
Over 20 182 37.9% 19.2% 15.9% 12.1% 15.4% 41.2%
Office hours/day Under 10 120 31.7% 23.3% 6.7% 10.8% 17.5% 38.3%
Over 10 331 36.9% 22.7% 18.1% 10.3% 14.2% 42.9%
Break time/day Under 1 383 35.2% 23.5% 14.9% 9.7% 15.4% 42.3%
Over 1 68 36.8% 19.1% 16.2% 14.7% 13.2% 38.2%
Computer-work hours/day
Under 6 64 17.2% 14.1% 4.7% 6.3% 4.7% 23.4%
6~8 86 24.4% 22.1% 9.3% 7.0% 16.3% 34.9%
8~10 141 37.6% 17.7% 13.5% 7.1% 12.8% 39.7%
Over 10 160 46.9% 31.3% 23.8% 16.9% 20.6% 54.4%
Concerning pain complaining ratio according to break time, the pain complaining ratio of those having less than an hour of break time was 42.3%, higher than those having an hour and more (38.2%).
As for pain complaining ratio according to computer work hours, those having 10 hours and more was 54.4%, followed by 8~10 hours (39.7%), 6~8 hours (34.9%), and less than 6 hours (23.4%). The result indicates that pain complaining ratios are higher, as computer work hours become longer like the study results of Kubo et al. (2006), Jaakkola et al. (1999), and Jeong et al. (2009).
3.4 Office environment satisfaction levels and workers' subjective symptoms
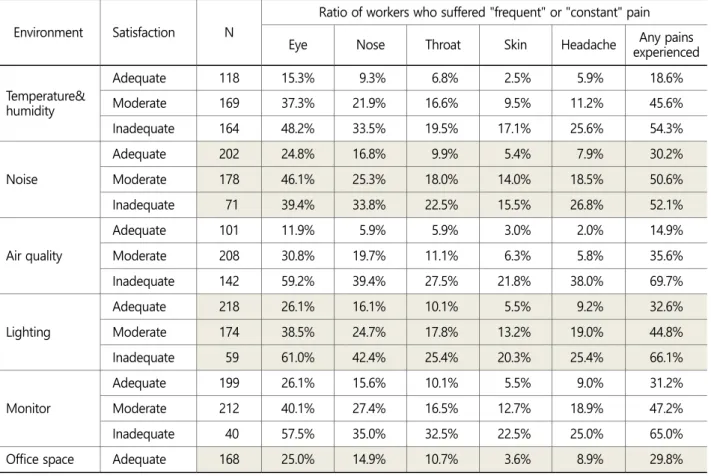
Table 4 shows relations between satisfaction level on work environment factors (temperature, humidity, noise, air quality, lighting, monitor, space area and arrangement and desks and chairs) and the ratio of pain complainers, who answered frequent or constant pain. 'Adequate' in Table 4. represents 'very comfortable' and 'comfortable' while 'Inadequate' represents 'uncomfortable' and 'very uncomfortable'. In Table 4, when satisfaction with work environment factors is higher, the pain complainer ratio was lower.
The pain complaining ratios of the office workers, who experienced uncomfortable feeling on air quality, lighting and monitor among the office environment elements were higher than other office environment factors. Namely, the pain complainer ratios were higher, who complained against air quality (69.7%), lighting (66.1%) and monitor (65.0%), than desks and chairs (59.3%), space area and arrangement (57.5%), temperature and humidity (54.3%) and noise (52.1%).
Table 4. Ratio of workers who suffered "frequent" or "constant" pain by office satisfaction levels Environment Satisfaction N
Ratio of workers who suffered "frequent" or "constant" pain
Eye Nose Throat Skin Headache Any pains
experienced
Temperature&
humidity
Adequate 118 15.3% 9.3% 6.8% 2.5% 5.9% 18.6%
Moderate 169 37.3% 21.9% 16.6% 9.5% 11.2% 45.6%
Inadequate 164 48.2% 33.5% 19.5% 17.1% 25.6% 54.3%
Noise
Adequate 202 24.8% 16.8% 9.9% 5.4% 7.9% 30.2%
Moderate 178 46.1% 25.3% 18.0% 14.0% 18.5% 50.6%
Inadequate 71 39.4% 33.8% 22.5% 15.5% 26.8% 52.1%
Air quality
Adequate 101 11.9% 5.9% 5.9% 3.0% 2.0% 14.9%
Moderate 208 30.8% 19.7% 11.1% 6.3% 5.8% 35.6%
Inadequate 142 59.2% 39.4% 27.5% 21.8% 38.0% 69.7%
Lighting
Adequate 218 26.1% 16.1% 10.1% 5.5% 9.2% 32.6%
Moderate 174 38.5% 24.7% 17.8% 13.2% 19.0% 44.8%
Inadequate 59 61.0% 42.4% 25.4% 20.3% 25.4% 66.1%
Monitor
Adequate 199 26.1% 15.6% 10.1% 5.5% 9.0% 31.2%
Moderate 212 40.1% 27.4% 16.5% 12.7% 18.9% 47.2%
Inadequate 40 57.5% 35.0% 32.5% 22.5% 25.0% 65.0%
Office space Adequate 168 25.0% 14.9% 10.7% 3.6% 8.9% 29.8%
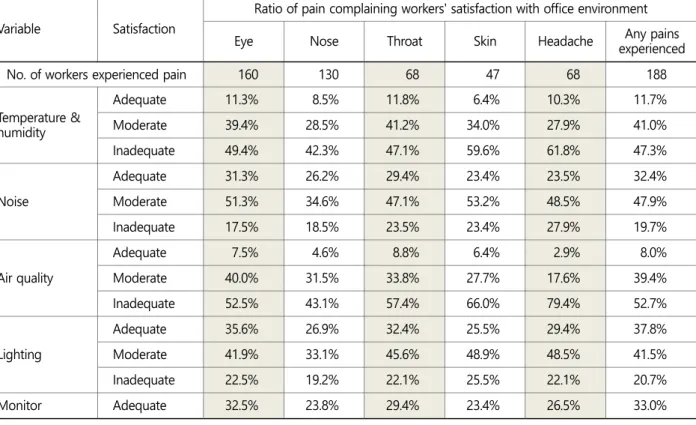
Table 5 reveals the ratio of pain complaining workers' satisfaction with office environment factors. Among The environmental factors, 188 pain complainers experiencing any type of pains show higher dissatisfaction with air quality (52.7%), temperature and humidity (47.3%), office space area and arrangement (41.0%), and the ranks are same for individual pain types. Dissatisfaction ratios of the pain complainers relatively high compared to the dissatisfaction ratios of 451 respondents on temperature and humidity (36.4%), air quality (31.5%) and space area and arrangement (29.7%). Especially, most headache complainers experienced that air quality (79.4%), temperature and humidity (61.8%) and office space area and arrangement (54.4%) were uncomfortable.
skin pain complainers experienced that air quality (66.0%) and temperature and humidity (59.6%) were uncomfortable. And, more than half of the pain complainers on eye an throat dissatisfied with indoor air quality.
Table 4. Ratio of workers who suffered "frequent" or "constant" pain by office satisfaction levels (Continued) Environment Satisfaction N
Ratio of workers who suffered "frequent" or "constant" pain
Eye Nose Throat Skin Headache Any pains
experienced
Office space Moderate 149 36.2% 22.8% 11.4% 13.4% 10.7% 40.9%
Inadequate 134 47.8% 32.8% 24.6% 15.7% 27.6% 57.5%
Chair and desk
Adequate 160 27.5% 16.3% 8.8% 3.1% 8.8% 30.0%
Moderate 200 37.5% 26.0% 14.0% 12.5% 15.0% 43.0%
Inadequate 91 45.1% 27.5% 28.6% 18.7% 26.4% 59.3%
Table 5. Ratio of workers with reported symptoms by office satisfaction level Variable Satisfaction
Ratio of pain complaining workers' satisfaction with office environment
Eye Nose Throat Skin Headache Any pains
experienced
No. of workers experienced pain 160 130 68 47 68 188
Temperature &
humidity
Adequate 11.3% 8.5% 11.8% 6.4% 10.3% 11.7%
Moderate 39.4% 28.5% 41.2% 34.0% 27.9% 41.0%
Inadequate 49.4% 42.3% 47.1% 59.6% 61.8% 47.3%
Noise
Adequate 31.3% 26.2% 29.4% 23.4% 23.5% 32.4%
Moderate 51.3% 34.6% 47.1% 53.2% 48.5% 47.9%
Inadequate 17.5% 18.5% 23.5% 23.4% 27.9% 19.7%
Air quality
Adequate 7.5% 4.6% 8.8% 6.4% 2.9% 8.0%
Moderate 40.0% 31.5% 33.8% 27.7% 17.6% 39.4%
Inadequate 52.5% 43.1% 57.4% 66.0% 79.4% 52.7%
Lighting
Adequate 35.6% 26.9% 32.4% 25.5% 29.4% 37.8%
Moderate 41.9% 33.1% 45.6% 48.9% 48.5% 41.5%
Inadequate 22.5% 19.2% 22.1% 25.5% 22.1% 20.7%
Monitor Adequate 32.5% 23.8% 29.4% 23.4% 26.5% 33.0%
3.5 Ratio of workers with reported symptoms by office satisfaction level
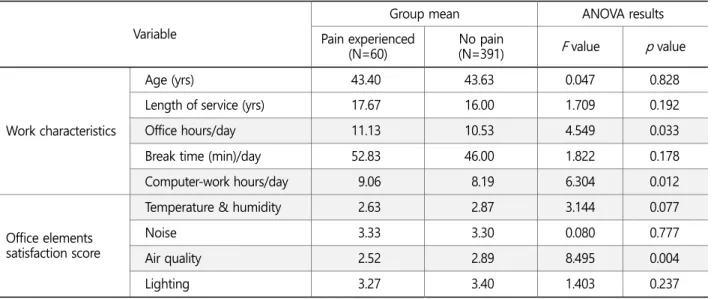
Table 6 shows average test on whether there are differences between the group having an experience of treatment due to one of following problems: eye, nose, throat, skin pains and headache for the past one year (60 people) and the normal group without such a treatment experience (391 people), according to worker characteristics and office environmental elements.
From Table 6, office hours and computer work hours were statistically longer in the treatment-experienced group at significance level 0.1. Meanwhile, statistically significant differences existed in satisfaction with temperature and humidity, air quality, monitor arrangement and desks and chairs between the two groups (at significance level 0.1), and satisfaction score was lower in the treatment-experienced group.
Table 5. Ratio of workers with reported symptoms by office satisfaction level (Continued) Variable Satisfaction
Ratio of pain complaining workers' satisfaction with office environment
Eye Nose Throat Skin Headache Any pains
experienced
Monitor Moderate 53.1% 44.6% 51.5% 57.4% 58.8% 53.2%
Inadequate 14.4% 10.8% 19.1% 19.1% 14.7% 13.8%
Office space
Adequate 26.3% 19.2% 26.5% 12.8% 22.1% 26.6%
Moderate 33.8% 26.2% 25.0% 42.6% 23.5% 32.4%
Inadequate 40.0% 33.8% 48.5% 44.7% 54.4% 41.0%
Chair and desk
Adequate 27.5% 20.0% 20.6% 10.6% 20.6% 25.5%
Moderate 46.9% 40.0% 41.2% 53.2% 44.1% 45.7%
Inadequate 25.6% 19.2% 38.2% 36.2% 35.3% 28.7%
Table 6. Comparison of work characteristics and office satisfaction levels by treatment experience Variable
Group mean ANOVA results
Pain experienced
(N=60) No pain
(N=391) F value p value
Work characteristics
Age (yrs) 43.40 43.63 0.047 0.828
Length of service (yrs) 17.67 16.00 1.709 0.192
Office hours/day 11.13 10.53 4.549 0.033
Break time (min)/day 52.83 46.00 1.822 0.178
Computer-work hours/day 9.06 8.19 6.304 0.012
Office elements satisfaction score
Temperature & humidity 2.63 2.87 3.144 0.077
Noise 3.33 3.30 0.080 0.777
Air quality 2.52 2.89 8.495 0.004
Lighting 3.27 3.40 1.403 0.237
4. Conclusion and Discussion
This study investigated office workers' work characteristics targeting office workers working at public agencies, and conducted satisfaction survey on office environment and office space, and analyzed the relationship between satisfaction and pain complaints.
In this study, there were more respondents saying that temperature and humidity, air quality and office space arrangement were uncomfortable. Meanwhile, the response ratio of "comfortable", was higher than that of "uncomfortable", from an aspect of overall satisfaction on office environment and space. This can be explained by the fact that satisfaction on functional factors affecting office work such as noise, lighting and monitor was high, and also that the functions of desks and chairs were relatively comfortable. In the meantime, satisfaction on temperature & humidity and air quality was relatively low, compared to overall satisfaction.
The office workers showed higher pain complaining rates, when they were females, or when their working hours and computer work hours were longer. Also, the office workers showed higher pain complaining ratios, as their satisfaction on the office environment (temperature and humidity, noise, air quality and lighting) and office work characteristics (monitor arrangement, office space area and arrangement, the functions of desks and chairs) was lower. Such a result is consistent with the research of Passarelli (2009), who reckoned air quality, noise and the chemical components from buildings or furniture, lighting and temperature and humidity as the sources of sick building syndrome.
69.7% of the office workers complaining of dissatisfaction with air quality complained of at least one type of pain, and so air quality is very important to the office workers who work indoors mainly. According to a study of Jaakkola et al. (2007), sick building syndrome or chronic respiratory syndrome or respiratory infection is prevalent when people are exposed to carbonless copy paper, paper dust and fumes generated from a photocopier or printer. As the number of the exposure increases, the risk of such symptoms gets severe, and the risk of developing chronic respiratory syndrome becomes higher.
There were more female pain complainers than male pain complainers, and this is consistent with the study results of Stenberg and Wall (1995), and Reijula (2004). In the study by Sim and Lee (2008) that investigated the symptoms of musculoskeletal disorders, eye and skin problem in relation with VDT syndrome, females were frequent than males in all symptoms, because of female's dual role stress at home and work. By age, younger age group's pain complainers' ratio was higher. In the study related with VDT syndrome of Sim and Lee (2008), the highest score was revealed in the younger group (20~30 years of age).
As for pain complaining ratio by working hours, the pain complaining ratio of office workers having ten hours and more was higher, which is consistent with the study of Sim and Lee (2008). Regarding break time, the pain complaining ratio of office workers having less than an hour of break was higher. In the VDT syndrome study of Sim and Lee (2008), higher score was Table 6. Comparison of work characteristics and office satisfaction levels by treatment experience (Continued)
Variable
Group mean ANOVA results
Pain experienced
(N=60) No pain
(N=391) F value p value
Office elements satisfaction score
Monitor 3.17 3.40 5.363 0.021
Office space 2.85 3.05 2.021 0.156
Chair and desk 2.95 3.18 3.600 0.058
revealed form the group taking no rest during work.
As computer work hours were longer, the pain complaining ratio was higher, which is consistent with the study of Jaakkola and Jaakkola (1999) showing a significant result on headache, lethargy and eye symptom in the group having ten hours and more of computer work hours.
In the studies of Kubo et al. (2006) on VDT syndrome, there was a positive relationship between VDT work hours and sick building syndrome in the case of males, and sick building syndrome was prevalent for females conducting VDT work for more than a certain period of time.
When satisfaction on temperature and humidity, noise, air quality, lighting, monitor, office area and arrangement and the functions of desks and chairs was higher, the ratio of pain complainers was lower. Among various office environment elements, the ratio of pain complainers of the office workers, who felt uncomfortable for air quality, lighting and monitor was higher than in the other office environment elements.
When satisfaction on temperature and humidity and air quality was higher, the pain complainers' ratio was lower. This result is consistent with the study result of Kim et al. (2012) saying that there is a significant relationship between indoor concentration of formaldehyde and dry eye, although there was no significant impact of CO2 and temperature and humidity. The result actually is consistent with an air quality aspect and is different from a temperature and humidity aspect.
The results of this study have a limitation in that this study investigated and analyzed by a questionnaire survey on office workers' satisfaction with office environment and subjective symptoms targeting 451 office workers working at public agencies. This study actually interpreted the results by analyzing the relationship on the basis of satisfaction on office environment and pain complaints from respondents' subjective answer. A further study considering various types of office worker groups including public agencies and increasing the number of questionnaire survey participants is expected. Nonetheless, this study has meaning in that it systematically investigated the work characteristics, satisfaction with office environment and the pain complaining ratios of office workers at public agencies having the nature of working in offices all day long. The results are anticipated to be used as basic data for office environment design.
Acknowledgements
This research was financially supported by Hansung University.
References
Baik, S.W., Jeong, B.Y. and Shin, D.S., Worker-Centered Design for Working Area in the Electronic Industry, Journal of the Ergonomics Society of Korea, 33(3), 229-239, 2014.
Burge, P.S., Sick building syndrome. Occupational and Environmental Medicine, 61(2), 185-190, 2004.
Burge, S., Hedge, A., Wilson, S., Bass, J.H. and Robertson, A., Sick building syndrome: a study of 4373 office workers, Annals of Occupational Hygiene, 31(4A), 493-504, 1987.
Jaakkola, M.S. and Jaakkola, J.J., Office equipment and supplies: A modern occupational health concern?, American Journal of Epidemiology, 150(11), 1223-1228, 1999.
Jaakkola, M.S., Yang, L., Ieromnimon, A. and Jaakkola, J.J., Office work exposures and respiratory and sick building syndrome symptoms, Occupational and Environmental Medicine, 64(3), 178-184, 2007.
Jeong, B.Y., Modern Work Management, Minyoungsa, 2015.
Jeong, B.Y. and Yoon, A., Ergonomics of Office Seating and Postures, Journal of the Ergonomics Society of Korea, 33(2), 167-174, 2014.
Jeong, B.Y. and Shin, D.S., Workplace Universal Design for the Older Worker: Current Issues and Future Directions, Journal of the Ergonomics Society of Korea, 33(5), 365-376, 2014.
Jeong, S., Lee, S.Y., Eu, S.M. Kim D.H. and Lee, E.H., Study on the Environmental Factors and Symptoms of VDT Syndrome, Journal of Korean Ophthalmic Optics Society, 14(4), 65-69, 2009.
Kubo, T., Mizoue, T., Ide, R., Tokui, N., Fujino, Y., Minh, P.T., Shirane, K., Matsumoto, T. and Yoshimura, T., Visual display terminal work and sick building syndrome-the role of psychosocial distress in the relationship, Journal of Occupational Health, 48, 107- 112, 2006.
Kwon, K.W. and Park, J.S., Cost Benefit Analysis of Improved Indoor Air Quality in Office Buildings, Journal of the Architectural Institute of Korea, 23(10), 203-212, 2007.
Li, D.W. and Yang, C.S., Fungal contamination as a major contributor to sick building syndrome, Advances in Applied Microbiology, 55, 31-112, 2004.
Passarelli, G.R., Sick building syndrome: An overview to raise awareness, Journal of Building Appraisal, 5, 55-66, 2009.
Reijula, K. and Sundman-Digert, C., Assessment of indoor air problems at work with a questionnaire, Occupational and Environmental Medicine, 61, 33-38, 2004.
Sim, M.J. and Lee, Y.S., A study on the VDT syndrome and relating work factors of office workers, Journal of Korean Society for Health Education and Promotion, 25(3), 95-109, 2008.
Stenberg, B. and Wall, S., Why do women report 'sick building symptoms' more often than men?, Social Science & Medicine, 40(4), 491-502, 1995.
Author listings
Byung Yong Jeong: [email protected]
Highest degree: PhD, Department of Industrial Engineering, KAIST
Position title: Professor, Department of Industrial and Management Engineering, Hansung University Areas of interest: Ergonomics, Safety and Health Management, UX
Dong Seok Shin: [email protected]
Highest degree: BS, Department of Industrial & Management Engineering, Hansung University Position title: MS candidate, Department of Industrial & Management Engineering, Hansung University Areas of interest: Ergonomics, Safety and Health Management, UD
Myoung Hwan Park: [email protected]
Highest degree: PhD, Department of Industrial Engineering, KAIST
Position title: Professor, Department of Industrial and Management Engineering, Hansung University Areas of interest: Operations Management, Innovation Engineering