AJCPP 2008 March 6-8, 2008, Gyeongju, Korea
Effects to the Ejector-jet Performance by the Physical Conditions of Rocket Gas in the RBCC configuration
Susumu Hasegawa, Kouichiro Tani Japan Aerospace Exploration Agency 1 Kimigaya, Kakuda, Miyagi 981-1525, JAPAN
(E-mail: [email protected]) Keywords: CFD, RBCC engine, Ejector-jet Abstract
Rocket Based Combined-Cycle (RBCC) engines are currently being explored as advanced propulsion for space transportation. JAXA has been conducting RBCC engine research by using various experimental facilities. In order to clarify the experimental results and contribute to the improvement of designing, the analysis of the RBCC engine in an ejector-jet mode was carried out using the CFD code developed in-house for unstructured grids. CFD replicated the characteristic flow structures.
The numerical simulation of the pumping performance of the ejector driven by different rocket gases (He, N2, Ar) and physical conditions were performed, and their effects on the performance were studied.
Introduction
Rocket Based Combined-Cycle (RBCC) engines are currently being explored as an advanced propulsion for space transportation. RBCC engines combine elements of rocket and airbreathing propulsion into a single, engine capable of multi-mode operation.
RBCC powered systems can provide significant advantages in range, mission time, weight, payload, load-out, mission profile flexibility, and cost over competing conventional propulsion solutions.
An air-breathing or rocket-based, combined cycle engine extracts oxygen from the atmosphere, so it can reduce the amount of oxygen for combustion on board. It allows the vehicle for more payload at launch, resulting in significant cost savings. At launch, the engine produces the power by specially designed rockets placed in a combustor and gains even more power with secondary combustion with induced air flow. This cycle is called an ejector-jet.
Once the vehicle reaches about Mach 3, the rockets throttle down and the engine uses mainly the oxygen in the atmosphere to burn the fuel (ram/scram mode).
When vehicle’s speed reaches to about Mach 10, the engine works as a conventional rocket-powered system.
RBCC engines are being studied in Kakuda Space Center, a division of Japan Aerospace Exploration Agency (JAXA)1-5. Schematic of the RBCC engine and components are shown in Fig.1. Series of small scale tests of the RBCC engine are currently conducted. As for the ejector-jet mode of RBCC, the model with the rocket exhaust simulation device was constructed and tested in subsonic and transonic regions3-5.
Since the model size was rather small, the data which can be obtained by experiments are limited and not enough to understand phenomena inside the RBCC engine in detail. In order to clarify flow fields inside the RBCC engine and contribute to the improvement of designing, the analysis of the RBCC engine in an ejector-jet mode was carried out using the CFD code developed in-house for unstructured grids. The calculation was conducted on a virtual test bed (VTB) for space engines, known as Numerical Space Engine, constructed on a vector-parallel supercomputer, i.e., NEC SX6. Comparisons were provided between the experiments and calculations in regard with pressure distribution on the top wall. In the small model tests, the rocket exhaust was simulated by room temperature gas, such as N2. However, in actual large-scale combustion tests, the rocket uses high temperature combustion gas produced by H2 / O2 reaction. Thus, effects of gas temperature as well as that of the molecular weight, by employing the different gases (He, N2, Ar) as substitutes of rocket gas, were investigated in order to clarify the ejector performances including choke conditions and suction performance.
Fig.1 Schematic of the RBCC engine
Numerical Simulation Procedure
The numerical method6 on the hybrid unstructured grid, which solves the Reynolds-Averaged Navier-Stokes equations and the species conservation equations, based on the finite volume cell vertex scheme and the LU-SGS implicit time integration algorithm7,8 was used to analyze flow field in the RBCC engine. To eliminate the stiffness problem, the efficient diagonal algorithm for point implicit method was implemented into the unstructured LU-SGS method. The inviscid flux was evaluated by the AUSM-DV scheme9. The second-order spatial accuracy was realized by the linear reconstruction of primitive variables inside the control volume. The viscous flux was evaluated by the central differencing.
One equation turbulence model of the Spalart-Allmaras (SA)10,11 was employed as the turbulence closure. The SA model solves an equation which is dependent on the turbulent viscosity. The model was derived based on empiricism and arguments of Galilean invariance, dimensional analysis and dependence on molecular viscosity. The model includes a wall destruction term that reduces the turbulent viscosity in the laminar sublayer and trip terms to provide smooth transition to turbulence.
Prism and Pyramid grids were distributed near the walls in the computational domain to resolve the boundary layer accurately and efficiently. The height of the prism grids increased in equal ratio, as they were piled up from the wall. Tetrahedron grids covered the other regions in the computational domain.
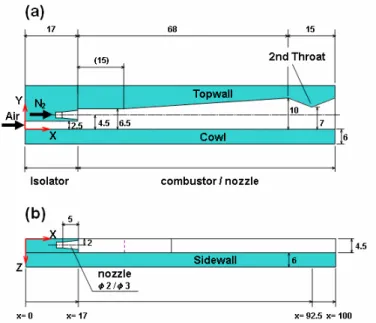
Figure 2 shows components and dimensions of the model which represents the combustor section of
RBCC engine tested experimentally in JAXA5. It consisted of an isolator, a combustor and a nozzle as are shown in the figure, from left to right. Fig.2 (a) shows side view of the engine, and fig. 2(b) shows top view of the engine. In order to predict suction performance, the outside region of the combustor section model was added as computational domain.
The unstructured grid which had approximately 1.13 million tetrahedron grids, 1.04 million prism grids, and 9.4 thousands pyramid grids were constructed.
In the experiments5, nitrogen gas, and helium gas were used as substitutes for rocket exhaust gas, and pressure increment of the second combustion in the downstream part of the engine was simulated by pressure increment by the second throat at the exit of the model. The physical conditions described below for our simulation were equivalent to experimental conditions tested experimentally in JAXA.
The nominal total pressure and the total temperature of the rocket gas nitrogen were 0.6 MPa and 300 K, and numerical boundary condition was given at the rocket throat assuming uniform choking at that point ( i.e. M=1). The Mach number at the exit of the rocket nozzle was approximately 2.33 by one dimensional isentropic calculations.
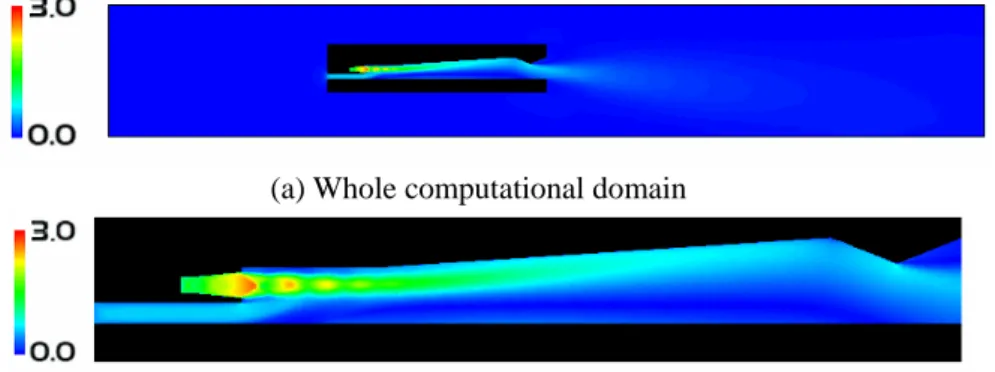
To calculate the pumping performance of the ejector driven by rocket gases, numerical domains were set up both inside and outside domains of the RBCC engine shown in Fig. 3. Fig. 3(a) shows whole computational domain, and Fig. 3(b) shows zoomed domain inside the RBCC engine. The atmospheric condition was imposed for the boundary condition of the outmost area. Its temperature is 300K, and its pressure is 0.101MPa.
Fig. 2 Components and dimensions of the combustor section of the RBCC engine model tested experimentally in JAXA.
(a) Whole computational domain
(b) Zoomed domain inside the engine Fig. 3 Mach number distribution
The Numerical Result and Comparison with Experimental data
In case that the rocket total pressure is 0.6, 1.1, 1.6 MPa, flow fields and suction performance were calculated and the numerical results are shown in the following. The computed Mach number distribution are shown in Fig. 4(a), (b), (c) respectively. Both figures illustrate the quantities on the cross sections in the coordinate of Z=2 mm, which lies on the rocket center line. In Fig.4, the left side is upstream and the right side is downstream.
A Schlieren photograph of the experiment is shown in Fig.5. The oblique shock waves due to nitrogen injection were found on the top wall side.
On the other hand, structures of shock waves were not observed on the cowl side from the Schlieren
photograph. CFD had well replicated the characteristic of the flow structures described above.
From the CFD results, it was found that the induced air flow was subsonic in the combustor section, and it remained so even to the exit of the model. Since the rocket flow was well supersonic, the flow structure was two-layered.
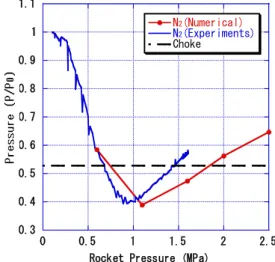
To study the range of pressure which enables the choking of the air flow, the top wall pressures at the end of the isolator were investigated. In current study, in case that the normalized topwall pressure (P/P0) at the end of the isolator is smaller than the choke limit value, the flow condition is defined as choked.
Comparison of the numerical pressure and experimental pressure at the end of the isolator was shown in Fig. 6. It was found that numerical results reasonably simulated suction tendencies.
Fig. 4 Mach Number Distribution (Z=2mm) (b)
(c) (a)
(a) Prkt=0.6, (b) Prkt=1.1, (b) Prkt=1.6
Fig. 5 Schlieren Photograph (Prkt=1.7MPa, N2)
0.3 0.4 0.5 0.6 0.7 0.8 0.9 1 1.1
0 0.5 1 1.5 2 2.5
N2(Numerical) N2(Experiments) Choke
Rocket Pressure (MPa)
Fig. 6 Comparison of the numerical pressure and experimental pressure at the end of the isolator.
Effects of Gas Temperature
To investigate effects of gas temperature, various nitrogen conditions were imposed and calculations were conducted shown in the following.
In case that the nitrogen total pressure are 0.6, 1.6 MPa and temperature are 300, 1000, 2000 K, Mach number distributions were presented in Fig. 7. All figures illustrate the quantities on the cross sections in the coordinate of Z=2 mm, which lies on the rocket center line. In Fig.7, the left side is upstream and the right side is downstream. In both Prkt cases, three could be seen no fundamental difference in all temperature cases.
Figure 8 shows numerical pressure distribution on the top wall on the symmetrical plane. Nitrogen temperature is 300, 1000, 2000K, and total pressure is 0.6, 1.6MPa. In case of Prkt=0.6MPa, pressure distributions on the top wall become smooth in downstream immediately, and flow on the topwall side becomes from supersonic to subsonic. On the other hand, in case of Prkt=1.6MPa, pressure distributions on the top wall become bumpy in downstream, and flow on the topwall side keeps
supersonic. Again, no significant difference was found in each case except the fact that higher temperature gas created slight higher pressure level.
To study the range of rocket pressure which enables the choking of the air flow, the top wall pressure at the end of the isolator was investigated shown in Fig.
9. As temperature becomes higher, the range of Prkt
that enables the choking becomes smaller over the investigated pressure range. Especially, the range in case of total temperature 2000K was very small.
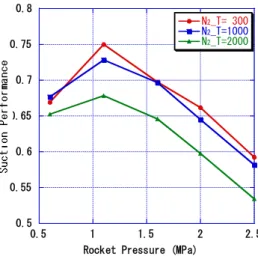
Suction performance was defined mathematically as follows, and it was plotted in Fig.10.
Suction Performance ( )choke
udA u dA
ρ
ρ∫ =
∫
As temperature becomes higher, suction performance becomes worse over the investigated pressure range. Obtained maximum suction performance is approximately 0.75 due to boundary layer and subsonic region on the cowl side.
(a)Prkt=0.6MPa,T0= 300K
(c) T0=2000K
(d)Prkt=1.6MPa,T0= 300K
(e) T0=1000K
(f) T0=2000K (b) T0=1000K
Fig.7 Mach number distribution (Z=2mm)
0.3 0.6 0.9 1.2 1.5 1.8 2.1 2.4
0 20 40 60 80 100
N2_T= 300 Prkt=0.6MPa N2_T=1000 Prkt=0.6MPa N2_T=2000 Prkt=0.6MPa N2_T= 300 Prkt=1.6MPa N2_T=1000 Prkt=1.6MPa N2_T=2000 Prkt=1.6MPa
Pressure(P/P0)
X-coordinate(mm)
Fig.8 Pressure distributions of the top wall
0.35 0.4 0.45 0.5 0.55 0.6 0.65 0.7
0.5 1 1.5 2 2.5
N2_T= 300 N2_T=1000 N2_T=2000 Choke
Rocket Pressure (MPa)
Fig.9 Pressure at the end of the isolator
Fig.10 Suction performance
Effects of Gas Species
To investigate effects of gas species, three gas species including N2, He, Ar were used as substitutes of rocket gas. Calculations were conducted in case of T0=300 K and Prkt=0.6, 1.6MPa for three gas species.
Mach number distributions were represented in Fig.
11. All figures illustrate the quantities on the cross sections in the coordinate of Z=2 mm, which lies on the rocket center line. In Fig.11, the left side is upstream and the right side is downstream. Due to the shift of the ratio of specific heat, Ar and He showed different flow structure inside the rocket gas. The distance of Mach discs appeared in the rocket flow was shorter in Ar or He, and the flow structure
became rapidly obscured comparing to N2 flow.
From Fig.11, however, in a large scale, the subsonic flow structure in the air flow was virtually identical in each gas case.
0.5 0.55 0.6 0.65 0.7 0.75 0.8
0.5 1 1.5 2 2.5
N2_T= 300 N2_T=1000 N2_T=2000
Rocket Pressure (MPa)
Figure 12 shows numerical pressure distribution on the top wall on the symmetrical plane. Driven gas temperature is 300K, and total pressure is 0.6, 1.6 MPa. In case of Prkt=0.6MPa, pressure distributions on the top wall become smooth in downstream immediately, and flow on the topwall side becomes from supersonic to subsonic. Pressure of helium was higher than those of two other gases. In case of Prkt=1.6MPa, nitrogen pressure distributions on the top wall become bumpy in downstream, and flow on the topwall side keeps supersonic. On the other hand, the other two gases pressure distributions change from bumpy profiles to smooth profiles. However, argon, helium on the top wall side remains supersonic in downstream.
To study the range of rocket pressure which enables the choking of the air flow, the top wall pressure at the end of the isolator was investigated shown in Fig.
13. From Fig. 13, helium wasn’t prone to choke compared to other two gases. Argon choked over wider rocket pressure range compared with nitrogen.
Suction performance defined in the previous section was plotted in Fig.14.
The maximum suction performance of nitrogen and argon was same level. Though the suction performance of nitrogen went down sharply as the pressure increases or decreases, the suction performance of argon didn’t go down sharply compared with nitrogen. The suction performance of helium was generally low.
Fig. 11 Mach number distribution
Fig.12 Pressure distributions of the top wall Fig.13 Pressure at the end of the isolator (a) N2_0.6MPa
(b) He_0.6MPa
(e) He_1.6MPa (c) Ar_0.6MPa
(f) Ar_1.6MPa (d) N2_1.6MPa
0.3 0.6 0.9 1.2 1.5 1.8 2.1
0 20 40 60 80 100
N2 Prkt=0.6MPa He Prkt=0.6MPa Argon Prkt=0.6MPa N2 Prkt=1.6MPa He Prkt=1.6MPa Argon Prkt=1.6MPa
Pressure(P/P0)
X-coordinate(mm)
0.35 0.4 0.45 0.5 0.55 0.6 0.65
0.5 1 1.5 2 2.5
N2
HeArgon Choke
Rocket Pressure (MPa)
0.55 0.6 0.65 0.7 0.75
0.5 1 1.5 2 2.5
0.8
N2
He Argon
Rocket Pressure (MPa)
References
Fig.14 Suction performance Conclusion
In order to obtain more reliable performance estimations and to get a better understanding of the RBCC engine characteristics and sensitivities in an ejector-jet mode, numerical simulations were carried out using the CFD code developed in-house for unstructured grids.
CFD replicated the basic flow structures in regard with shock waves on the top wall side and the subsonic flows on the cowl side. The calculated pressures and suction tendency show good agreements with our experiments.
Study of the range of rocket pressure which enables the choking of the air flow was conducted. As temperature becomes higher, the range of Prkt that enables the choking becomes smaller over the investigated pressure range. Especially, the range in case of total temperature 2000K was very small. As temperature becomes higher, suction performance becomes worse over the investigated pressure range.
Obtained maximum suction performance is approximately 0.75 due to boundary layer and subsonic region on the cowl side.
To investigate effects of gas species, three gas species including N2, He, Ar were used as substitutes of rocket gas. The range of rocket pressure which enables the choking of the air flow was investigated.
Helium wasn’t prone to choke compared to other two gases. Argon choked over wider rocket pressure range compared with nitrogen. The maximum suction performance of nitrogen and argon was same level.
Though the suction performance of nitrogen went down sharply, the suction performance of argon didn’t go down sharply compared with nitrogen. The suction performance of helium was low.
Acknowledgement
We thank Takeshi Kanda, Masatoshi Kodera for useful comments and suggestions.
1) Kanda, T., “Conceptual Studies of Combined Cycle Engine, “ Proc. of Asian Joint Conference on Propulsion and Power, 2004,pp. 753-762
2) Kubota, S., Tani, K., and Masuya, G.,
“Aerodynamic Performance of Combined- Cycle Inlet,” 24th International Congress of the Aeronautical Sciences Paper, ICAS 2004-6.1., Yokohama, Japan, Aug.2004.
3) Tani, K., Kanda, T. and Tokutome, S.,
“Aerodynamic Characteristics of the Combined Cycle Engine in an Ejector Jet Mode,” AIAA Paper 2005-1210, Jan. 2005.
4) Aoki, S., Lee, J., Masuya, G., Kanda, T.,and Kudo, K., “Aerodynamic Experiment on an Ejector-Jet“, Journal of Propulsion and Power, Vol.21, No.3, May-June 2005, pp. 496-503.
5) Tani, K., Kato, K., Hasegawa, S., “Flow Visualization in an Ejector-Jet Mode of Combined Cycle Engine,” Proc. of 39th Japanese Congress of Fluid Mechanics.
6) Kodera, M., Sunami, T. and Nakahashi, K.,
“Numerical Analysis of Scramjet Combusting Flows by Unstructured Hybrid Grid Model,” AIAA Paper 2000-0886.
7) Yoon, S. and Jameson, A., “Lower-Upper Symmetric Gauss-Seidel Method for the Euler and Navier-Stokes Equations,” AIAA Journal, Vol. 26, Sept. 1988, pp. 1025-1026.
8) Sharov, D. and Nakahashi, K.,”Reordering of 3D hybrid unstructured grids for vectrorized LU-SGS Navier-Stokes computations, “in Proceedings of the 13th AIAA CFD Conference, Snowmass, CO, June 1997, pp. 131--138. AIAA Paper 97-2102-CP.
9) Wada,Y.,and Liou, M.S., “A Flux Splitting Scheme with High-Resolution and Robustness for Discontinuities,” AIAA Paper, 94-0083, 1994.
10) Spalart,P.R.,and Allmaras, S.R., “A one-equation turbulence model for aerodynamic flow,” AIAA Paper 92-0439.
11) Spalart,P.R.,and Allmaras, S.R., “A one-equation turbulence model for aerodynamic flow,” La Recherche
Appendix Nomenclature M =Mach number P =static pressure
X, Y, Z =Cartesian coordinates, mm Subscript
0 =freestream value rkt =rocket value
Suction Performance ( )choke
udA u dA
ρ
ρ∫ =
∫