Received: June 25, 2020 Revised: September 25, 2020 Accepted: October 12, 2020 Trauma and InJury
Correspondence to Won Young Sung, M.D.
Department of Emergency Medicine, Daejeon Eulji Medical Center, 95 Dun- sanseo-ro, Seo-gu, Daejeon 35233, Korea Tel: +82-42-611-3256
Fax: +82-42-611-3880 E-mail: [email protected]
Comparative Evaluation of Emergency medical Service Trauma Patient
Transportation Patterns Before and after level 1 regional Trauma Center Establishment: a retrospective Single- Center Study
Hyeong Seok Lee, M.D.
1, Won Young Sung, M.D.
1,2, Jang Young Lee, M.D.
1,2, Won Suk Lee, M.D.
1,2, Sang Won Seo, M.D.
11
Department of Emergency Medicine, Daejeon Eulji Medical Center, Daejeon, Korea
2
Department of Emergency Medicine, Eulji Universitiy, School of Medicine, Daejeon, Korea
Purpose: This study examined emergency medical service (EMS) transportation pat- terns for adult trauma patients before and after establishing a level 1 regional trauma center (RTC) and to evaluate the transportation approach after prehospital severity screening.
methods: This was a retrospective observational study of trauma patients aged ≥18 years admitted via EMS to the emergency department or a level 1 RTC, 1 year before to 3 years after RTC establishment. Patients with an Injury Severity Score (ISS) in the patient registration system were selected. Analyses were performed to determine trans- portation pattern changes by comparing patients pre- and post-RTC establishment and by yearly comparisons over the 4-year study period using the Mann-Whitney U test and chi-square test.
results: Overall, 3,587 patients were included. The mean ISS was higher in the post- RTC group (n=2,693; 10.63±8.90, median 9.00) than in the pre-RTC group (n=894;
9.44±8.20, median 8.00; p<0.001). The mean transportation distance (9.84±13.71, me- dian 5.80 vs. 13.12±16.15 km, median 6.00; p<0.001) was longer in the post-RTC group than in the pre-RTC group. Furthermore, proportionally fewer patients were trans- ported from an area in the same city as the RTC after establishment (86.1% vs. 78.3%;
p<0.001). Yearly comparisons revealed a gradually increasing trend in the hospital death rate (p
trend=0.031).
Conclusions: After establishing a level 1 RTC, the EMS transportation of severe trau- ma patients increased gradually along with the long-distance transportation of minor trauma patients. Therefore, improved prehospital EMS trauma severity assessments and level 1 RTC involvement in patient classification in the prehospital phase are necessary.
Keywords: Wounds and injuries; Trauma centers; Emergency medical services;
Transportation
INTRODUCTION
Trauma, the eighth main cause of death worldwide, is also a major cause of death in the Republic of Korea [1].
Particularly, in young people (10 to 30 years of age), in- tentional self-harm (suicide) and road traffic accidents are the top two causes of death [2]. Trauma causes socioeco- nomic losses owing to serious sequelae and delayed return to daily life [3]. The 2009–2010 rate of preventable trau- ma fatalities in the Republic of Korea was 29.8%, a level higher than those of other developed countries (10–20%), and this discrepancy spurred the establishment of level 1 regional trauma centers (RTCs) in Korea [4]. In 2012, in support of level 1 RTCs, a project was initiated to establish such centers equipped with appropriate facilities, equip- ment, and manpower. This project aimed at providing severe trauma patients with optimal treatment (including emergency surgery) within 24 hours after hospital arrival, 365 days per year. By evenly distributing Korea’s RTCs such that treatment can commence for trauma patients within an hour of arrival, it was expected that the pre- ventable trauma fatality rate could be reduced to <20% [3].
By 2020, 15 level 1 RTCs were being operated in Korea.
Governmental efforts have focused on establishing a stan- dard operating system for RTCs by reviewing RTC opera- tion criteria, as well as by conducting operational-level ex- aminations. Since level 1 RTCs are established to provide intensive treatment to a unique group of severe trauma patients, the scope and type of services should differ from those of emergency departments (EDs).
Severe trauma patients, who comprise the primary patient group treated at level 1 RTCs, are transported via emergency medical services (EMS; in Korea EMS include 119 emergency medical technicians, who provide primary care at the prehospital stage and during transportation to the hospital). To provide optimal treatment, RTCs need to be organically and independently operated. However, EMS personnel must understand that level 1 RTCs should provide specialized treatment to trauma patients only, unlike the broader range of services provided in the ED. A misunderstanding also exists that a regional trauma system can be operated simply by establishing trauma centers.
Due to these misconceptions, the number of minor trau- ma patients at level 1 RTCs has continued to increase [5].
Thus, to prevent problems from arising, EMS must actively transport severe trauma patients to level 1 RTCs and distribute the transportation of uncomplicated minor trauma patients. Furthermore, it is necessary to compare EMS transportation before and after level 1 RTC estab- lishment. However, no previous study anywhere in the world has compared EMS trauma patient transportation before and after level 1 RTC establishment. Accordingly, this study aimed to compare the EMS transportation pat- terns of trauma patients (including adult trauma patients with injuries of various severity transported by EMS, patient transportation time and distance, and the area the patient was transported from) before and after level 1 RTC establishment.
METHODS
Study design and setting
The regional trauma center where the study was con- ducted is located in the center of a metropolitan city with a population of about 1.47 million and an area of about 68 km
2. There are 26 EMS centers in the city and 962 paramedics are active. The city has two regional emergen- cy medical centers, four local emergency medical centers, and five local emergency medical facilities. The hospital that conducted the study consists of an RTC and a local emergency medical center, and all trauma patients visiting the center are treated by the RTC medical staff. The cen- ter does not operate helicopter services.
This retrospective study was conducted on trauma pa- tients aged ≥18 years transported via EMS and admitted to the ED before RTCs were established (the ED pro- vided support before the establishment of level 1 RTCs through the governmental project) or at the level 1 RTC after it was established. The study was approved by the Institutional Review Board of the Daejeon Eulji Medical Center (IRB No. 2019-07-001), and the requirement for informed consent was waived.
Selected trauma patients were identified using the hos-
pital trauma registration system as having come to the
ED (via EMS within 1 year before establishment of the
level 1 RTC), or to the RTC (via EMS within 3 years after
establishment), and had an Injury Severity Score (ISS) in
the registration system. Exclusion criteria were as follows:
those transferred by helicopter, those transferred from another hospital to the ED or to a level 1 RTC after initial EMS transportation to that hospital first; those who died immediately after arriving at the ED or the RTC (render- ing it impossible to estimate the ISS), and those for whom information was missing from the prehospital care re- ports (on transportation time, transportation distance, or on the area the patient was transported from).
Data collection and classification
Data on age, sex, the mechanism of trauma, and death were collected from patients’ medical charts. The ISS was obtained from data collected and organized by the trauma coordinators at the trauma center. The ISS was not mea- sured for patients discharged after treatment at the ED or RTC. Information on transportation time and distance, as well as the area the patient was transported from, was obtained by reviewing prehospital care reports. When pa- tients were transferred from the metropolitan city where the center is located, they were classified as coming from
“downtown”, while other areas were classified as “out of town”.
The mechanism of trauma, specified in the medical charts, was categorized into one of the following 10 groups based on the Korea Triage and Acuity Scale: traffic accident involving four-wheeled motor transportation (passenger car, van, jeep, truck, and bus); traffic accident involving two-wheeled motor transportation (including motorcycle); traffic accident involving non-motorized transportation (including bicycle); other traffic accidents;
falls; slip down; blunt injury; penetrating injury; injury caused by a machine; other types of trauma; and trauma of unknown cause. The area where the patient was trans- ported from was classified as in or outside the city of the RTC location. Transportation time was estimated in min- utes based on the interval between EMS contact time with the patient and arrival time at the RTC. Transportation distance was measured in driving distance in kilometers, between the reporting address received by the EMS and the RTC. ISS <15 or ≥15 points were classified as minor and severe trauma, respectively.
Data analysis
In this article, continuous variables are presented as means±standard deviations with median values, and categorical variables as percentages (%). Two approaches were used to classify patients into groups for the analysis.
The first approach compared patients before and after the establishment of the level 1 RTC. In this approach, the pre-RTC group consisted of patients admitted to the ED 1 year before RTC establishment, while those in the RTC group were admitted to the RTC within 3 years of its es- tablishment. Continuous and categorical data were com- pared using the t-test and chi-square analysis, respectively.
For continuous variables that were not normally distrib- uted, the Mann-Whitney U test was used for comparison.
The goal of the second approach was to compare the 1-year period before RTC establishment with three 1-year intervals post-RTC establishment. Thus, four groups were formed. Group A included patients who were admitted to the ED within 1 year before RTC establishment while groups B, C, and D included those who were admitted to the RTC in years 1, 2, and 3, respectively, after its es- tablishment. Between-group differences in age, ISS, and transportation time and distance were examined using one-way analysis of variance, while between-group dif- ferences in sex, number of hospital deaths, area where the patients were transported from, and the number of minor and severe trauma patients were examined using the chi- square test. Trends were analyzed using the Cochran-Ar- mitage trend test.
For all analyses, 95% confidence intervals were calcu- lated, and differences were considered to be statistically significant if the p-value was <0.05. Data analysis was per- formed using SPSS version 24 (IBM Corp., Armonk, NY, USA) and R software version 3.6.0 (R Project for Statisti- cal Computing., Vienna, Austria).
RESULTS
Study population
Over the 4-year study period, of the 19,395 trauma pa-
tients admitted, 2,404 patients were <18 years old and
227 died either in the resuscitation room of the ED or the
RTC. A total of 12,966 patients with no ISS scores were
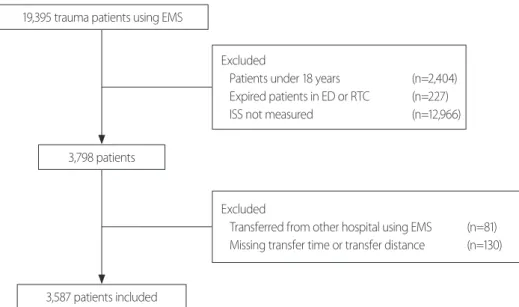
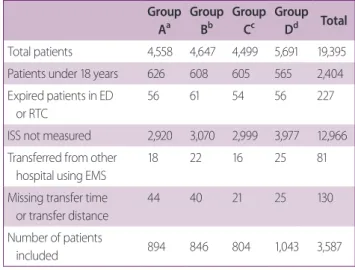
excluded. Of the 3,798 patients with ISS, 81 who were transferred from another hospital and 130 with missing information (on transportation time and distance) were also excluded. Finally, 3,587 patients were included as the study subjects (Fig. 1). The total number of patients and excluded patients according to the criteria for each group (A, B, C and D) are shown in Table 1.
COMpaRISONS bEfORE aND afTER RTC ESTabLISHMENT
General comparison
Of the 3,587 patients, 894 and 2,693 were in the pre- RTC and RTC groups, respectively. The patients in the RTC group had a higher mean age (53.68±19.00 years, median 53.00 years vs. 55.80±19.12 years, median 57.00 years; p=0.004); mean ISS (9.44±8.20, median 8.00 vs.
10.63±8.90, median 9.00; p<0.001); mean transportation time (22.24±14.25 minutes, median 19.00 vs. 24.19±16.22 minutes, median 20.00 minutes; p=0.001); and mean transportation distance (9.84±13.71 km, median 5.80 km vs. 13.12±16.15 km, median 6.00 km; p<0.001) than those in the pre-RTC group. The proportion of men was higher than that of women in both groups (57.6% vs. 61.5%;
p=0.038). Other characteristics are shown in Table 2.
Comparison of characteristics by RTC and ISS groups Significantly different proportions of minor (ISS <15) and severe (ISS ≥15) trauma patients were observed in the pre-RTC and RTC groups, with a higher proportion of severe trauma patients in the RTC group (18.8% vs.
23.2%; p=0.006) (Table 3).
Among the minor trauma patients, the RTC group had higher mean ISS (6.16±3.69, median 5.00 vs. 6.59±3.41, median 5.00; p=0.010) and transportation distance (9.55±12.26 km, median 5.45 km vs. 12.49±15.90 km, median 6.00 km; p<0.001) than the pre-RTC group, while the hospital death rate was lower in the RTC group (p=0.005) (Table 3). In the severe trauma patient group, the RTC group had a higher hospital death rate (p=0.044) and mean transportation distance (9.08±10.89 km, medi- an 6.00 km vs. 15.04±17.88 km, median 7.00 km; p<0.001;
however, no significant between-group differences were found in the mean ISS (23.62±7.17, median 22.00 vs.
24.01±8.33, median 22.00; p=0.921) and mean transpor- tation time (20.79±12.89 minutes, median 18.00 minutes vs. 24.65±17.38 minutes, median 19.00 minutes; p=0.069) (Table 3).
Comparison by accident district
Pre- and post-RTC comparisons were made based on the area from which patients were transported (downtown
Fig. 1. Flowchart of patient selection. EMS: emergency medical service, ED: emergency department, RTC: regional trauma center, ISS: Injury Severity
Score.
19,395 trauma patients using EMS
Excluded
Patients under 18 years (n=2,404) Expired patients in ED or RTC (n=227)
ISS not measured (n=12,966)
Excluded
Transferred from other hospital using EMS (n=81) Missing transfer time or transfer distance (n=130) 3,798 patients
3,587 patients included
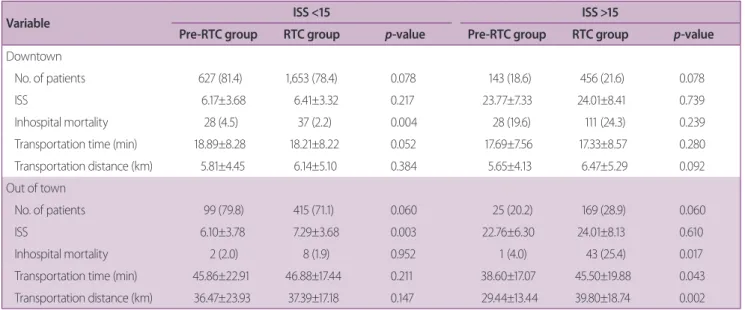
or out of town). For the downtown group, mean age (53.49±19.23 years, median 53.00 years vs. 55.22±19.47 years, median 56 years; p=0.024) and mean ISS (9.44±8.24, median 8.00 vs. 10.21±8.74, median 9.00; p=0.035) were higher in the RTC group; however, in the RTC group, the mean transportation time was lower (18.67±8.16 minutes, median 17.00 vs. 18.02±8.30 minutes, median 16.00 min- utes; p=0.022). The hospital death rate (p=0.813) and the mean transportation distance (5.78±4.39 km, median 5.00 km vs. 6.21±5.13 km, median 5.00 km; p=0.113) did not differ significantly between groups (Table 4).
For those transported from out of town, the RTC group showed a higher mean ISS (9.46±8.01, median 8.00 vs.
12.13±9.29, median 9.00; p<0.001), higher hospital death rate (p=0.016), and higher mean transportation distance (35.05±22.35 km, median 30.00 km vs. 38.09±17.67 km, median 34.00 km; p=0.006). However, mean age (54.91±17.48 years, median 55.00 years vs. 57.91±17.65 years, median 59.00 years; p=0.085) and mean trans- portation time (44.40±21.99 minutes, median 41.00 vs.
46.48±18.17 minutes, median 43.00 minutes; p=0.064) did not differ significantly between groups (Table 4).
Comparison of characteristics by RTC group, ISS, and accident district
The proportion of downtown patients (transported from an area in the same city as the RTC) with severe trauma (ISS ≥15) was similar in the pre-RTC and RTC groups (18.6% vs. 21.6%; p=0.078). Further, none of the charac- teristics (ISS, hospital death rate, transportation time, and distance) showed significant between-group differences (p>0.05 for all). In the downtown patients with minor trauma (ISS <15), the hospital death rate was significantly lower in the RTC group (4.5% vs. 2.2%; p=0.004). No
Table 1. Characteristics of patients in each group by year
GroupAa
Group Bb
Group Cc
Group Dd Total
Total patients 4,558 4,647 4,499 5,691 19,395 Patients under 18 years 626 608 605 565 2,404 Expired patients in ED
or RTC
56 61 54 56 227
ISS not measured 2,920 3,070 2,999 3,977 12,966 Transferred from other
hospital using EMS
18 22 16 25 81
Missing transfer time or transfer distance
44 40 21 25 130
Number of patients
included 894 846 804 1,043 3,587
ED: emergency department, RTC: regional trauma center, ISS: Injury Severity Score, EMS: emergency medical service.
a
Patients who were admitted to the ED within 1 year of RTC establish- ment.
b
Patients who were admitted to the RTC in year 1.
c
Patients who were admitted to the RTC in year 2.
d
Patients who were admitted to the RTC in year 3.
Table 2. Comparison of baseline characteristics in the pre- RTC and RTC groups
Variable
Pre-RTC group (n=894)
RTC group
(n=2,693) p-value
Age (years) 53.68±19.00 55.80±19.12 0.004
Gender 0.038
Men 515 (57.6) 1657 (61.5)
Women 379 (42.4) 1,036 (38.5)
Injury Severity Score 9.44±8.20 10.63±8.90 <0.001 Inhospital mortality 59 (6.6) 199 (7.4) 0.084 Transportation time (min) 22.24±14.25 24.19±16.22 0.001 Transportation distance (km) 9.84±13.71 13.12±16.15 <0.001
Accident district <0.001
Downtown 770 (86.1) 2,109 (78.3)
Out of town 124 (13.9) 584 (21.7)
Mechanism of injury 0.422
Traffic accident
Car, van, jeep, truck, bus 138 (15.4) 427 (15.9)
Motorcycle 89 (10.0) 279 (10.4)
Bicycle 58 (6.5) 169 (6.3)
Other 121 (13.5) 329 (12.2)
Slip down 196 (21.9) 670 (24.9)
Fall down 147 (16.4) 435 (16.2)
Blunt injury 50 (5.6) 110 (4.1)
Penetrating injury 48 (5.4) 117 (4.3)
Machine 11 (1.2) 42 (1.6)
Other and unknown 36 (4.0) 115 (4.3) Values are presented as mean±standard deviation or number (%).
RTC: regional trauma center.
Table 3. Comparison of ISS characteristics in the pre-RTC and RTC groups
Variable ISS <15 ISS >15
Pre-RTC group RTC group p-value Pre-RTC group RTC Group p-value
No. of patients 726 (81.2) 2,068 (76.8) 0.006 168 (18.8) 625 (23.2) 0.006
ISS 6.16±3.69 6.59±3.41 0.010 23.62±7.17 24.01±8.33 0.921
Inhospital mortality 30 (4.1) 45 (2.2) 0.005 29 (17.3) 154 (24.6) 0.044
Transportation time (min) 22.17±13.09 24.06±16.12 0.309 20.79±12.89 24.65±17.38 0.069
Distance of transportation (km) 9.55±12.26 12.49±15.90 <0.001 9.08±10.89 15.04±17.88 <0.001 Values are presented as mean±standard deviation or number (%).
ISS: Injury Severity Score, RTC: regional trauma center.
Table 4. Age, ISS, in-hospital mortality, transportation time, and distance of transportation based on accident district in the pre-RTC and RTC groups
Variable Downtown Out of town
Pre-RTC group RTC group p-value Pre-RTC group RTC group p-value
No. of patients 770 (86.1) 2,109 (78.3) <0.001 124 (13.9) 584 (21.7) <0.001
Age (years) 53.49±19.23 55.22±19.47 0.024 54.91±17.48 57.91±17.65 0.085
Injury Severity Score 9.44±8.24 10.21±8.74 0.035 9.46±8.01 12.13±9.29 0.001
Inhospital mortality 56 (7.3) 148 (7.0) 0.813 3 (2.4) 51 (8.7) 0.016
Transportation time (min) 18.67±8.16 18.02±8.30 0.022 44.40±21.99 46.48±18.17 0.064
Distance of transportation (km) 5.78±4.39 6.21±5.13 0.113 35.05±22.35 38.09±17.67 0.006
Values are presented as mean±standard deviation or number (%) RTC: regional trauma center.
Table 5. Comparison of ISS characteristics based on accident district in the pre-RTC and RTC groups
Variable ISS <15 ISS >15
Pre-RTC group RTC group p-value Pre-RTC group RTC group p-value
Downtown
No. of patients 627 (81.4) 1,653 (78.4) 0.078 143 (18.6) 456 (21.6) 0.078
ISS 6.17±3.68 6.41±3.32 0.217 23.77±7.33 24.01±8.41 0.739
Inhospital mortality 28 (4.5) 37 (2.2) 0.004 28 (19.6) 111 (24.3) 0.239
Transportation time (min) 18.89±8.28 18.21±8.22 0.052 17.69±7.56 17.33±8.57 0.280
Transportation distance (km) 5.81±4.45 6.14±5.10 0.384 5.65±4.13 6.47±5.29 0.092
Out of town
No. of patients 99 (79.8) 415 (71.1) 0.060 25 (20.2) 169 (28.9) 0.060
ISS 6.10±3.78 7.29±3.68 0.003 22.76±6.30 24.01±8.13 0.610
Inhospital mortality 2 (2.0) 8 (1.9) 0.952 1 (4.0) 43 (25.4) 0.017
Transportation time (min) 45.86±22.91 46.88±17.44 0.211 38.60±17.07 45.50±19.88 0.043
Transportation distance (km) 36.47±23.93 37.39±17.18 0.147 29.44±13.44 39.80±18.74 0.002 Values are presented as mean±standard deviation or number (%).
ISS: Injury Severity Score, RTC: regional trauma center.
other characteristic was significantly different between the groups (p>0.05) (Table 5).
Among the out-of-town patients, the proportion of se- vere trauma patients did not differ between the pre-RTC and RTC groups (20.2% vs. 28.9%; p=0.060). However,
in out-of-town patients with severe trauma (ISS ≥15), the RTC group showed a significantly higher hospital death rate (4.0% vs. 25.4%; p=0.017), a significantly longer mean transportation time (38.60±17.07 minutes, median 35.00 vs. 45.00±19.88 minutes, median 40.00 minutes;
Pre-RTC group
1 (3.4) 3 (1.9) 2 (1.3)
16 (55.2) 123 (79.9)
Head/neck Thorax Abdomen Extremity Hip/pelvic 8 (27.6)
16 (10.4) 10 (6.5)
4 (13.8)
RTC group
Fig. 2. Pie chart showing a comparison of causes of death in hospitals by the affected body region between the pre-RTC group and RTC group. Values
are presented as number (%). RTC: regional trauma center.
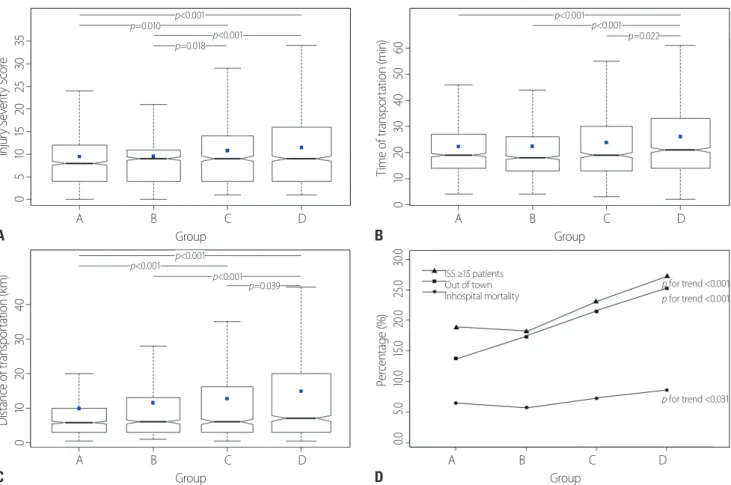
p<0.001
p=0.018 p<0.001 p=0.010
Injury Severity Score 0 5 101520253035
A A B Group C D
p<0.001
p=0.039 p<0.001 p<0.001
Distance of transportation (km) 0 10203040
C A B Group C D
p for trend <0.001 p for trend <0.001
p for trend <0.031 ISS ≥15 patients
Out of town Inhospital mortality
Percentage (%) 0.05.010.0 15.0 20.0 25.0 30.0
D A B Group C D
p<0.001
p=0.022 p<0.001
Time of transportation (min) 0 102030405060
B A B Group C D
Fig. 3. Yearly comparisons between groups. Box plots (point, mean: flat line, median) of (A) Injury Severity Score, (B) transportation time (min), (C) trans-