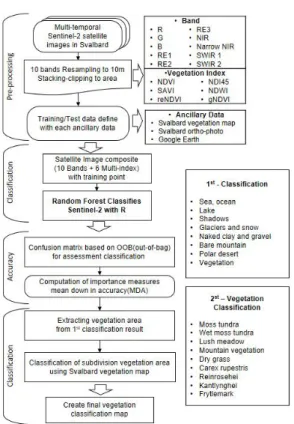
랜덤포레스트와 Sentinel-2를 이용한 식생 분류의 입력특성 최적화*
이승민
1·정종철
2※Optimization of Input Features for Vegetation Classification Based on Random Forest and
Sentinel-2 Image*
Seung-Min LEE
1·Jong-Chul JEONG
2※1)
요 약
최근 북극은 매년 영구 동토층이 녹아 눈으로 덮인 땅이 드러나고 있어 해당 지역 관리를 위한 공간정보가 필요하다. 한국의 국토지리정보원(NGII)은 극지방의 공간정보를 구축하여 극지공간정 보 서비스를 제공하고 있으나, 식생 정보는 제공되지 않고 있으므로 식생 공간정보 구축을 위한 추가적인 연구가 필요하다. 본 연구에서는 북극 스발바르제도의 뉘올레순 지역에 대한 식생 분류 를 수행하기 위해 다중 시기의 Sentinel-2 영상을 사용하였다. 전처리 단계에서는 다중 시기 Sentinel-2 영상으로부터 10개 밴드와 6가지 정규 지수식을 생성하였다. 영상 분류는 8개 속성 에 대한 토지피복분류를 통해 전체 식생 영역을 추출하는 과정과 전체 식생 영역 내에서 다시 세 분류를 수행하는 과정으로 이루어졌다. 영상 분류 알고리즘은 OOB(Out-Of-Bag)를 통해 정확도 평가 및 변수 중요도를 산정할 수 있는 랜덤포레스트를 사용하였다. 전체 정확도는 다시기 영상이 사용되었을 경우와 식생 지수가 추가되었을 경우의 이점을 확인하기 위해 사용된 영상 수에 따라 각각 정확도를 산정하였다. 단일시기의 Sentinel-2 영상은 전체 정확도가 77%였으나, 7개의 다 중 시기 Sentinel-2 영상을 기반으로 학습하였을 때, 81%로 향상되었다. 또한, 식생 지수가 추가 로 사용된 학습에서 전체 정확도가 약 83%로 향상되었다. 식생 분류 시 변수 중요도는 적색, 녹 색, 단파적외선-1 밴드가 가장 높은 변수로 선정되었다. 본 연구는 극지방의 식생에 대한 분류를 수행할 시 입력특성을 최적화하는 기초 연구로 활용될 수 있을 것으로 판단된다.
2020년 08월 29일 접수 Received on August 29, 2020 / 2020년 11월 05일 수정 Revised on November 05, 2020 / 2020년 11월 6일 심사완료 Accepted on November 06, 2020
* 본 연구는 2019년 정부(국토교통부)의 재원으로 공간정보 융복합 핵심인재 양성 사업의 지원을 받아 수행된 연구임(2019-02-03)
1 남서울대학교 공간정보공학과 석사과정 Master Student, Dept. of Geoinformatics Engineering, Namseoul University
2 남서울대학교 공간정보공학과 교수 Professor, Dept. of Geoinformatics Engineering, Namseoul University
※ Corresponding Author E-mail : [email protected]
주요어 : 랜덤포레스트, Sentinel-2, 다중 시기 영상, 스발바르, 분류
ABSTRACT
Recently, the Arctic has been exposed to snow-covered land due to melting permafrost every year, and the Korea Geographic Information Institute(NGII) provides polar spatial information service by establishing spatial information of the polar region.
However, there is a lack of spatial information on vegetation sensitive to climate change.
This research used a multi-temporal Sentinel-2 image to perform land cover classification of the Ny-Ålesund in Arctic Svalbard. In the pre-processing step, 10 bands and 6 vegetation spectral index were generated from multi-temporal Sentinel-2 images. In image-classification step is consisted of extracting the vegetation area through 8-class land cover classification and performing the vegetation species classification. The image classification algorithm used Random Forest to evaluate the accuracy and calculate feature importance through Out-Of-Bag(OOB). To identify the advantages of multi- temporary Sentinel-2 for vegetation classification, the overall accuracy was compared according to the number of images stacked and vegetation spectral index. Overall accuracy was 77% when using single-time Sentinel-2 images, but improved to 81% when using multi-time Sentinel-2 images. In addition, the overall accuracy improved to about 83% in learning when the vegetation index was used additionally. The most important spectral variables to distinguish between vegetation classes are located in the Red, Green, and short wave infrared-1(SWIR1). This research can be used as a basic study that optimizes input characteristics in performing the classification of vegetation in the polar regions.
KEYWORDS : Random forest, Sentinel-2, Multi-temporal, Svalbard, Classification
서 론
최근 북극은 과학연구, 항로개척, 자원개발, 안보 등이 이슈로 떠오르고 있으며 북극해 연안 국뿐만 아니라 우리나라와 같은 북극해 비 연안 국에서도 북극 지역에 관한 관심이 집중되고 있 다(Kim and Chae, 2019). 우리나라는 2013년 5월 북극이사회 영구 옵서버 자격을 획득하였으 며, 관계부처 합동으로 북극 정책 기본계획(201 3.12)을 수립하며 북극 정책을 위해 다양한 노 력을 하고 있다(National Geographic Information Institute, 2018). 하지만 북극 연안국들은 자국 의 영유권 강화, 경제적 가치를 이유로 북극 연 안 공간정보 제공을 비공개로 하고 있다. 또한,
북극의 기후 변화를 분석하기 위해서는 식생에 대한 공간정보가 필요하지만, 국내의 국토정보 플랫폼에서 제공하고 있는 극지공간정보는 식생 정보가 없는 기초적인 토지피복지도만을 제공하 고 있어 개선이 필요하다. 스발바르 지역은 고 위도 북극 해안 지역으로 일 년 중 8개월에 가 까운 기간 동안 영하의 온도를 기록하고 있지 만, 점점 그 기간이 줄어들고 있으며 영구 동토 층의 녹는 현상이 발생하였다(The Local, 201 7). 이에 따라 눈으로 뒤덮여 있던 지역은 숨겨 져 있던 식생 지역이 드러나게 되었다. 장기간 눈으로 덮여 있던 지역의 식생은 높은 확률로 갈변된 낙엽수 형태를 나타낼 가능성이 높다(E pstein et al., 2016). 특히 스발바르제도는 멸 종 위기의 식생을 포함한 다양한 종류의 식생이
분포하고 있어 이에 대한 모니터링이 요구된다 (Johansen et al., 2012).
스발바르제도의 뉘올레순에는 국내 연구기지 인 다산 과학기지가 존재하고 있을 뿐만 아니라 지표 분석, 식생 변화에 관한 다양한 연구가 진 행되고 있다(Salvatori et al., 2005; Karisen et al., 2014; Chi et al., 2017). 이러한 극지 방에서는 비 접근 지역의 특징을 나타내고 있어 서 참조데이터로 사용하기 위한 벡터 데이터나 현장 탐사를 통해 데이터를 구축하는데 어려움 이 따른다. 위성영상을 사용한 원격탐사는 이러 한 낮은 접근성의 극지 지표면을 분석하기에 적 합한 데이터다(Chen et al., 2017; Langford et al., 2018). 특히, 다중 분광 위성영상은 정 규 스펙트럼 지수식(Spectral index ratio:SIR) 을 생성할 수 있기 때문에 토지 특성을 추출하 기에 적합하다. Maglione et al.(2014)는 수역 을 추출할 수 있는 정규수분지수(Normalized Difference Water Index:NDWI)와 식생을 추 출할 수 있는 정규식생지수(Normalized Difference Water Index: NDVI)를 사용하여 해안선에 존재하는 수역과 식생을 효과적으로 분류하였다.
Sentinel-2 위성은 시간 해상력이 10일이며, 2A 위성과 2B 위성을 동시에 고려했을 경우 4 일~5일 주기이기 때문에 비 접근 지역을 촬영 하기에 유용할 수 있다. 또한, Sentinel-2는 13개의 다중 분광 센서를 가졌기 때문에 토지분 류를 수행하기 적합하다(Nguyen et al., 2020).
국외의 연구자들은 Sentinel-2를 사용하여 토 지를 분류한 연구를 진행하였지만(Ettehadi et al., 2019; Immitzer et al., 2019), 이는 저위 도~중위도 지방을 대상으로 진행한 연구이며 북극과 같은 극지방을 대상으로 분류한 사례는 부족하다.
Jawak and Luis(2014)는 남극의 호수를 분 류하기 위해 WorldView-2의 8개 밴드로 생성 된 4가지 NDWI 지수에 대한 임계값을 산정한 사례가 있다. 또한, 호수 영역 추출에 대한 정확 도를 향상시키기 위해 5가지 Pan-sharpening 기법에 대해 시험하여 최적의 호수 추출 반자동
알고리즘을 연구하였다. 하지만 호수에 해당하 는 단일 클래스만 고려한 점과 영구 동토가 감 소하여 식생 및 토지, 수역 등이 공존할 경우를 고려하지 못하였다.
김상일 외(2013)는 남극 바톤 반도를 촬영한 KOMPSAT-2를 활용하여 식생과 비 식생 지 역을 분류하였지만, 식생 종 분류에는 낮은 정 확도를 보였다. Johansen et al.(2012)에 따르 면 연구 대상지인 스발바르제도의 식생 지역은 이끼류, 지의류와 같이 좁은 범위의 식생이 대 다수일 뿐만 아니라, 자갈과 모래가 널리 분포 하고 있으므로 토지분류를 수행하였을 때 오분 류가 발생할 확률이 높다고 하였다. Hościło and Lewandowska(2019)는 다양한 식생 종을 구분하는 데 있어 정확도를 개선하기 위해 전체 식생 지역을 분류한 뒤 식생 세분류를 하는 계 층화된 방법을 활용하였다.
기계학습 알고리즘은 최근의 연구 결과를 통 해 위성영상을 분류하는 데 있어서 우수한 성능 을 나타내고 있는 것으로 밝혀졌다(Lee et al., 2015; Jeon et al., 2020). 하지만 극지방의 식생 환경을 대상으로 기계학습을 이용한 위성 영상 분류 사례는 매우 적다.
본 연구에서는 다분광 위성영상인 Sentinel-2 를 이용하여 스발바르제도의 영상 분류를 수행 하고 식생 지역을 추출하여 극지 공간정보를 구 축하기 위한 기초 연구를 하는 데 목적이 있다.
본 연구에서 제안된 방법은 극지방의 토지분류 를 위한 방법이 될 수 있으며 특히, 이끼류와 지의류 기반으로 존재하는 지역을 효과적으로 추출하기 위한 기준이 될 수 있다.
연구방법
1. 연구 대상지 및 자료
본 연구의 연구 대상지는 노르웨이 북극 지역 인 스발바르(Svalbard) 군도에 다산 과학기지 가 설치된 스피츠베르겐(Spitsbergen)섬의 뉘 올레순(Ny-Ålesund) 이다(그림 1). 본 연구에 서 사용된 영상은 Sentinel-2로 유럽우주국
FIGURE 1. Study area and location of Ny-Ålesund, Svalbard Arctic. The image is Sentinel-2 on Aug 2nd, 2016
Imagery Acquisition Date Bands Wave length(㎛) Resolution Dynamic Range
Sentinel-2A
2016.08.02.
2017.07.31.
2018.07.03.
2018.08.20 2019.07.27.
2019.08.10
Band 2 : Blue 0.45~0.55 10m
12bit
Band 3 : Green 0.54~0.58 10m
Band 4 : Red 0.65~0.68 10m
Band 5 : Red edge 1 0.69~0.72 20m Band 6 : Red edge 2 0.72~0.76 20m Band 7 : Red edge 3 0.76~0.80 20m
Band 8 : NIR 0.76~0.91 10m
Band 8a : Narrow NIR 0.84~0.88 20m
Band 11 : SWIR 1 1.52~1.70 20m
Sentinel-2B 2018.07.08.
Band 12 : SWIR 2 2.07~2.31 20m
Data scale Date Attribute Usage
Land cover map 1:100,000 2017 22 classes Training and reference data
Svalbard ortho-photo 1:625 2008 0.167m resolution Training and reference data
TABLE 1. Data source and information (European Space Agency: ESA)에서 진행하 는 코페르니쿠스 지구관측 임무(Copernicus Program)를 위해 발사된 두 개의 위성이다.
Sentinel-2 위성은 12bit의 다중 분광 센서 (Multi Spectral Imaging : MSI)를 통해 10~
60m인 가시광선, NIR 밴드와 20m의 공간해상 력을 가진 단파 적외선(SWIR) 밴드를 제공하 고 있기 때문에 눈, 수역, 식생이 분포하고 있는 극지방에서 효과적으로 사용할 수 있다. ESA Standard Document(2015)에 따르면, 60m의
공간해상력을 가진 B1(coastal aerosol), B9 (water vapour), B10(cirrus) 밴드는 지구 표 면에 대한 분광 정보를 제공하는 것이 아니라 대기 및 수증기의 영향을 강하기 받기 때문에 토지 분석에는 적합하지 않다고 나타났다.
따라서 본 연구에서는 60m 공간해상력을 가 진 3개 밴드를 제외하고 10m 공간해상력의 가 시광선 및 근적외선 밴드와 20m 공간해상력의 적외선 및 단파 적외선 밴드를 포함한 총 10개 밴드를 사용하였다. 영상의 촬영 시기는 2016
FIGURE 3. Workflow diagram of separating vegetation area with four main step.
(a) (b)
FIGURE 2. Ancillary data used as aid for generating classifier-training data.
(a) Land cover map (b) Svalbard ortho-photo
년~2019년 사이에서 눈으로 덮인 면적이 가장 적은 7월~8월 영상을 사용하였다(표 1). 본 연 구에서는 훈련지역 선정 시 참조데이터로 활용 하기 위해 노르웨이 극지 연구소(Norwegian polar institute: NPI)에서 제공하는 고해상도 정사 영상과 토지피복도를 사용하였다(그림 2).
고해상도 정사 영상은 0.167m의 해상도의 래스 터 데이터이고, 토지피복도는 2017년에 갱신되어 스발바르제도 전체를 대상으로 하는 1:100,000 지도이다.
2. 연구방법
본 연구에서는 뉘올레순 지역에 대한 식생 지 도를 생성하기 위해 총 4단계의 분류 과정을 거 친다(그림 3). 첫 번째로 식생 탐지 및 분류에 사용되는 훈련 데이터와 입력 데이터로 사용하 기 위한 Sentinel-2의 전처리 과정을 거친다.
두 번째로 다중 시기 영상과 정규 지수식을 활 용하여 랜덤포레스트(Random forest) 분류를 거쳐 8개 클래스의 토지피복지도를 생성한다.
훈련 데이터 구축은 구글 어스와 노르웨이 고해 상도 정사영상을 참조하여 생성하였다. 식생 세 분류는 노르웨이 극지 연구소에서 제공하는 토 지피복지도를 참조하여 식생 분류를 진행하였다.
No. Class Description Samples
1 Sea and fjords Ocean, Sea 50
2 Lake Inland lakes, broad flooding rivers 50
3 Shadows shadow areas, shade effects 50
4 Glaciers and snow Melting zones around glaciers, 50
5 Naked clay and gravel surfaces Wet, non-vegetated to sparsely vegetated flats, beaches, slopes and river fans 50 6 Bare mountain Dry, non-vegetated to sparsely vegetated barrens, slopes and ridges 50
7 Polar Desert Gravel barren, polar deserts polygon fields 50
8 Vegetation Moss, tundra, swamps, arctic meadows, all of vegetated flats 50
Total 400
TABLE 2. Summary of the reference data for the land cover classification in Ny-Ålesund 1) 다중 시기 Sentinel-2 영상
다중 시기의 Sentinel-2 영상은 미국 지질조사 국의 USGS EarthExplorer(http://earthexplorer.
usgs.gov)에서 구름없는 Level-1C(L1C) 등급 을 사용하였다. Sentinel-2의 전처리 과정은 유 럽우주국에서 제공하는 프로그램인 ESA Sentinel Application Platform(SNAP)을 사용하였다.
Sentinel-2 영상은 점(pixel)기반의 분광 정보 (Spectral profile)와 분광 지수식(Spectral Index Ratio:SIR)을 생성하기 위해 동일한 해 상도의 공간해상력이 필요하다. Zheng et al.
(2017)와 Atkinson(2013)은 최근린 표본 재추출 법(Nearest neighbour re-sampling algorithm) 을 사용하여 10m 해상도로 공간해상력을 통일 하였을 때 효과적인 토지피복분류를 가능하다는 연구를 수행하였다. 따라서 본 연구에서는 SNAP에서 제공하는 최근린 표본 재추출법을 사용하여 모든 밴드를 10m 해상도로 통일하였 다. 본 연구에서는 식생 세분류를 위해 총 7장 의 다중 시기 Sentinel-2 영상을 활용하였다.
각 Sentinel-2 위성영상은 10개 밴드로 구성되 어 있으며 이를 결합하여 총 70개 밴드로 구성 된 영상을 구축하였다. 또한, 본 연구에서는 극 지방의 식생에 적합한 식생 지수를 사용하기 위 해 7개의 영상으로부터 생성된 6개 식생 지수 를 추가로 사용하여 총 112개 밴드로 구성된 영상을 구축하였다.
2) 훈련 데이터 구축
훈련 데이터는 Sentinel-2 영상의 Digital
Number(DN) 값과 분광 지수식을 기반으로 구 축하였다. 선행연구에서는 전체 식생 지역을 추 출하고 식생 지역 내의 세분류를 수행하는 계층 화된 분류 과정을 통해 정확도가 개선된 사례가 있다(Hościło and Lewandowska, 2019;
Immitzer et al., 2019). 따라서 본 연구에서는 2단계에 걸친 계층화된 분류 과정을 수행하였 다. 첫 번째 단계에서는 8개 클래스의 토지피복 지도를 생성하기 위해 모든 Sentinel-2 영상과 고해상도 정사영상을 기반으로 각 클래스별 50 개씩, 총 400개의 ROI(Region of Interest)를 구축하였다(표 2). 두 번째 단계에서는 식생 분 류를 수행하기 위해 노르웨이 극지 연구소에서 제공하는 스발바르 토지피복지도를 참조하여 첫 번째 단계의 결과로 나타난 분류지도 중 전체 식생 지역에 모든 픽셀 중심점을 포인트로 추출 하였다.
스발바르 토지피복지도는 특정 식물 종을 나 타내는 클래스를 제외하고 식생 특징에 따라 총 5개의 식생 클래스가 구축되어 있다. Immitzer et al.(2019)에 따르면 랜덤포레스트는 유사한 특징을 가지고 있는 클래스들을 분류할 때 더 많은 훈련 데이터를 입력한 클래스가 선호되는 경향이 있다. 따라서 본 연구에서는 모든 클래 스의 훈련 데이터의 수를 동일하게 추출하였다.
훈련 데이터는 Sentinel-2 영상의 모든 픽셀 중심점을 포인트로 구축한 데이터로부터 각 분 류 클래스 유형별 무작위 선택으로 50개씩 포 인트를 추출하였다(표 3).
No. Class Description Samples 1 Moss tundra Sparsely vegetated clay surfaces that in vegetated form appear as open plains and
open areas with polar vines. 50
2 Wet moss tundra Bird cliff and wet moss tundra communities 50
3 Lush meadow Located to sloping terrain and enrichment zones in slopes and established river basins 50 4 Mountain vegetation Small tundra grass/snow wool type, most often located to the upper part of slopes and
slopes. The unit includes lush and grassy bird mountain vegetation 50 5 Dry grass Open dry grass meadows on silky substrate, often characterized by speciessuch as
garden walls, pillowcases, and pillow 50
Total 250
TABLE 3. Summary of the reference data for the vegetation classification in Ny-Ålesund
Name Reference Formula
Normalized Difference Vegetation Index NDVI(Tucker, 1979)
Normalized Difference Index Band 4 and Band 5 NDI45
(Frampton et al., (2013)
Soil-Adjusted Vegetation Index SAVI(Huete, 1988)
×
Normalized Difference Water Index NDWI(Gao, 1996)
Red-Edge Normalized Difference Vegetation Index reNDVI
(Gitelson et al., 1996)
Green Normalized Difference Vegetation Index GNDVI
(Gitelson et al., 1996)
TABLE 4. Overview of the vegetation spectral index and band combinations with formula (NIR = Near-Infrared, RE = Red-edge, SWIR = Shortwave-Infrared)
3) 식생 지수
본 연구에서는 연구 대상지의 공간적 분포 특 성을 나타내기 위해 총 6가지의 정규 식생 지수 식을 활용하였다(표 4). 적색 밴드와 근적외선 밴드는 식생 지역에서 가장 민감한 밴드이기 때 문에 두 밴드 사이의 정규화된 비율을 나타내는 NDVI를 사용하였다. NDVI는 가장 많이 사용되 는 식생 지수중 하나이다(Hawrylo et al., 2018; Somvanshi and Kumari, 2020). 또한, Gitelson et al.(1996)은 식생 종류에 따라 적 색 밴드 대신에 녹색 밴드를 사용하였을 때 효 과적인 식생 탐지가 가능하다는 연구 결과가 있 기에 녹색 밴드와 근적외선 밴드의 정규화된 비 율인 GNDVI를 사용하였다.
Sentinel-2 영상은 식생 지역을 관측하기 위 해 일반적으로 사용되는 적색 밴드와 근적외선 밴드 외에도 3개의 적색경계(Red-edge)밴드를
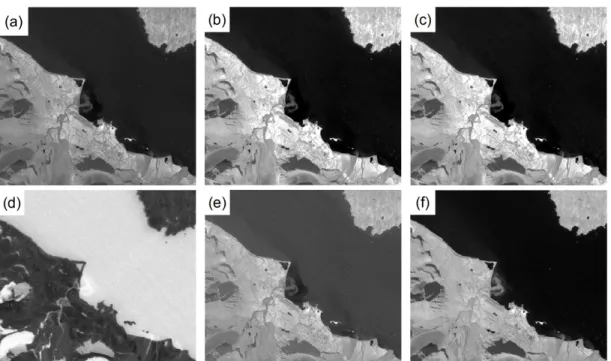
제공한다. Delegido et al.(2011)에 따르면 식 생을 탐지하는데 가장 효과적인 적색경계밴드는 5번째 밴드인 Red-edge 1(RE1) 밴드로 나타 났다. 본 연구에서는 RE1 밴드를 기반으로 적 색 밴드와 근적외선 밴드의 정규화된 비율인 NDI45와 reNDVI를 사용하였다. 연구 대상지인 뉘올레순 지역은 토양과 자갈 등이 이끼류와 공 존하는 형태의 피복특성을 가지고 있다. 따라서 본 연구에서는 토양의 밝기 변화를 최소화하고 토양으로 인한 변화를 제거한 SAVI와 수분에 민감한 단파 적외선 밴드를 사용한 NDWI를 사 용하였다. 그림 4는 Sentinel-2 영상으로부터 추출된 식생 SIR들을 영상으로 표현한 것이다.
4) 랜덤포레스트(Random forest)
본 연구에서는 연구 대상지의 식생 지역을 추 출하는 데 있어서 SIR 지수들의 조합을 활용하
(a) Normalized Difference Vegetation Index (NDVI); (b) Normalized Difference Index Band 4 and Band 5 (NDI45); (c) Soil-Adjusted Vegetation Index (SAVI); (d) Normalized Difference Water Index (NDWI); (e) Red-edge Normalized Difference Vegetation Index 2 (reNDVI);
(f) Green Normalized Difference Vegetation Index (GNDVI).
FIGURE 4. Spectral index ratio image of Sentinel-2
여 클래스별 임계값으로 나누는 방법이기 때문 에 의사결정트리(Decision tree) 형태를 가진 다. 하지만 의사결정 나무는 훈련 데이터에 과 적합 되는 경향이 있기 때문에 실질적으로 분류 결과에서 실제 데이터와 오차가 크게 발생할 수 있다. 따라서 본 연구에서는 두 단계에 걸친 분 류 과정을 위해 Breiman(2001)이 제안한 다수 의 무작위 의사결정 나무를 생성하여 분류하는 앙상블 기법인 랜덤포레스트 알고리즘을 사용하 였다.
위성영상 분류에서 랜덤포레스트는 최대 우도 법(Maximum likelihood)과 같은 전통적인 감 독분류기에 비해 안정적이고 효율적인 것으로 나타나며, 특히 사용자 정의 매개 변수를 거의 포함하지 않고 우수한 전체 정확도를 산출한다 (Lebourgeois et al., 2017). 랜덤포레스트의 매개 변수로는 트리 수(ntree)와 노드 분할에 사용되는 변수 수(mtry)를 포함하여 2개의 사
용자 정의 매개 변수가 있다. 트리 수는 값이 커질수록 일반화 오차(generalization error)가 특정 값으로 수렴하게 하여 과적합(over- fitting)을 피할 수 있다. 본 연구에서는 랜덤포 레스트를 수행하기 위해 R statistic에서 제공하 는‘Random forest’패키지를 사용하였으며, 트리 수는 기본값인 500으로 설정하였고, 변수 수는 20으로 설정하였다.
랜덤포레스트의 핵심 과정은 전체 훈련자료 중 무작위로 선택하는 배깅(Bagging)을 기반으 로 각 결정 나무를 학습시키고 학습된 결정 나 무의 결과를 집계하여 최종 결과값을 구하는 것 이다(그림 5). 배깅은 Bootstrap Aggregation 의 약자로 표본을 여러 번 뽑아 각 모델을 학습 시켜 결과물을 집계(Aggregation)하는 방법이 다. 랜덤포레스트의 특징은 OOB(Out-Of-Bag) 를 통해 정확도를 계산할 수 있다는 점이다.
OOB는 랜덤포레스트에서 데이터가 무작위로
FIGURE 5. Diagram of the random forests accuracy assessment with OOB from Parnell et al(2011)
∑∈ ∑∈
(1)
추출하였을 때 각 트리에서 훈련 데이터 집합에 속하지 않는 데이터를 뜻한다. 즉 OOB는 입력 된 데이터의 값과 각 트리로부터 나온 결과 사 이의 오차로 정의된다. 따라서 OOB를 통한 정 확도 검증은 훈련자료와 OOB의 정확도 비교를 부트스트랩(Bootstrap) 된 횟수만큼 수행하고 통계를 계산하는 방식이다. 랜덤포레스트의 또 다른 이점으로는 입력 데이터의 평가와 데이터 축소에 사용할 수 있는 변수 중요도를 구할 수 있다는 점이다. 변수 중요도는 분류 정확도에 끼 치는 영향에 따라 중요도를 계산하는 방식으로 MDA(Mean decrease in Accuracy)라고도 한 다. MDA는 식 1과 같이 계산되고, 변수 는 결 정 트리 에서 무작위로 선택된 것이다.
는 에 대한 예측 결과이고, 는 변수 가 포함되었을 때의 예측 결과이다.
최종적으로 산출되는 변수 중요도는 전체 ntree
에 대한 결과들의 평균값으로 계산된다.
본 연구의 분류 정확도는 OOB 결과를 통해 훈련된 표본과 비교하여 평가하였다. 랜덤포레 스트 알고리즘에서는 OOB를 통한 평가가 별도 의 검증 데이터 세트에 기초한 평가와 비교하여 유용할 수 있다(Belgiu and Dragut, 2016;
Vuolo et al., 2018).
연구 결과
본 연구에서 ROI를 통해 8개 클래스의 ROI 를 분류한 결과 전체 정확도가 92.97%로 나타 났다. 가장 높은 오분류가 나타난 클래스는 Bare mountain 클래스로 80%의 사용자 정확 도가 나타났다. 식생 클래스는 생산자와 사용자 정확도가 모두 98% 이상으로 나타났다(표 5).
그림 6(a)은 1차 분류를 위해 8개 클래스로 이루어진 ROI의 위치를 나타내었고, 랜덤포레스
Reference
Class (1) (2) (3) (4) (5) (6) (7) (8) User’s Accuracy
Sea and fjords (1) 46 3 - - 1 - - - 92%
Lake (2) 1 47 1 - 1 - - - 94%
Shadows (3) - 1 49 - - - - - 98%
Glaciers and snow (4) - - - 50 - - - - 100%
Naked clay and gravel (5) - - - - 49 - 1 - 98%
Bare mountain (6) - - - - - 40 10 - 80%
Polar Desert (7) - - - - 1 5 43 1 86%
Vegetation (8) - - - - - - - 50 100%
Total 47 51 50 50 52 45 54 51
Producer’s Accuracy(%) 97.87 92.15% 98% 100% 94.23% 88.89% 79.63% 98.03% 400 Overall Accuracy(%) : 92.97 Kappa : 0.9196
TABLE 5. Confusion matrix based on OOB results of the land cover classification with all 7 Sentinel-2 scenes.
(a) (b)
FIGURE 6. Distribution of the 8-classes land cover reference data set and classification results.
(a) 8-classes land cover reference data set (b) 8-class classification results
트로 분류한 결과를 그림 6(b)에 나타냈다. 본 연구에서는 식생 세분류 결과를 사용된 영상 수 에 따라 전체 정확도의 변화로 표현하였다(그림 7). 그림 6(a)은 각 시기별 Sentinel-2의 10 개 밴드를 사용하여 식생 세분류를 수행한 결과 나타난 전체 정확도를 나타낸 것이다. 사용된 영상은 1개 일 때 2016년 8월 2일 Sentinel-2 영상이며 날짜 순서대로 결합하여 영상 수가 7개일 때는 2019년 8월 10일 영상 을 추가하였다. 영상 수가 1개일 때 전체 정확
도는 약 77%이고 영상 수가 7일 때는 약 81%
로 나타나, 약 4%의 분류 정확도가 개선되는 결과를 보였다. 그림 7(b)은 각 시기별 Sentinel-2의 10개 밴드와 6가지 식생 지수를 사용하여 식생 세분류를 수행한 결과이다. 영상 수가 1개일 때 전체 정확도가 77%, 최고점일 때 전체 정확도가 83%로 나타나 식생 지수가 추가되었을 때 분류 정확도는 약 2%가 개선되 었다. 하지만 그림 7(a)에서는 3번째, 그림 7(b)에서는 4번째 영상이 추가되었을 때 정확
(a) (b)
FIGURE 7. Overall accuracy of classification according to the number of Sentinel-2 scenes (a) using only spectral bands (b) using spectral bands and vegetation index
(a) (b)
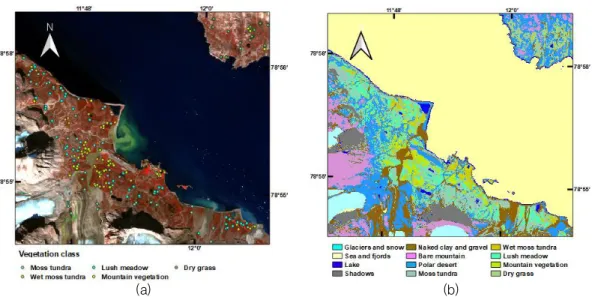
FIGURE 8. Distribution of the vegetation reference data set and classification results (a) 5-class vegetation reference data set (b) land cover and vegetation classification map
도가 낮아지는 현상을 보이는데, 이는 다른 영 상의 훈련 데이터에서 변화나 오분류가 발생한 것으로 판단된다.
본 연구에서는 식생 세분류를 위해 스발바르 토지피복지도로부터 무작위 추출 기법을 통해 5 개의 식생 클래스에 대해 250개 포인트를 추출 하였으며 공간적 위치는 그림 8(a)과 같다. 그 림 8(b)은 식생 세분류 결과 가장 높은 정확도 를 나타냈던 여섯 시기의 Sentinel-2 10개 밴
드 및 식생 지수를 사용하여 분류한 결과이다.
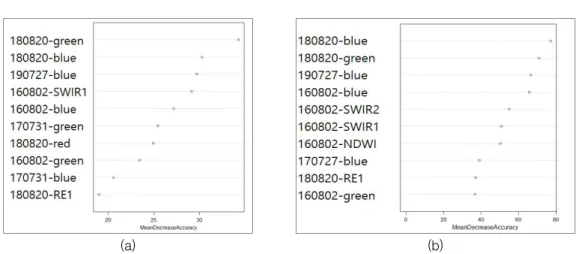
그림 9는 7개 시기의 Sentinel-2 영상을 이 용하여 랜덤포레스트 분류를 수행하였을 때, 사 용된 밴드별로 변수 중요도를 나타낸 것이다.
그림 9(a)는 Sentinel-2의 10개 밴드를 사용 하였을 경우 상위 10개의 변수 중요도를 나타 낸 것이다. 가장 많은 빈도를 보인 영상 시기는 2016년 8월 2일과 2018년 8월 20일 영상이 각각 3번, 4번으로 나타났다.
(a) (b)
Reference
Class Moss tundra Wet moss tundra Lush meadow Mountain vegetation Dry grass User’s Accuracy
Moss tundra 26 4 18 - 2 52%
Wet moss tundra 2 31 6 6 5 62%
Lush meadow 16 4 23 2 5 46%
Mountain vegetation 2 6 5 34 3 68%
Dry grass - - 1 2 47 94%
Total 46 45 53 44 62
Producer’s Accuracy(%) 56.52 68.89 43.4 77.27 75.81 250
Overall Accuracy(%) : 64.4 Kappa : 0.555
TABLE 6. Confusion matrix based on OOB results of the best accuracy for vegetation classification using spectral bands and vegetation index
FIGURE 9. Aggregated feature importance derived from combination of all Sentinel-2 image. A higher dot position indicates a higher importance of the specific band. (a) using only spectral
bands (b) using spectral bands and vegetation index
또한, 가장 많은 빈도를 보인 밴드 종류는 Blue 밴드와 Green 밴드로 나타났다. 그림 9(b)는 Sentinel-2 10개 밴드와 식생 지수를 사용하였을 경우의 변수 중요도를 나타냈다. 그 림 9(a)와 마찬가지로 가장 많은 빈도를 보인 시기는 2016년 8월 2일과 2018년 8월 20일이 고 밴드에서는 Blue와 Green이 가장 많은 수를 보였다. 식생 지수중에서는 2016년 8월 2일의 NDWI가 1개로 나타났다. 이는 본 연구의 대상 지역에서 바다와 같은 수역이 넓게 분포한 점과 극지방의 식생 특성상 갈변된 낙엽수가 분포하 고 있을 수 있기 때문에 blue, green, SWIR의
밴드의 변수 종요도가 높은 것으로 판단된다.
표 6은 세분류 결과 중 식생 클래스에 해당하는 정확도 검증결과이다. 식생 클래스 중 가장 오 분류가 많이 부분은 Lush meadow 클래스와 Moss tundra 클래스 사이에 발생했다.
결 론
본 연구에서는 다시기 Sentinel-2 영상을 이 용하여 북극의 극지방인 Svalbard 제도의 Ny-Ålesund 지역에 대한 토지 및 식생 분류 를 수행하였으며, 다시기 영상과 식생 지수에
따른 분류 정확도 개선과 변수 중요도를 분석하 였다. 이를 통해 본 연구는 다음과 같은 결론을 얻었다.
첫째, 다시기 Sentinel-2 영상을 이용하여 영상 수에 따라 전체 정확도를 비교한 결과, 1 개일 때 약 77%, 7개일 때 약 81%로 나타나 4%의 분류 정확도가 개선되었다. 식생 지수 포 함하였을 때는 분류 정확도가 83%까지 개선되 는 것을 확인하였다. 따라서 극지방의 토지 및 식생 분류에서는 다수의 영상과 식생 지수를 활 용하는 것이 효율적인 학습 방법으로 도출되었 다.
둘째, 본 연구에서는 다수의 영상을 사용하였 을 때 정확도가 상승한다는 점을 확인하였으나, 일부 영상이 추가되었을 경우 정확도가 하락하 는 경우도 발생하였다. 이는 영상의 촬영된 시 기와 대기 특성으로 인한 오차가 발생할 수도 있는 것으로 판단된다. 따라서 향후 추가 연구 는 영상의 대기 보정이나 취득일에 따라 정확도 에 미치는 영향을 확인하는 것이 요구된다.
셋째, 본 연구에서는 Sentinel-2의 10개 밴 드에서 제공되는 다양한 스펙트럼 대역들을 활 용하였다. RF를 기반으로 하는 분류 결과에서 상위 10개의 변수 중요도를 측정한 결과 2016 년 8월 2일과 2018년 8월 20일의 영상이 가장 높은 빈도로 나타났다. 또한, Blue와 Green 밴 드가 가장 높은 빈도를 보였기 때문에 연구 대 상지의 분류 시 가장 중요한 척도로 판단된다.
하지만 식생 지수의 경우 2016년 8월 2일의 NDWI 1개만 나타나, 연구 대상지의 분류 시 단일 밴드에 비해 상대적으로 중요도가 낮았다 고 판단된다. 분류 정확도는 검증 데이터와 일 치하는 일부 영상을 통해 높은 정확도를 산출할 수 있지만, 가장 확실한 방법은 사용 가능한 모 든 영상을 layer-stack 하여 사용하는 것이다.
본 연구는 극지방 환경의 식생 중에서도 특히 해안의 초지, 이끼류, 지의류를 분류하는 데 있 어 효율적인 입력특성을 선정하는 기초 연구이 다. 하지만, 본 연구는 극지방의 여러 환경 중, 뉘올레순을 대상으로만 하였기 때문에 향후 추 가 연구를 통해 다양한 극지방의 사례와 비교하
여 일반화할 수 있는 입력특성을 선정하는 것이 필요하다.
REFERENCES
Atkinson, P.M. 2013. Downscaling in remote sensing. International Journal of Applied Earth Observation and Geoinformation.
22, 106–114.
Belgiu, M. and L. Dragut. 2016. Random forest in remote sensing: A review of applications and future directions. ISPRS Journal of Photogrammetry and Remote Sensing. 114:24–31.
Breiman, L. 2001. Random forests. Machine Learning 45(1):157-176.
Chen, Z., J. Pasher, J. Duffe and A.
Behnamian. 2017. Mapping Arctic Coastal Ecosystems with High Resolution Optical Satellite Imagery Using a Hybrid Classification Approach. Canadian Journal of Remote Sensing. 43(6):513-527.
Chi, J., C. Hyun, H. KIM, H. Joo, E. Yang, H. Park and S. Kang. 2017. Development of Web Based GIS for Polar Ocean Rese arch. The Korean Association of Geogra phic Information Studies. 20(1):15-25.
(지준화, 현창욱, 김현철, 주형민, 양은진, 박 호준, 강성호. 2017. 극지 해양환경 연구를 위한 웹GIS 구축. 한국지리정보학회지. 제20 권. 1호:15-25).
Epstein, H. Raynolds, M. Walker, D. Bhatt, U. Tucker, C. Pinzon, J. 2012. Dynamics of aboveground phytomass of the circumpolar Arctic tundra during the past three decades. Environmental Research Letters. 7:015506.
ESA Standard Document. 2015. Sentinel 2
User Handbook. Issue 1, Rev 2.24.
Available online: https://earth.esa.int/documents /247904/685211/Sentinel-2_User_Handbo ok.pdf (Accessed May 2, 2020).
Ettehadi, P., S. Kaya, E. Sertel and U.
Alganci. 2019. Separating Built-Up Areas from Bare Land in Mediterranean Cities Using Sentinel-2A Imagery.
Remote Sensing. 11(3):345.
Frampton, W., J. Dash, G. Watmough and E. Milton. 2013. Evaluating the capabilities of Sentinel-2 for quantitative estimation of biophysical variables in vegetation.
ISPRS Journal of Photogrammetry and Remote Sensing. 82:(83-92).
Gao, B. C. 1996. NDWI—A normalized difference water index for remote sensing of vegetation liquid water from space.
Remote Sensing of Environment, 58(3):
257−266.
Gitelson, A.A., Y.J. Kaufman and M.N.
Merzlyak. 1996. Use of a green channel in remote sensing of global vegetation from EOS-MODIS. Remote Sensing of Environment. 58(3):289-298.
Hawrylo, P., B. Bartlomiej, P. Wezyk and M. Szostak. 2018. Estimating defoliation of Scots pine stands using machine learning methods and vegetation indices of Sentinel-2. European Journal of Remote Sensing. 51(1):194-204.
Hościło, A. and A. Lewandowska. 2019.
Mapping Forest Type and Tree Species on a Regional Scale Using Multi-Temporal Sentinel-2 Data. Remote Sensing. 11(8):
929.
Huete, A. A. 1988. soil-adjusted vegetation index (SAVI). Remote Sens. Environ. 25,
295–309.
Immitzer, M., M. Neuwirth, S. Böck, H.
Brenner, F. Vuolo and C. Atzberger.
2019. Optimal Input Features for Tree Species Classification in Central Europe Based on Multi-Temporal Sentinel-2 Data. Remote Sensing. 11(22): 2599.
Jawak, S. and A. Luis. 2014. A Semiautomatic Extraction of Antarctic Lake Features Using Worldview-2 Imagery. Photogrammetric Engineering and Remote Sensing. 80 (10):939-952.
Jeon, H., D. Kim, J. Kim, S. K. D. Vadivel, J. Kim, T. Kim and S. Jeong. 2020.
Selection of Optimal Band Combination for Machine Learning-based Water Body Extraction using SAR Satellite Images.
The Korean Association of Geographic Information Studies. 23(3):120-131. (전 현균, 김덕진, 김준우, 수레시 크리쉬난, 김재 언, 김택인, 정승환. 2020 SAR 위성 영상을 이용한 수계탐지의 최적 머신러닝 밴드 조합 연구. 한국지리정보학회지. 제23권. 3 호:120-131).
Johansen, B.E., H. Tømmervik and S.R.
Karlsen. 2012. Vegetation mapping of Svalbard utilising Landsat TM/ETM+
data. Polar Record. 48(244):47-63.
Karlsen, S.R., A. Elvebakk, K.A. Hogda and T. Grydeland. 2014. Spatial and Temporal Variability in the Onset of the Growing Season on Svalbard, Arctic Norway — Measured by MODIS-NDVI Satellite Data. Remote Sensing. 6(9):8088-8106.
Kim, H.C. and T.B. Chae. 2019. Status of Korean Research Activity on Arctic Sea Ice Monitoring using KOMPSAT-series Satellite. Journal of Korean Earth
Science Society. 40(4):329-339.
Kim, S.I., H.C. Kim, J.I. Shin and S.G.
Hong. 2013. Land-Cover Classification of Barton Peninsular around King Sejong station located in the Antarctic using KOMPSAT-2 Satellite Imagery. Korean Journal of Remote Sensing. Vol.29.
No.5:537-544. (김상일, 김현철, 신정일, 홍 순규. 2013. KOMPSAT-2 위성 영상을 이 용한 남극 세종기지 주변 바톤반도의 토지피 복분류. 대한원격탐사학회. 제29권. 5호:
537-544).
Langford, Z.L., J. Kumar, F.M. Hoffman, A.L. Breen and C.M. Iversen. 2018.
Arctic Vegetation Mapping Using Unsupervised Training Datasets and Convolutional Neural Networks. Remote Sensing. 11 (1):69.
Lebourgeois, V., S. Dupuy, E. Vintrou, M.
Ameline, S. Butler and A. Begue. 2017.
A combined random forest and obia classification scheme for mapping smallholder agriculture at different nomenclature levels using multisource data (simulated sentinel-2 time series, vhrs and dem). Remote Sensing, 9(3):
259.
Lee, J., J. Im, K. Kim and J. Heo. 2015.
Change Analysis of Aboveground Forest Carbon Stocks According to the Land Cover Change Using Multi-Temporal Landsat TM Images and Machine Learning Algorithms. The Korean Association of Geographic Information Studies. 18(4):81-99. (이정희, 임정호, 김 경민, 허준. 2015. 다시기 Landsat TM 영상 과 기계학습을 이용한 토지피복변화에 따른 산림탄소저장량 변화 분석. 한국지리정보학회 지. 제18권. 4호:81-99).
Maglione, P., C. Parente and A. Vallario.
2014. Coastline extraction using high resolution WorldView-2 satellite imagery.
European Journal of Remote Sensing.
47(1):685-699.
National Geographic Information Institute. 2018.
2018 Arctic Spatial Information Establishment Project. (국토지리정보원, 2018, 2018년 북극 지 역 공간정보 구축사업).
Nguyen, H., T. Doan, E. Tomppo and R.
McRoberts. 2020. Land Use/Land Cover Mapping Using Multitemporal Sentinel-2 Imagery and Four Classification Methods
—A Case Study from Dak Nong, Vietnam.
Remote Sensing. 12(9):1367.
Parnell, L.D., P. Lindenbaum, S. Khader, G.
Dall’Olio, M. Swan, L. Jensen, S. Cockell, B. Pedersen, M. Mangan, C. Miller and I.
Albert. 2011. BioStar: An Online Question
& Answer Resource for the Bioinformatics Community, PLoS Computational Biology.
7(10), pp.e1002216. doi: 10.1371/journal.pcbi.
1002216.
Salvatori, R. R. Casacchia and M. Valt. 2005.
Snow surface classification in the Western Svalbard Island. 31th International Symposium on Remote Sensing of Environment: Global Monitoring for Sustainability and Security.
Saint Petersburg, Russia, Jun. 20-Jun.
24, 2005.
Somvanshi, S. and M. Kumari. 2020.
Comparative analysis of different vegetation indices with respect to atmospheric particulate pollution using Sentinel data.
Applied Computing and Geosciences.
7:100032.
The Local. 2017. Norway to boost climate change defences of 'doomsday' seed
vault. May 15, https://www.thelocal.no/
20170521/norway-to-boost-climate-ch ange-defences-of-doomsday-seed-vaul t. (Accessed December 20, 2019).
Tucker, C.J. 1979. Red and Photographic Infrared Linear Combinations for Monitoring Vegetation. Remote Sensing of Environment. 8(2):127-150.
Vuolo, F., M. Neuwirth, M. Immitzer, C.
Atzberger and W.T. Ng. 2018. How much does multi-temporal Sentinel-2
data improve crop type classification?.
International Journal of Applied Earth Observation and Geoinformation. 72:122–
130.
Zheng, H., P. Du, J. Chen, J. Xia, E. Li, Z.
Xu, X. Li and N. Yokoya. 2017.
Performance Evaluation of Downscaling Sentinel-2 Imagery for Land Use and Land Cover Classification by Spectral- Spatial Features. Remote Sensing. 9, 1274.