© 2015 The Korean Ophthalmological Society
This is an Open Access article distributed under the terms of the Creative Commons Attribution Non-Commercial License (http://creativecommons.org/licenses /by-nc/3.0/) which permits unrestricted non-commercial use, distribution, and reproduction in any medium, provided the original work is properly cited.
418
Original Article
Differences between Non-arteritic Anterior Ischemic Optic
Neuropathy and Open Angle Glaucoma with Altitudinal Visual Field Defect
Sangyoun Han1, Jong Jin Jung1, Ungsoo Samuel Kim1,2
1Department of Ophthalmology, Kim’s Eye Hospital, Seoul, Korea
2Department of Ophthalmology, Konyang University College of Medicine, Daejeon, Korea
Purpose: To investigate the differences in retinal nerve fiber layer (RNFL) change and optic nerve head param- eters between non-arteritic anterior ischemic optic neuropathy (NAION) and open angle glaucoma (OAG) with altitudinal visual field defect.
Methods: Seventeen NAION patients and 26 OAG patients were enrolled prospectively. The standard visual field indices (mean deviation, pattern standard deviation) were obtained from the Humphrey visual field test and differences between the two groups were analyzed. Cirrus HD-OCT parameters were used, including op- tic disc head analysis, average RNFL thickness, and RNFL thickness of each quadrant.
Results: The mean deviation and pattern standard deviation were not significantly different between the groups.
In the affected eye, although the disc area was similar between the two groups (2.00 ± 0.32 and 1.99 ± 0.33 mm2, p = 0.586), the rim area of the OAG group was smaller than that of the NAION group (1.26 ± 0.56 and 0.61
± 0.15 mm2, respectively, p < 0.001). RNFL asymmetry was not different between the two groups (p = 0.265), but the inferior RNFL thickness of both the affected and unaffected eyes were less in the OAG group than in the NAION group. In the analysis of optic disc morphology, both affected and unaffected eyes showed signifi- cant differences between two groups.
Conclusions: To differentiate NAION from OAG in eyes with altitudinal visual field defects, optic disc head analysis of not only the affected eye, but also the unaffected eye, by using spectral domain optical coherence tomography may be helpful.
Key Words: Glaucoma, Ischemic optic neuropathy, Visual field tests
The visual field test is an informative and useful tool in the field of ophthalmology. It can be used for detecting specific visual field defects that are regarded as localizing signs of specific disorders. Of the various visual field de-
fects, altitudinal defects may occur in the context of head- ache, suprasellar meningioma, or branch retinal artery oc- clusion [1-3]. Moreover, such defects may be associated with optic nerve disorders including tilted disc syndrome, ischemic optic neuropathy, optic neuritis and glaucoma [4- 6]. When patients with altitudinal visual field defects have no remarkable history, differentiating between non-arterit- ic anterior ischemic optic neuropathy (NAION) and glau- coma is difficult.
Suh et al. [7] suggested that NAION can be differentiat-
Received: February 25, 2015 Accepted: May 14, 2015
Corresponding Author: Ungsoo Samuel Kim, MD. Department of Oph- thalmology, Kim’s Eye Hospital, #136 Yeongsin-ro, Yeongdeungpo-gu, Seoul 07301, Korea. Tel: 82-1577-2639, Fax: 82-2-2677-9214, E-mail: ung- [email protected]
419 ed from glaucoma, especially in clock-hour sectors by
comparing the rim-retinal nerve fiber layer (RNFL) cor- relation. Using Heidelberg retinal tomography (HRT), they demonstrated that a number of parameters were signifi- cantly different between glaucoma and NAION. With sim- ilar damage, glaucoma was associated with larger and deeper cups, smaller rims, greater cup volume, and re- duced rim volume [8]. However, HRT is not interchange- able with spectral domain optical coherence tomography (OCT) for the analysis of the optic disc head [9]. Thus, in this study, we investigated differences in RNFL changes and optic nerve head parameters between NAION and glaucoma in patients with altitudinal visual field defects by using spectral domain OCT.
Materials and Methods
A total of 17 NAION patients (8 males, 9 females) and 26 glaucoma patients (15 males, 11 females) were prospec- tively enrolled between January 2011 and March 2013. This research study was reviewed and approved by the institu- tional review board of Kim’s Eye Hospital, and all proce- dures conformed to the guidelines of the Declaration of Helsinki.
The diagnosis of NAION was made by one neuro-oph- thalmologist based on clinical examination and history.
The inclusion criteria of NAION were duration of symp- toms <14 days at baseline eligibility visit, best-corrected visual acuity in the affected eye from 20 / 64 to light per- ception, visual field defects consistent with optic neuropa- thy (pattern deviation ≤3.0 dB) and relative afferent pupil- lary defect. All patients had disc edema at the initial visit.
Among 41 NAION patients, 17 patients had an altitudinal defect with a sharp border along the horizontal meridian.
The OCT and visual field test were performed at least two months after acute optic disc swelling. The inclusion crite- ria for open angle glaucoma (OAG) patients with an altitu- dinal defect with a sharp border along the horizontal me- ridian for the first visit were as follows: age at onset >18 years and RNFL loss visible on red-free fundus photogra- phy with open an angle. A glaucomatous optic disc change was defined as a cup-to-disc ratio >0.5 or as a glaucoma- tous optic disc change (including vertical enlargement of the cup, increase in the depth of the cup, and notching).
The fellow eye did not show any typical glaucomatous vi-
sual field defect. The exclusion criteria included a history of ocular trauma or compressive optic neuropathy. Also, patients who showed low reliability on the visual field test (over 33% false negative, over 33% false positive, and over 20% fixation loss) were excluded.
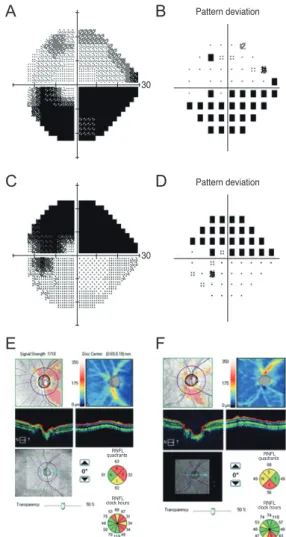
Full ophthalmologic examinations, including best-cor- rected visual acuity, slit-lamp examination, and manifest refraction, were performed. Visual field tests were com- pleted using Humphrey automated perimetry (Fig. 1A-1D).
The standard visual field indices (mean deviation [MD]
and pattern standard deviation [PSD]) were obtained from the Humphrey visual field test (24-2 SITA program) and differences between the two groups were analyzed.
Patients were scanned using Cirrus HD-OCT (software ver. 6.0.1; Carl Zeiss Meditec, Dublin, CA, USA) with in- ternal fixation. The OCT scans were analyzed with fast
Fig. 1. The results of visual field test (A-D) and spectral domain optical coherence (E,F). Ischemic optic neuropathy (A,B,E) and open angle glaucoma (C,D,F). RNFL = retinal nerve fiber layer.
Pattern deviation
30
Pattern deviation
30
quadrants RNFL
clock hoursRNFL
quadrants RNFL
clock hoursRNFL
Pattern deviation
30
Pattern deviation
30
quadrants RNFL
clock hoursRNFL
quadrants RNFL
clock hoursRNFL Pattern deviation
30
Pattern deviation
30
quadrants RNFL
clock hoursRNFL
quadrants RNFL Pattern deviation
30
Pattern deviation
30
quadrants RNFL
clock hoursRNFL
quadrants RNFL
clock hoursRNFL
A
D B
C
F E
420
RNFL thickness protocols. In this study, only data with a signal strength greater than 6 was used. The following pa- rameters were analyzed: average RNFL thickness, interoc- ular RNFL asymmetry, rim area, disc area, average cup- to-disc ratio, and vertical cup-to-disc ratio (Fig. 1E and 1F). We also investigated the RNFL thickness of each quadrant (based on a 6 mm × 6 mm data cube captured by the optic disc cube 200 × 200 scan) and compared the ratio of the superior and inferior quadrants in the affected eye.
The OCT and visual field test were conducted at the same time.
The data were analyzed using SPSS ver. 15.0 (SPSS Inc., Chicago, IL, USA). The Mann-Whitney test was used to differentiate the visual field defect and RNFL thickness in the two groups. To determine differences between affected eyes and unaffected eyes, the Wilcoxon signed-rank test was used. Differences were considered significant at a p-value of <0.05.
Results
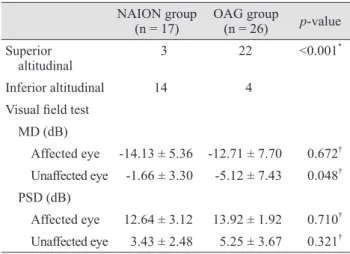
The mean age of patients in the NAION and OAG groups was 60.0 ± 9.6 and 64.0 ± 11.2 years, respectively (Mann-Whitney test, p = 0.165) (Table 1). Differences in the visual field test results of the affected eye were com- pared between the NAION and OAG groups (Table 2).
Among them, superior altitudinal visual field defects were more common in the OAG group, whereas, in comparison, inferior altitudinal visual field defects occurred more fre- quently within the NAION group, the visual field test in the unaffected eyes showed a significantly lower MD in the OAG group (NAION group -1.66 ± 3.30 dB vs. OAG group -5.12 ± 7.43 dB, p = 0.048).
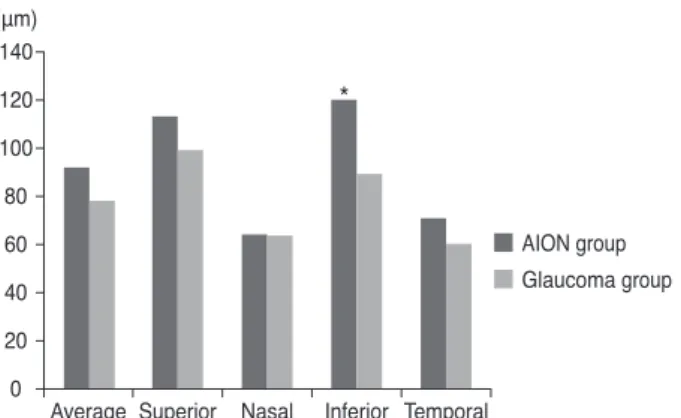
Table 3 highlights the RNFL thickness in the affected eye. The results showed that only the inferior RNFL thick- ness was significantly different between the two groups (NAION group 109.4 ± 46.9 μm vs. OAG group 63.2 ± 11.6 μm, p < 0.001). RNFL asymmetry was not significantly different between the two groups (p = 0.265). Similar to the affected eye, the inferior RNFL thickness of the unaf- fected eye was less in the OAG group than in the NAION group (Fig. 2).
The optic disc characteristics using OCT were signifi- cantly different between the affected eyes of the two groups (Table 4). Although the disc area was similar be- tween the two groups (2.00 ± 0.32 and 1.99 ± 0.33 mm2, p
Table 1. Demographics
NAION group OAG group p-value
Male : female 8 : 9 15 : 11 0.732*
Age (yr) 60.0 ± 9.6 64.0 ± 11.2 0.165† Refractive error
(SE, D)
Affected eye 0.31 ± 0.84 -0.48 ± 2.72 0.631 Unaffected eye 0.42 ± 1.64 -0.17 ± 2.14 0.528† NAION = non-arteritic anterior ischemic optic neuropathy; OAG
= open angle glaucoma; SE = spherical equivalent; D = diopters.
*Chi-square test; †Mann-Whitney test.
Table 2. The characteristics of visual field defect NAION group
(n = 17) OAG group
(n = 26) p-value Superior
altitudinal 3 22 <0.001*
Inferior altitudinal 14 4
Visual field test MD (dB)
Affected eye -14.13 ± 5.36 -12.71 ± 7.70 0.672† Unaffected eye -1.66 ± 3.30 -5.12 ± 7.43 0.048† PSD (dB)
Affected eye 12.64 ± 3.12 13.92 ± 1.92 0.710† Unaffected eye 3.43 ± 2.48 5.25 ± 3.67 0.321† NAION = non-arteritic anterior ischemic optic neuropathy; OAG
= open angle glaucoma; MD = mean deviation; PSD = pattern standard deviation.
*Fisher’s exact test; †Mann-Whitney test.
Table 3. The results of optical coherence tomography in the affected eye
NAION group
(n = 17) OAG group
(n = 26) p-value* RNFL (μm)
Average 77.8 ± 25.8 65.2 ± 8.8 0.165 Superior 78.0 ± 31.3 82.9 ± 22.1 0.140
Nasal 63.2 ± 13.4 59.0 ± 8.1 0.444
Inferior 109.4 ± 46.9 63.2 ± 11.6 <0.001 Temporal 61.1 ± 34.5 55.2 ± 9.4 0.437 RNFL asymmetry (%) 60.9 ± 15.9 50.5 ± 27.0 0.265 NAION = non-arteritic anterior ischemic optic neuropathy; OAG
= open angle glaucoma; RNFL = retinal nerve fiber layer.
*Mann-Whitney test.
= 0.586), the rim area of the OAG group was smaller than that of the NAION group (1.26 ± 0.56 and 0.61 ± 0.15 mm2, respectively, p < 0.001). Consequently, the OAG group had a larger average cup-to-disc ratio and vertical cup-to-disc ratio and a bigger cup volume than the NAION group. The rim area, average cup-to-disc ratio, vertical cup-to-disc ra- tio, and cup volume of the unaffected eye were also sig- nificantly different between the two groups (p < 0.001).
There were no significant differences between the af- fected eyes and unaffected eyes of patients in the NAION group (all parameters including rim area, vertical cup-to- disc ratio, average cup-to-disc ratio, and cup volume, p = 1.000). All of these parameters were also not significantly different between the unaffected eye and affected eye in OAG patients (Wilcoxon signed-rank test; p = 0.084, p = 0.992, p = 0.164, and p = 0.312, respectively).
Discussion
The present study revealed that both the affected and unaffected eyes were significantly different between OAG and NAION patients using the visual field test as well as spectral domain OCT. Altitudinal visual field defects are considered common in NAION (especially inferior visual field defects) because of the typical vascular supply of the optic disc [5]. However, altitudinal visual field defects can also be seen in patients with glaucoma, other optic nerve disorders, and chiasmal lesions [10]. In the present study, inferotemporal rim loss was usually more pronounced in glaucoma patients, therefore superior visual field defects were more common. We also found that inferior visual field defects were more common in the NAION group and superior visual field defects were more common in the OAG group.
Visual field indices including MD and PSD were not sig- nificantly different between the affected eyes of NAION and OAG patients. However, RNFL findings differed from the OCT findings. Horowitz et al. [11] presented significant quantitative differences in RNFL thickness between glau- comatous and NAION eyes. Like this previous study, the average RNFL thickness was slightly thinner in the OAG group. When analyses were performed by quadrant, infe- rior RNFL loss was found to result in superior altitudinal visual field defects, which were more common in the OAG group. However, the inferior RNFL thickness among OAG patients was less than that among NAION patients.
Optic disc analysis using spectral domain OCT also not- ed significant differences between the affected and unaf- fected eyes of the two groups. Anton et al. [12] reported that the disc area was not significantly different between normal and glaucomatous patients, but that the rim area
Table 4. Optic nerve head analysis using spectral domain optical coherence tomography Affected eye
p-value* Unaffected eye
p-value*
NAION group OAG group NAION group OAG group
Disc area (mm2) 2.00 ± 0.32 1.99 ± 0.33 0.586 1.99 ± 0.35 2.00 ± 0.36 0.802
Rim area (mm2) 1.26 ± 0.56 0.61 ± 0.15 <0.001 1.35 ± 0.38 0.85 ± 0.28 <0.001 Average C/D ratio 0.57 ± 0.19 0.81 ± 0.06 <0.001 0.52 ± 0.19 0.73 ± 0.11 <0.001 Vertical C/D ratio 0.54 ± 0.20 0.80 ± 0.07 <0.001 0.48 ± 0.20 0.71 ± 0.11 <0.001 Cup volume (mm3) 0.18 ± 0.24 0.58 ± 0.19 <0.001 0.16 ± 0.19 0.45 ± 0.27 <0.001 NAION = non-arteritic anterior ischemic optic neuropathy; OAG = open angle glaucoma; C/D = cup-to-disc.
*Mann-Whitney test.
140 120 100 80 60 40 20
0 Average Superior Nasal Inferior Temporal
AION group Glaucoma group (μm)
*
Fig. 2. Retinal nerve fiber layer thickness analysis using spectral domain optical coherence tomography in the unaffected eye. In- ferior retinal nerve fiber layer thickness showed a significant dif- ference between the two groups (p < 0.012, Mann-Whitney test).
AION = anterior ischemic optic neuropathy. *p < 0.001.
422
was smaller and the cup-to-disc ratio significantly greater in glaucomatous eyes. Our data also indicated that the disc area was not significantly different among all eyes in both groups. Table 4 details the criteria for typical glaucoma- tous disc cupping including a large cup-to-disc ratio, a large cup volume and a small rim area in the affected and unaffected eyes of OAG patients. In addition, all parame- ters except for disc area were different between the affect- ed eyes of the two groups ( p < 0.001). Patients with NAION had a smaller cup-to-disc ratio and a larger rim area in the affected eye. Although a significant decrease in inferior RNFL thickness was observed in OAG patients, their optic nerve head was not notably different between the affected and unaffected eyes. Danesh-Meyer et al. [13]
reported that disc cupping is an uncommon finding in as- sociation with NAION. In contrast, Saito et al. [14] sug- gested that the cup is slightly larger in affected NAION eyes compared to the corresponding unaffected eye using HRT. These different results might be due to the differenc- es in optic nerve head measurements associated with the use of spectral domain OCT and HRT [9].
Lisboa et al. [15] reported that the RNFL assessment with spectral domain OCT performed well with respect to detecting preperimetric glaucoma patients. In the present study, no differences between the affected and unaffected eyes of OAG patients were noted. Consequently, the unaf- fected eyes of OAG patients might have undergone glauco- matous damage before visual field defects, such as altitudi- nal ones, are detected. However, similar RNFL thicknesses were shown in spite of differences of MD between the af- fected and unaffected eyes. The relatively small sample size of OAG patients could affect the results of this study.
In conclusion, altitudinal visual field defects can be asso- ciated with both ischemic optic neuropathy and OAG. Su- perior altitudinal visual field defects are more common in patients with OAG and inferior altitudinal visual field de- fects are more common in patients with NAION. To differ- entiate between altitudinal visual field defects, optic disc head analysis of not only the affected eye, but also the un- affected eye, using spectral domain OCT, may be helpful.
Conflict of Interest
No potential conflict of interest relevant to this article was reported.
References
1. Sethi HS, Lam BL, Romano JG. Reversible prolonged bi- lateral inferior altitudinal visual field defects associated with migraine. J Neuroophthalmol 2012;32:252-5.
2. Shapey J, Danesh-Meyer HV, Kaye AH. Suprasellar me- ningioma presenting with an altitudinal field defect. J Clin Neurosci 2012;19:155-8.
3. Hayreh SS, Podhajsky PA, Zimmerman MB. Branch reti- nal artery occlusion: natural history of visual outcome.
Ophthalmology 2009;116:1188-94.e4.
4. Vuori ML, Mantyjarvi M. Tilted disc syndrome may mim- ic false visual field deterioration. Acta Ophthalmol 2008;86:
622-5.
5. Hayreh SS, Zimmerman B. Visual field abnormalities in nonarteritic anterior ischemic optic neuropathy: their pat- tern and prevalence at initial examination. Arch Ophthal- mol 2005;123:1554-62.
6. Fang JP, Donahue SP, Lin RH. Global visual field involve- ment in acute unilateral optic neuritis. Am J Ophthalmol 1999;128:554-65.
7. Suh MH, Kim SH, Park KH, et al. Comparison of the cor- relations between optic disc rim area and retinal nerve fiber layer thickness in glaucoma and nonarteritic anterior isch- emic optic neuropathy. Am J Ophthalmol 2011;151:277-86.
e1.
8. Danesh-Meyer HV, Boland MV, Savino PJ, et al. Optic disc morphology in open-angle glaucoma compared with ante- rior ischemic optic neuropathies. Invest Ophthalmol Vis Sci 2010;51:2003-10.
9. Seymenoglu G, Baser E, Ozturk B. Comparison of spec- tral-domain optical coherence tomography and Heidelberg retina tomograph III optic nerve head parameters in glau- coma. Ophthalmologica 2013;229:101-5.
10. Kumar V, Ramanathan US, Mushtaq B, Shah P. Artefactu- al uniocular altitudinal visual field defect. Br J Ophthalmol 2002;86:1442-3.
11. Horowitz J, Fishelzon-Arev T, Rath EZ, et al. Comparison of optic nerve head topography findings in eyes with non-arteritic anterior ischemic optic neuropathy and eyes with glaucoma. Graefes Arch Clin Exp Ophthalmol 2010;
248:845-51.
12. Anton A, Moreno-Montanes J, Blazquez F, et al. Useful- ness of optical coherence tomography parameters of the optic disc and the retinal nerve fiber layer to differentiate glaucomatous, ocular hypertensive, and normal eyes. J
Glaucoma 2007;16:1-8.
13. Danesh-Meyer HV, Savino PJ, Sergott RC. The prevalence of cupping in end-stage arteritic and nonarteritic anterior ischemic optic neuropathy. Ophthalmology 2001;108:593-8.
14. Saito H, Tomidokoro A, Tomita G, et al. Optic disc and peripapillary morphology in unilateral nonarteritic anterior
ischemic optic neuropathy and age- and refraction-matched normals. Ophthalmology 2008;115:1585-90.
15. Lisboa R, Leite MT, Zangwill LM, et al. Diagnosing prepe- rimetric glaucoma with spectral domain optical coherence tomography. Ophthalmology 2012;119:2261-9.